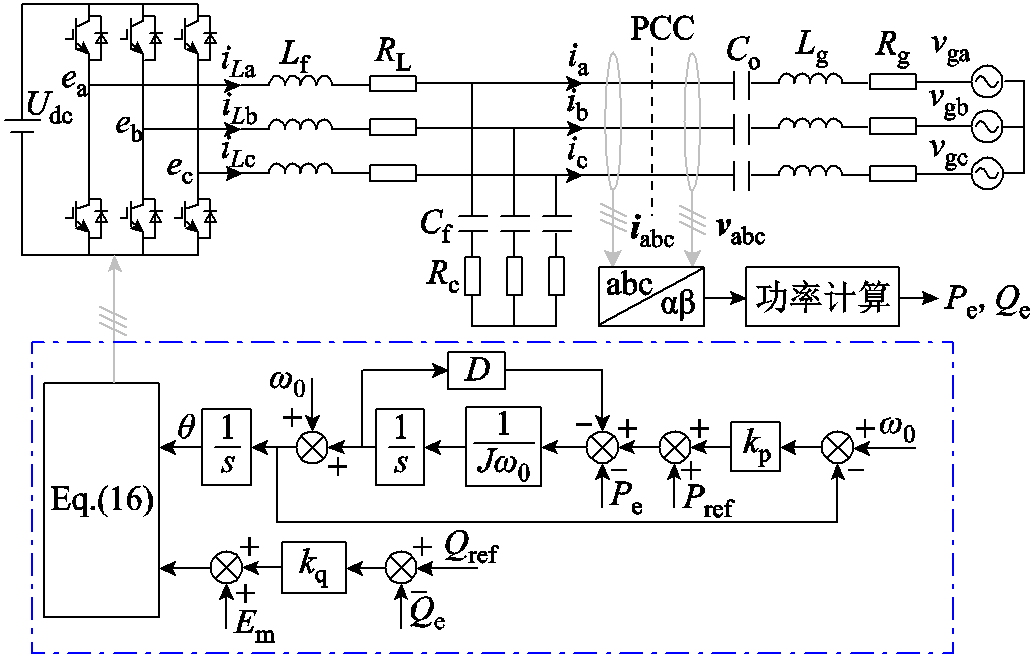
图1 构网型变流器主电路拓扑及控制框图
Fig.1 Main circuit topology and control block diagram of the grid-forming converter
摘要 类似于同步发电机,构网型变流器多采用功率同步或惯量同步控制策略,可为电网提供惯性和阻尼支撑。然而,构网型变流器与同步发电机类似的外特性导致其通过串联电容补偿线路接入电网时易发生次同步振荡。鉴于此,该文首先采用复变量表示法建立构网型变流器的自阻抗和伴随阻抗模型,计及串联电容补偿线路以及频率耦合效应的影响,推导得到系统单输入单输出等效阻抗模型,基于阻抗判据,分析不同串补度以及频率耦合效应对并网系统稳定性的影响;其次提出一种基于并网电流反馈的阻抗重塑控制策略,将用于提升稳定性的反馈系数k引入等效阻抗模型中,建立反馈系数-频率二元阻抗模型,利用幅相等值线图对反馈系数k进行设计以实现次同步振荡的抑制;最后,通过仿真和实验验证稳定性分析结果的正确性以及所提振荡抑制策略的有效性。
关键词:构网型变流器 复变量 等效阻抗 稳定性分析 振荡抑制
在“双碳”目标的驱动下,我国正在构建以新能源为主体的新型电力系统。随着风电、光伏等新能源发电装置大规模接入电网,电力电子设备在电力系统中的占比不断提高,已然成为电力系统的重要组成部分,其中并网变流器承担了关键组件的角色[1-4]。对于并网变流器的控制方式,目前实际工程中广泛采用跟网型控制方式,其本质上是将变流器控制为电流源,因此在正常运行时需要电力系统中存在电压源为其并网点构建电压。然而随着新能源机组不断并入电网以及传统同步发电机在电力系统中占比的减小,系统惯性大幅度降低[5-7],给跟网型变流器的稳定运行带来了巨大的挑战[8]。
为提升“双高”系统的稳定性,需要将高渗透率下的新型电力系统中部分变流器控制成电压源[9-11],因此构网型控制被广泛研究,其通过模拟传统同步发电机的外部特性,可为电网提供可靠的电压、频率支撑,补偿系统缺失的惯性和阻尼[12-16]。目前,构网型控制的优势在高压直流输电[17]、风力发电[18-20]、光伏发电[21-22]等多个领域中被探索。研究表明,由构网型控制主导的电力系统在弱电网下有较好的稳定性[23],然而当系统短路比较高时,构网型变流器易与电网发生交互,导致系统在基频附近相位裕度不足,从而产生谐波振荡甚至失稳[24-25]。
另一方面,新能源发电主要建设在平原、沙漠等偏远地区,需要经过高压直流输电等长距离输电方式将电能输送到负荷中心[26]。为提高输电能力以及降低输电线路阻抗造成的功率损耗,电力系统常采用串联电容补偿方案[27]。文献[28]指出构网型变流器的端口特性具有与同步发电机相似的外特性,其序阻抗在中低频段基本呈感性。而串联电容补偿线路在低频段呈容性,因此构网型变流器经串补线路接入电网有发生次同步振荡的风险。文献[29]基于序阻抗模型研究了虚拟同步机(Virtual Synchronous Generator, VSG)串联补偿并网系统的稳定性,并提出了带时延补偿的调制信号前馈有源阻尼控制策略,对次同步振荡进行了抑制。然而,该文献中建立VSG序阻抗模型过程中并未考虑频率耦合效应给系统稳定性带来的影响,且所提抑制方法中虚拟电阻取值较大时会引起系统工作点的偏移,产生功率损耗。在文献[25, 30]中指出,频率耦合效应在稳定性分析中不应该被忽略,若忽略频率耦合会导致基频附近阻抗测量值与理论值之间存在偏差,导致稳定性分析结果不准确。
鉴于此,本文针对构网型变流器经串联电容补偿线路并入电网发生次同步振荡失稳以及抑制开展研究工作。首先,基于复系数法建立了计及频率耦合效应的构网型变流器等效阻抗模型,采用阻抗稳定性判据分析了不同串补度下系统的并网稳定性以及频率耦合效应对系统稳定性的影响;其次,提出一种基于电流反馈的次同步振荡抑制策略,利用幅相特性等值线图对用于提升构网型变流器并网稳定性的反馈系数进行了参数设计;最后,通过仿真及实验对理论分析进行了验证。
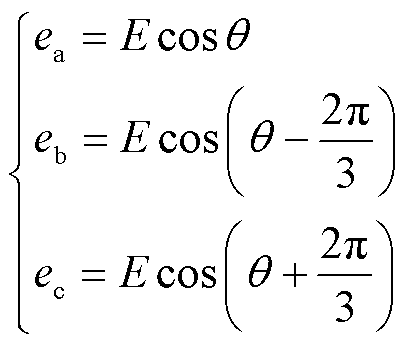
构网型变流器采用VSG控制方式。其控制策略与同步发电机类似,不需要借助锁相环便可实现同步,更适宜应用到系统强度弱、物理惯性低的电网中。
图1 构网型变流器主电路拓扑及控制框图
Fig.1 Main circuit topology and control block diagram of the grid-forming converter
图1为本文所采用的构网型变流器主电路拓扑及系统控制框图。图1中,Udc为直流侧电压;ea、eb、ec为变流器的中点桥臂电压;iLa、iLb、iLc为滤波电感电流;iabc为并网电流;vabc为并网电压;vga、vgb、vgc为电网电压;Lf、Cf、RL和Rc分别为滤波电感、滤波电容、寄生电阻和阻尼电阻;Co为串联补偿电容;Lg、Rg分别为电网电感和电阻。
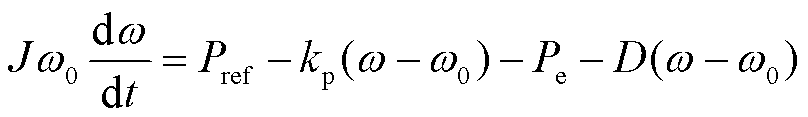
VSG控制主要包括功率计算、控制模块以及调制信号生成模块。功率控制模块中的有功控制结构包括转子运动方程和一次调频环节,表达式为
 (1)
(1)
式中,Pref为有功功率参考值;Pe为输出功率检测值; 为基波电压角频率;J、kp、D分别为虚拟转动惯量、一次调频系数以及阻尼系数。
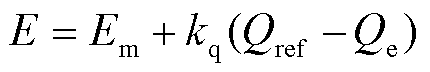
无功控制结构模拟同步发电机的一次调压环节,其数学方程为
 (2)
(2)
式中,Qref、Qe分别为无功功率参考值和检测值;kq为一次调压系数;E为光功环输出电压;Em为输出参考电压幅值。
并网逆变器系统中dq轴控制器结构或参数的不对称,会导致系统在静止坐标系下存在两个扰动频率分量相互耦合,且这两个耦合频率满足fp和2f0-fp的关系[31]。具体而言,基于VSG控制的构网型变流器系统中的频率耦合效应可结合VSG的控制结构进行详细说明。在电网侧注入频率为fp的扰动信号,该扰动进入功率控制环路时因功率计算、电压参考幅值计算等过程,使系统相位及幅值参考发生了基波频率偏移,之后经过dq/abc变换后,输出的三相信号中将包含fp和2f1-fp频率下的扰动电压电流响应[24]。
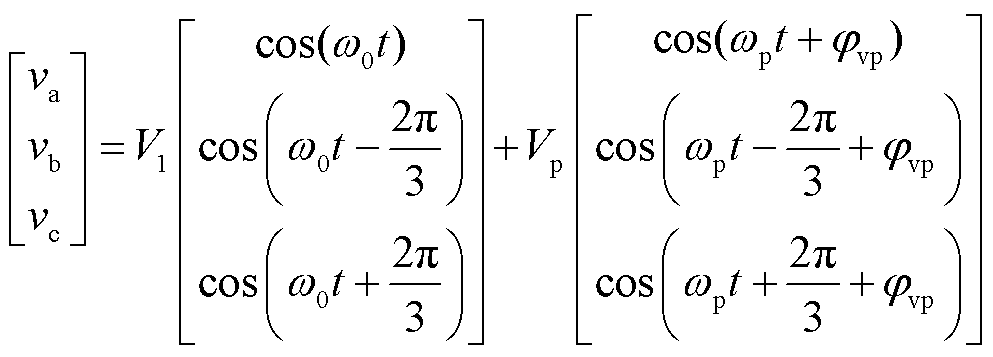
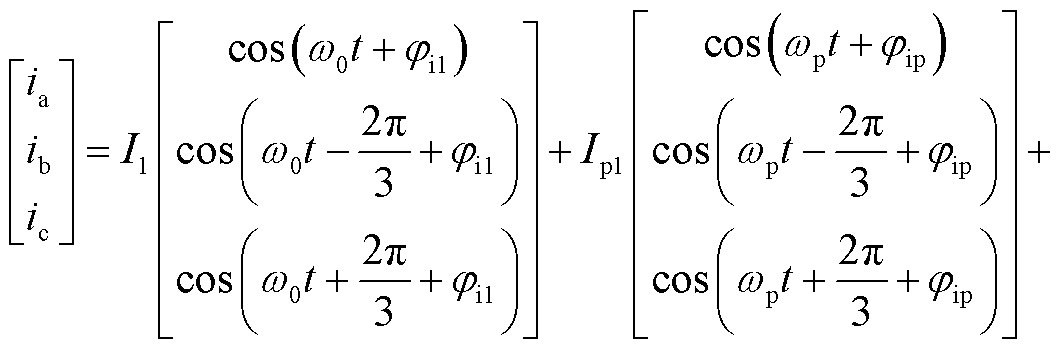
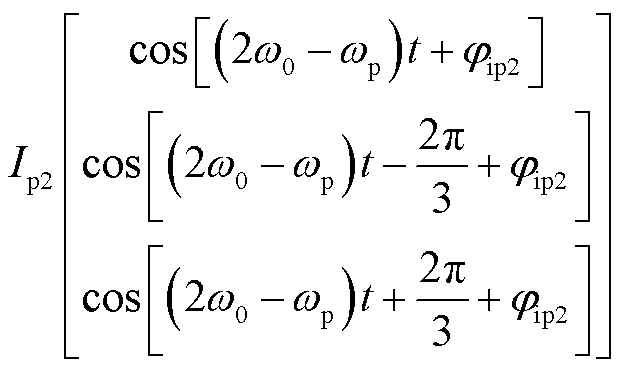
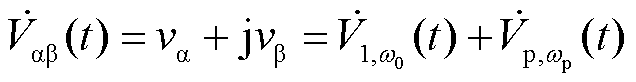
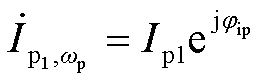
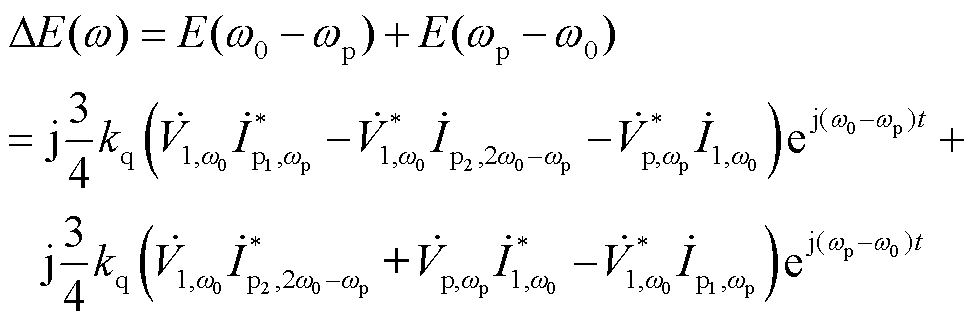
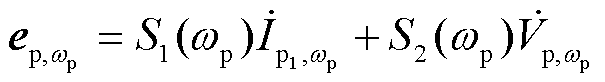
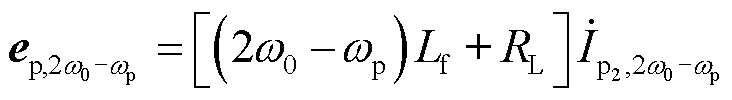
因此,在变流器电网侧注入wp频率下的扰动电压,VSG的输出电流会包含wp和2w0-wp频率下的两个分量,那么理想电网下扰动注入后公共连接点(Point of Common Coupling, PCC)电压电流的表达式为
 (3)
(3)
 (4)
(4)
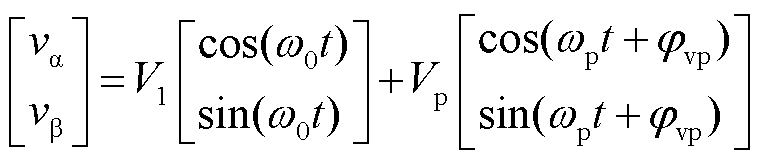
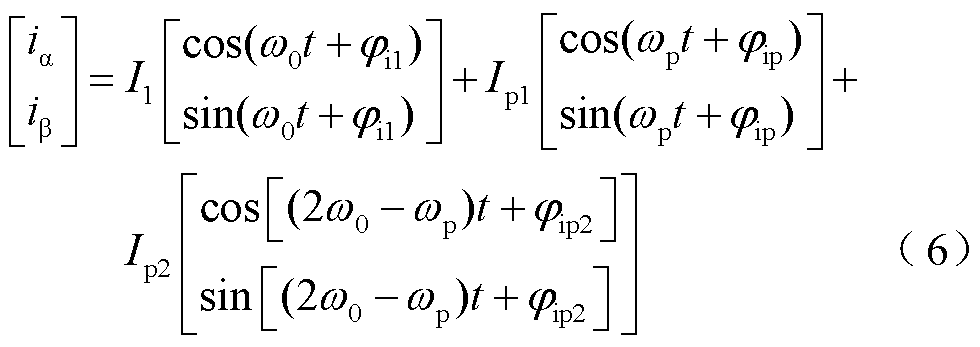
式中,V1为基波电压幅值;Vp、wp、jvp分别为扰动电压幅值、角频率和初相位。引入负频率来表示负序分量,当wp>0时,Vp为正序分量;当wp<0时,Vp为负序分量。I1、Ip1、Ip2分别为基波电流幅值、wp频率下以及2w0-wp频率下的扰动电流幅值;ji1、jip、jip2分别为基波电流初相位、wp频率下以及2w0-wp频率下的扰动电流的初相位。
三相电压和电流信号经过Clarke变换得到ab坐标系下的分量,即
 (5)
(5)
在ab坐标系下构建电压电流的复变量形式为
 (7)
(7)
 (8)
(8)
三相基波电压 、扰动电压分量
 的复变量分别表示为
 =
= ,
,
 ;对应的电压向量分别表示为=
 、
、 。
。
三相基波电流 、wp频率下电流分量
 、2w0-wp频率下电流分量
 的复变量分别表示为
 ,
, ,
,
 ;对应的电流相量分别为
 、
、 和
和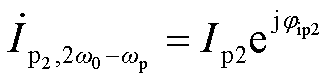 。
。
采用三相交流电压和电流的复变量计算复功率得
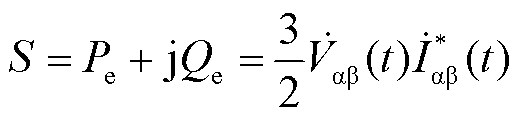 (9)
(9)
式中,*代表共轭。
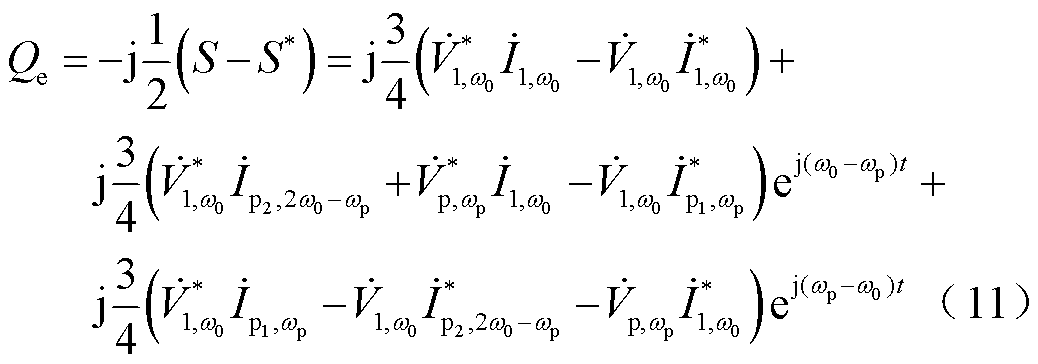
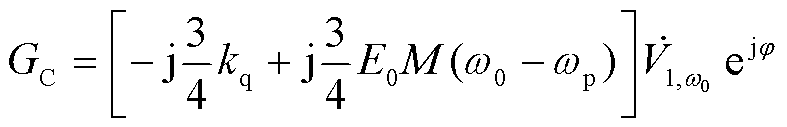
将式(7)和式(8)代入式(9)中可得有功功率的复变量表达式为
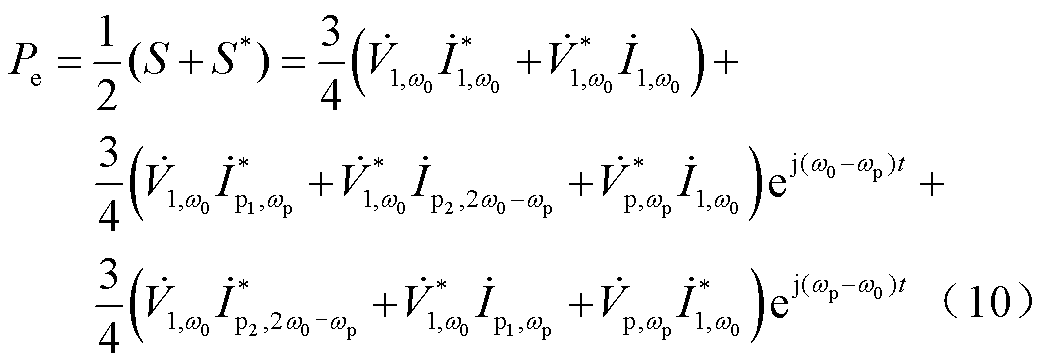
同理,可得无功功率的表达式为
根据VSG的有功控制模块可得输出电压的相位参考值 为
为
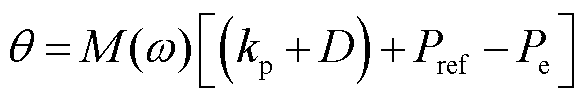 (12)
(12)
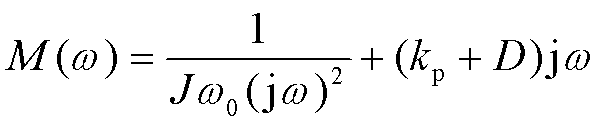 (13)
(13)
将有功功率表达式(10)代入式(12)中可得
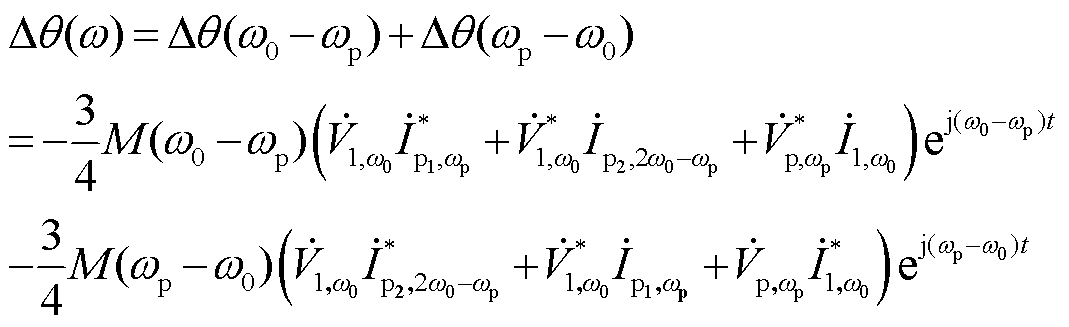 (14)
(14)
将式(11)代入无功控制器中可得VSG输出电压幅值参考的扰动量为
 (15)
(15)
根据式(14)和式(15)可知,功率扰动量经过功率环控制后产生了两个频率下的输出电压相位扰动以及幅值扰动。
VSG功率环得到输出电压幅值 、相位参考值后,通过式(16)产生三相调制波
 。
。
 (16)
(16)
式(16)在ab坐标系下的复变量形式为eab(t)= Eejq,对其进行小信号线性化可以得到
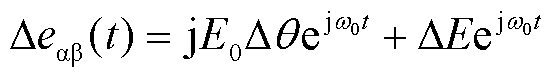 (17)
(17)
式中, 为桥臂中点电压的稳态工作点。
由式(17)可以看出,桥臂中点电压的扰动量由两部分构成,一部分为相位扰动引起,另一部分由幅值扰动引起。将输出电压参考幅值以及相位代入式(17)中,可以得到桥臂中点电压的扰动量为
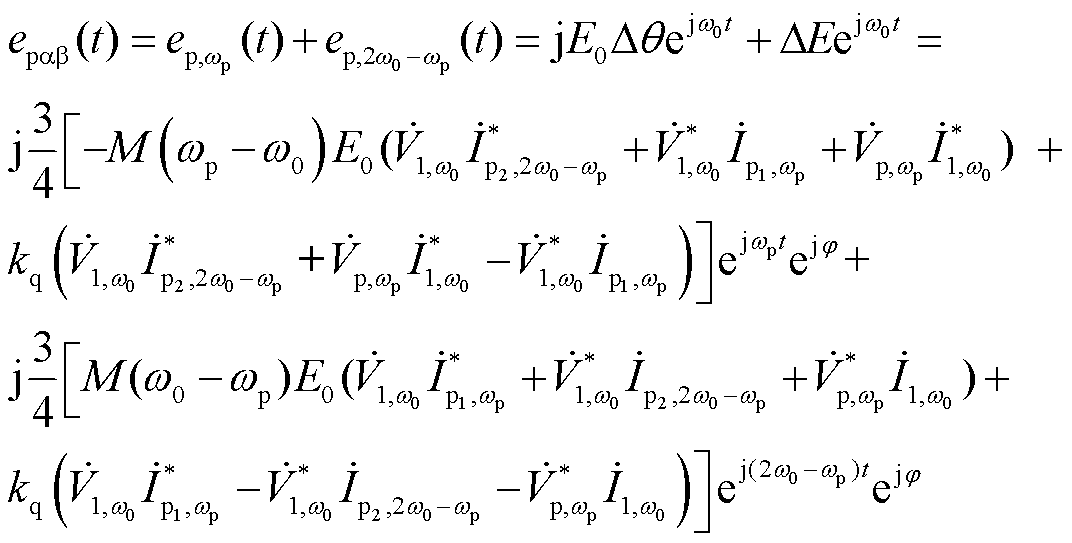 (18)
(18)
静止坐标系下,构网型变流器功率电路模型在频率wp以及2w0-wp下的小信号方程为
 (19)
(19)
 (20)
(20)
其中
 (21)
(21)
 (22)
(22)
联立式(19)和式(20)可以得到构网型变流器的自阻抗ZSA(wp)以及伴随阻抗ZAA(wp),用于表征构网型变流器的单频率输入双频率输出现象。
 (23)
(23)
 (24)
(24)
其中
 (25)
(25)
 (26)
(26)
 (27)
(27)
 (28)
(28)
其中
 (29)
(29)
 (30)
(30)
式中,j为桥臂中点电压与并网电压的相位差,j = arcsin[2w0LfPref/(3E0V1,w0)]。
根据以上推导可知,构网型变流器系统的单频率输入双频率输出特性是由于功率计算产生频率偏移,进而导致输出幅值以及相位出现相同频率下的扰动,之后经过反Park变换造成wp以及2w0-wp频率下的输出响应。因此,自阻抗和伴随阻抗可以很好地解释并表征构网型变流器单频率输入双频率输出特性。
为了验证自阻抗与伴随阻抗模型的正确性,在Simulink中搭建图1所示的构网变流器并网系统模型,模型参数见表1,电网为理想电网(Co=0、Lg=0、Rg=0)。在电网电压处注入三相对称小扰动信号,测量PCC处的电压和电流信号,通过快速傅里叶变换(Fast Fourier Transform, FFT)分析获得其wp和2w0-wp频率下的分量,并根据自阻抗和伴随阻抗的定义计算得到测量模型。
表1 构网型变流器系统参数
Tab.1 The grid-forming converter system parameters
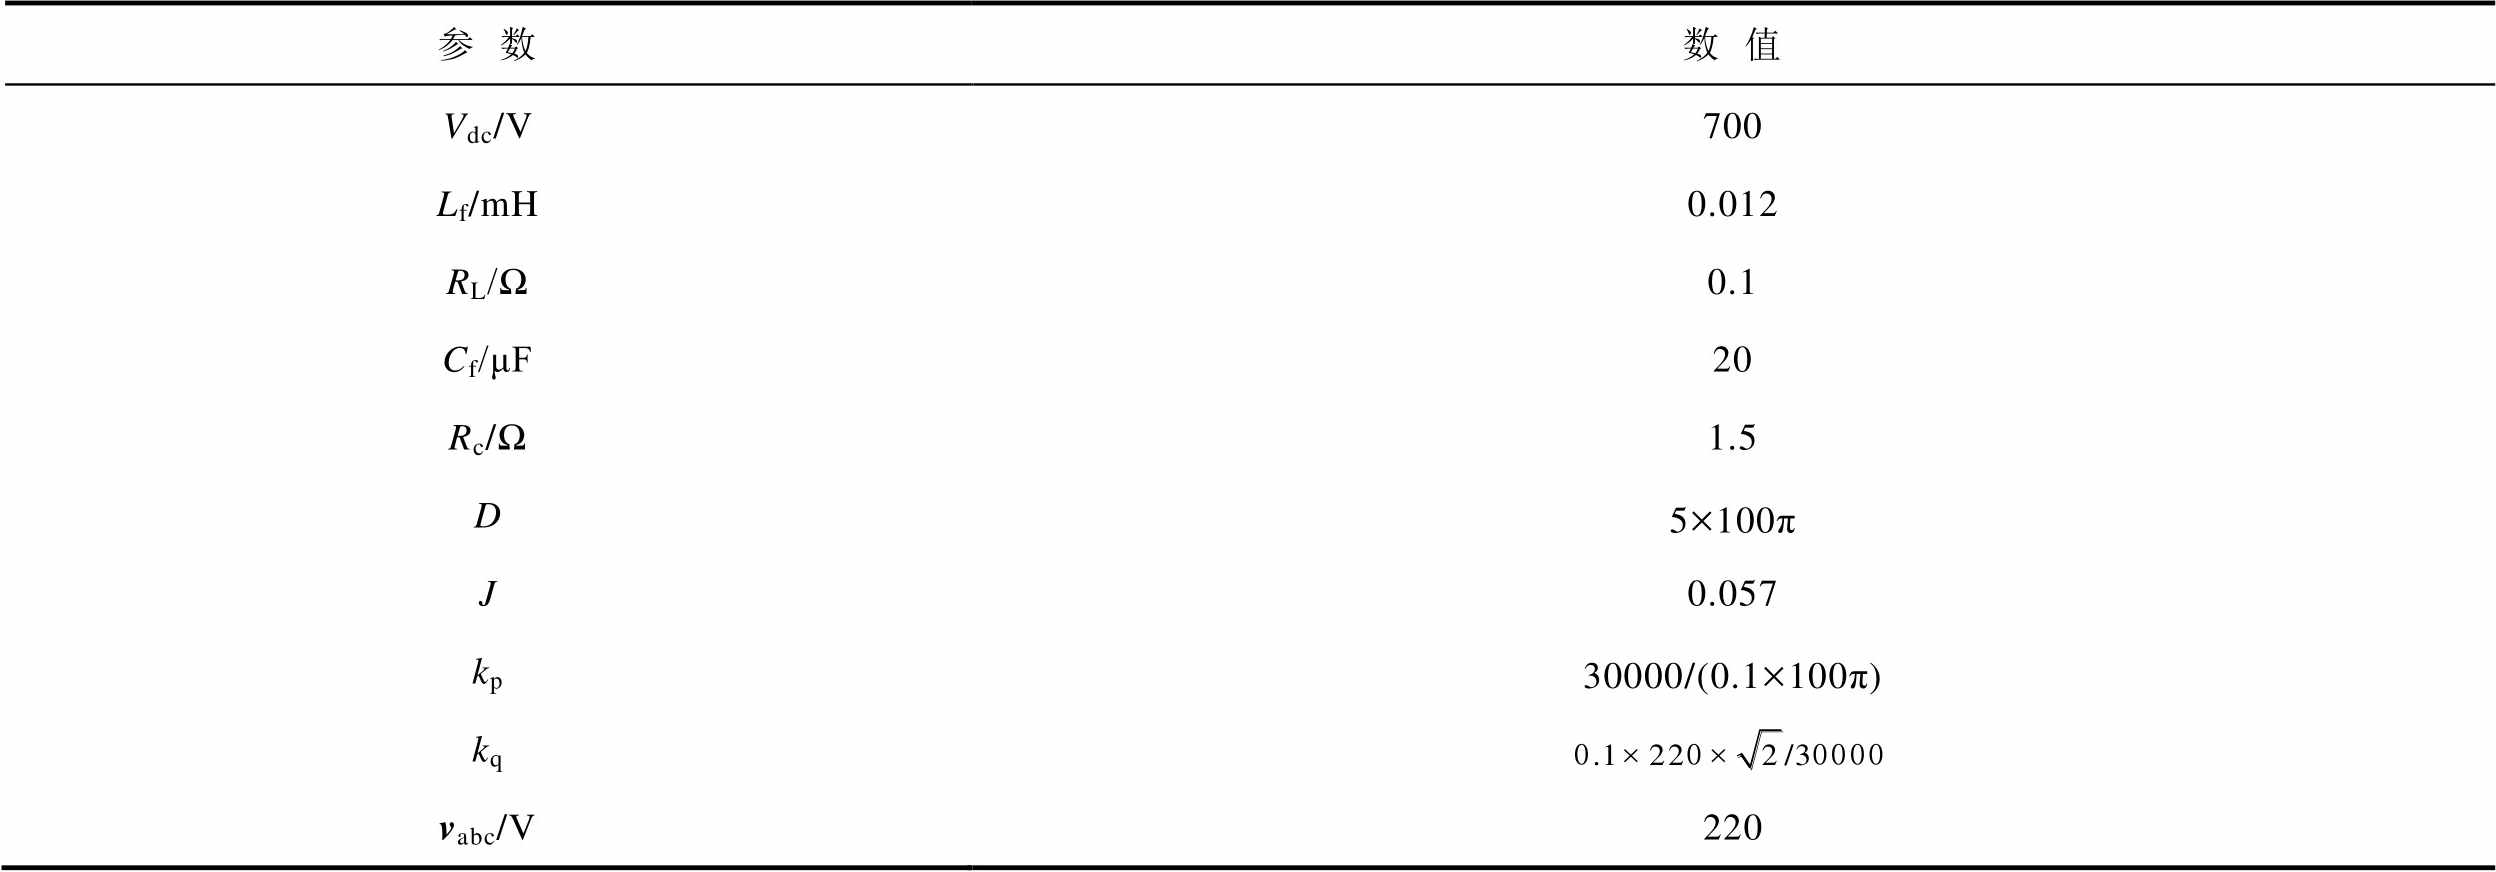
参数数值 Vdc/V700 Lf/mH0.012 RL/Ω0.1 Cf/μF20 Rc/Ω1.5 D5´100π J0.057 kp30000/(0.1´100π) kq vabc/V220
图2和图3分别给出了构网型变流器自阻抗ZSA(wp)和伴随阻抗ZAA(wp)的验证结果,曲线(蓝色)是根据式(23)以及式(24)解析模型绘制的幅频和相频曲线,圆圈(红色)为仿真测量计算得到的数据点。从图2和图3可以看出,仿真测量结果与解析模型吻合得较好,验证了构网型变流器自阻抗和伴随阻抗解析模型的正确性。
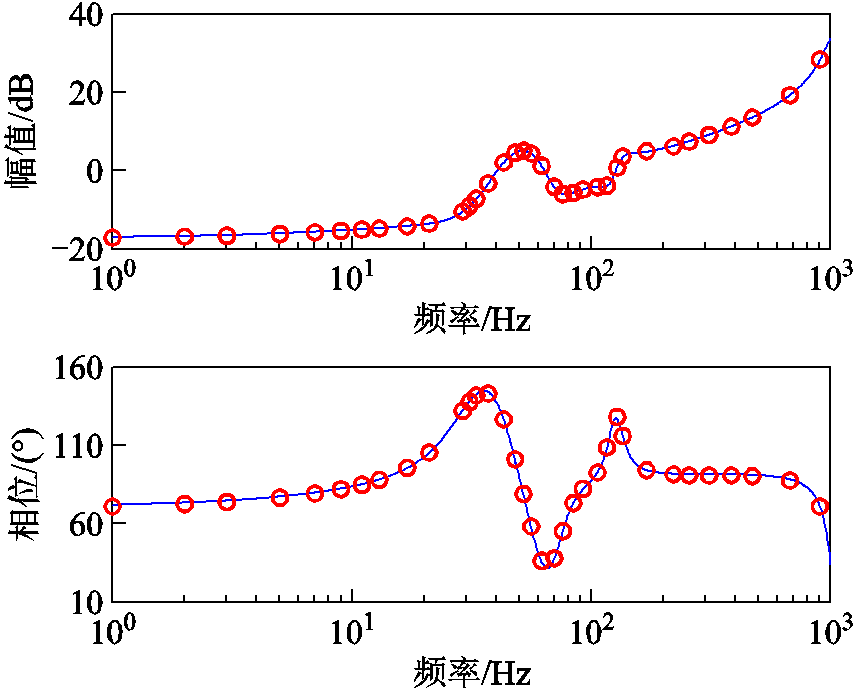
图2 自阻抗模型ZSA和仿真测量结果
Fig.2 Self-impedance model ZSA and simulation measurement results
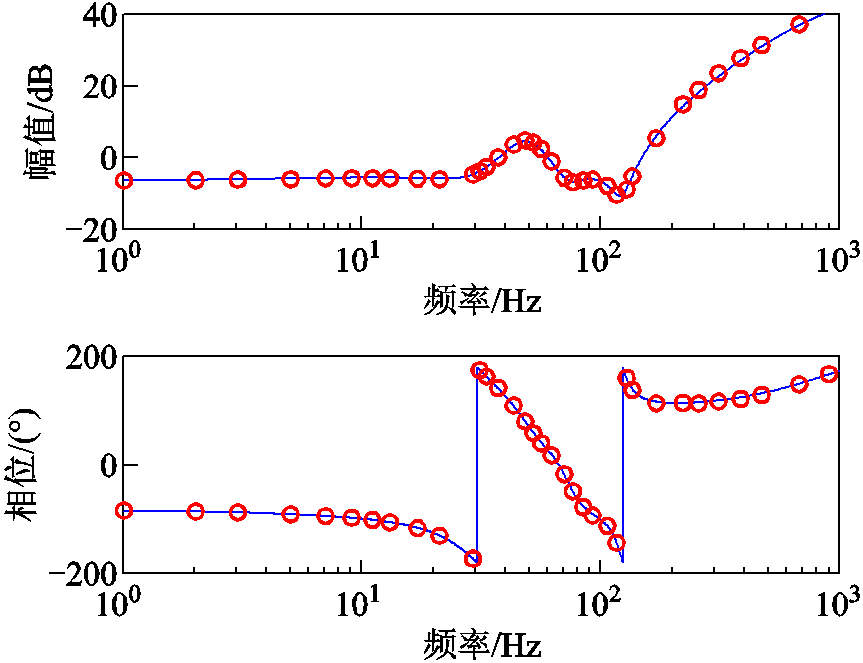
图3 伴随阻抗ZAA和仿真测量结果
Fig.3 Accompanying impedance ZAA and simulation measurement results
由1.2节构网型变流器系统的单输入双输出特性分析表明,在电网侧施加一个频率为wp的扰动 ,会产生两个频率下的扰动电流
 以及
以及 。由于电网阻抗的存在,扰动电流通过电网阻抗在PCC将产生对应的两个频率分量,即
 (31)
(31)
电网侧PCC处频率wp和2w0-wp下扰动电压与扰动电流之间的关系为
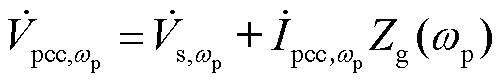 (32)
(32)
 (33)
(33)
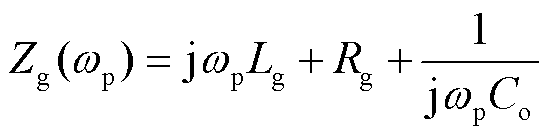
式中, 为包含串联补偿电容的电网阻抗,表示为
另外,根据自阻抗与伴随阻抗的解析式可以得到
 (34)
(34)
 (35)
(35)
根据式(32)~式(35)可得构网型变流器并网系统的小信号框图,由此得到构网型变流器频率耦合关系框图如图4所示。
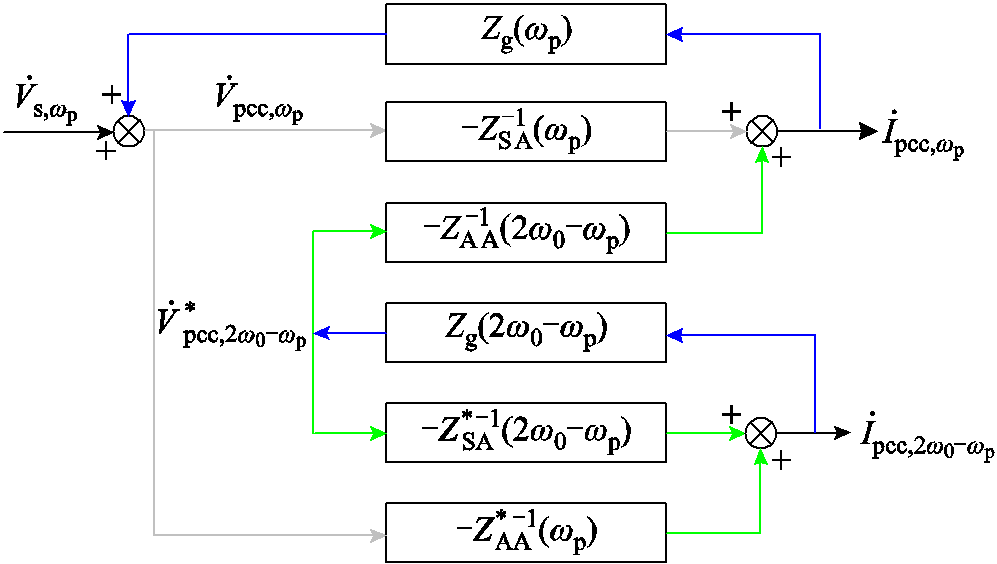
图4 构网型变流器频率耦合关系框图
Fig.4 Block diagram of frequency coupling relationship for the grid-forming converter
由图4可推导得到考虑频率耦合效应的等效阻抗模型,即
 (36)
(36)
式中, 为频率
为频率 时的电网导纳。
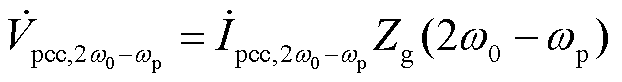
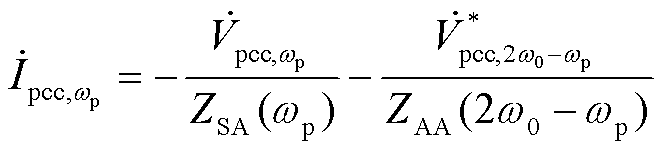
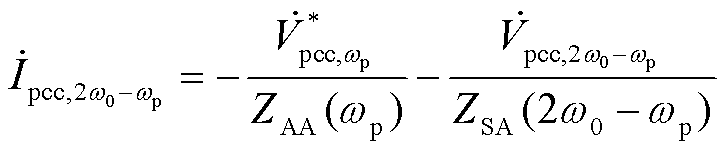
此时,构网型变流器系统在频率wp下的并网电流满足
 (37)
(37)
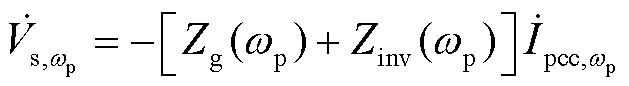
构网型变流器对外等效成电压源,根据图4扰动电压电流传递函数关系,可以将系统视作输入为电压激励 、输出为电压响应
 的负反馈闭环系统,整个系统的开环传递函数为
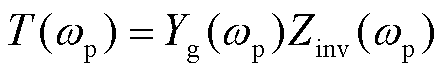 (38)
(38)
因此,采用奈奎斯特判据判定Yg(wp)Zinv(wp)项的稳定性即可分析出构网型变流器的并网稳定性。
串补线路中通常采用串补度K=XC/XL来衡量其补偿能力,其中,XC为线路容抗,XL为线路感抗。本文中串补电容C=0.02 F,通过改变电网电感值来分析构网型变流器经串补线路并网的稳定性。取Lg分别为6 mH、9 mH、12 mH代表不同的补偿程度进行分析,此时系统串联补偿度分别为84%、56%、42%。绘制出不同串补度下T(wp)对应的奈奎斯特曲线,如图5所示。T(wp)不含右半平面极点,因此判断系统是否稳定只需观察奈奎斯特曲线是否包围(-1, j0)点即可。从图5可以看出,当串补度为84%和56%时,奈奎斯特曲线包围(-1, j0)点,系统失稳;当串补度为42%时,奈奎斯特曲线不包围(-1, j0)点,由此可以判定出系统稳定。此外,串补度越大,系统稳定性越差。图6给出了系统在不同串补度下的并网电流波形。根据图6可知,当串补度为84%时,系统起始于负阻尼发散,迅速失稳;当串补度为56%时,系统逐渐发散;当串补度为42%时,系统最终达到稳定。
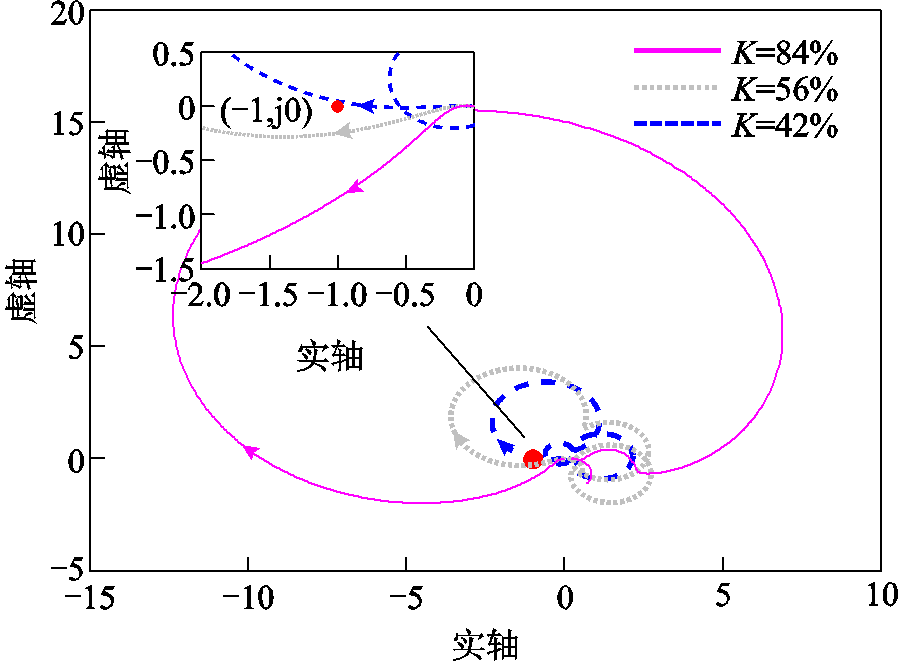
图5 不同串补度下对应的奈奎斯特曲线
Fig.5 Corresponding Nyquist curves for different series compensation level
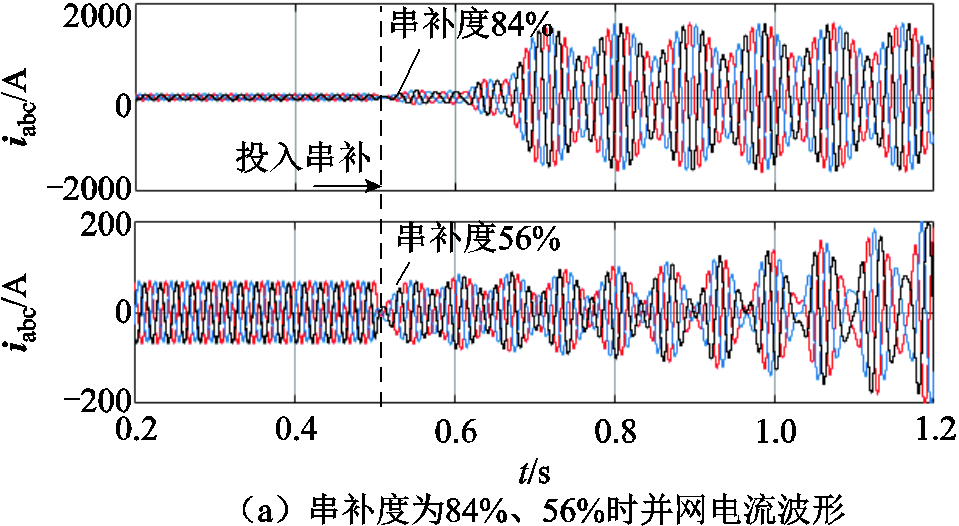
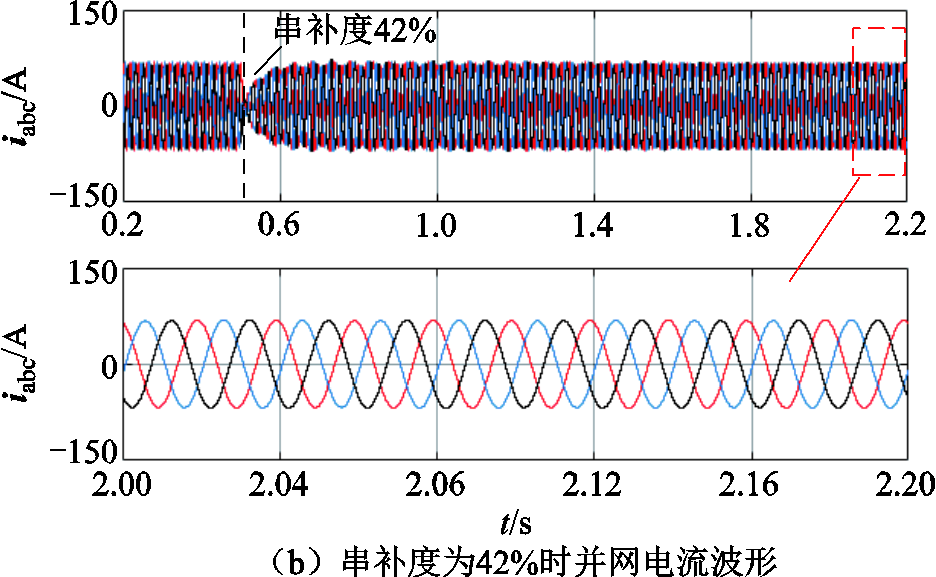
图6 不同串补度下系统并网电流波形
Fig.6 Grid-connected current waveforms of the system with different series complementary degrees
由式(34)可知,当不考虑频率耦合效应时,系统开环传递函数为
 (39)
(39)
当系统串补度为42%时,绘制考虑频率耦合以及不考虑频率耦合的奈奎斯特曲线,如图7所示。由图7可知,计及频率耦合进行稳定性分析时,系统奈奎斯特曲线(蓝色虚线)不包围(-1, j0)点,系统稳定;忽略频率耦合效应时,系统开环传递函数的奈奎斯特曲线(黑色实线)包围(-1, j0)点,系统不稳定;由此可知,二者稳定性分析结果相反。
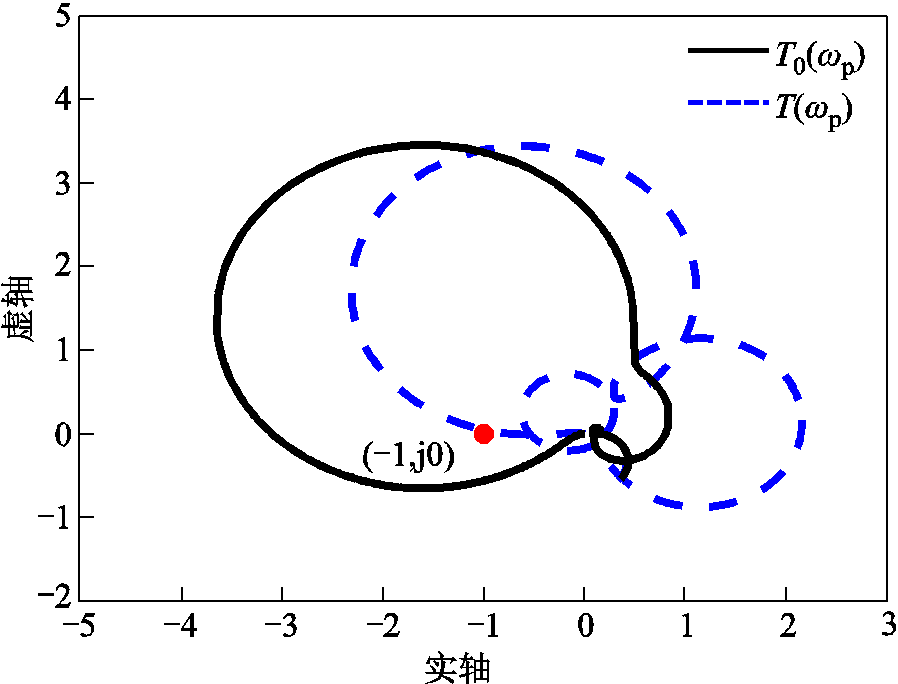
图7  和
和 的奈奎斯特曲线
Fig.7 Nyquist curves for and
图8给出了串补度为42%时,考虑频率耦合效应前后ZSA(wp)和等效阻抗Zinv(wp)与电网阻抗Zg(wp)的频率特性曲线。由图8可知,频率耦合效应对变流器输出阻抗与电网阻抗交点处的相位产生了影响,计及频率耦合时谐振点处的相位裕度为正,忽略频率耦合时谐振点的相位裕度为负。从图6b并网电流波形可以看出,该工况下系统是稳定的,说明考虑频率耦合效应进行稳定性分析在某些工况下更加准确。
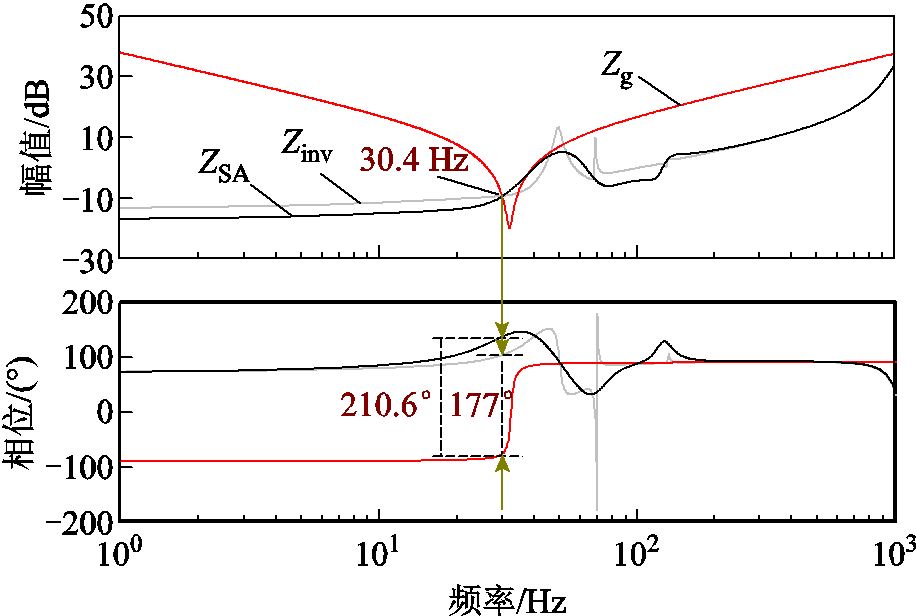
图8 频率耦合效应对输出阻抗特性的影响
Fig.8 Influence of frequency coupling effects on output impedance characteristics
本节将提出一种基于并网电流反馈的阻抗重塑策略,并给出反馈系数k的设计方法。该策略采集得到并网点电流信号,其经过陷波滤波器以及反馈系数后作为桥臂中点输出电压的一部分,阻抗重塑控制框图如图9所示。其中陷波滤波器的作用是维持基频输出阻抗,避免变流器出现工作点偏移问题。实际输电线路中的串联补偿度通常保持在40%~60%之间,由第2节分析可知,系统的串补度越高,系统越容易失稳。因此本节以系统串补度为84%的工况进行阻抗重塑策略研究,这样可以保证所得到的反馈系数设计结果在串补度为40%~60%时仍然有效。

图9 阻抗重塑控制框图
Fig.9 Impedance remodeling control block diagram
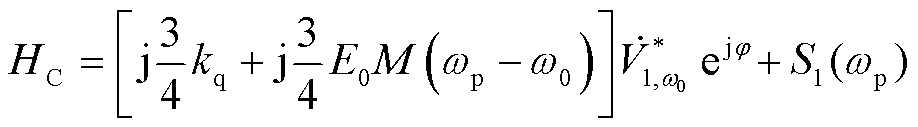
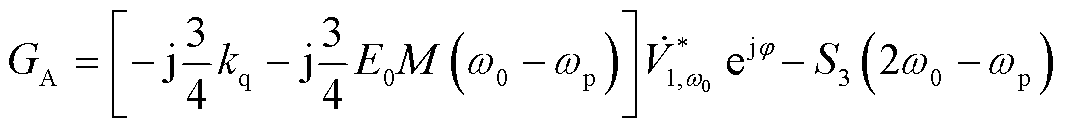
经推导,加入阻抗重塑控制策略后,构网型变流器自阻抗与伴随阻抗表达式中HC以及GA发生了变化,其他表达式保持一致,变化后的表达式为
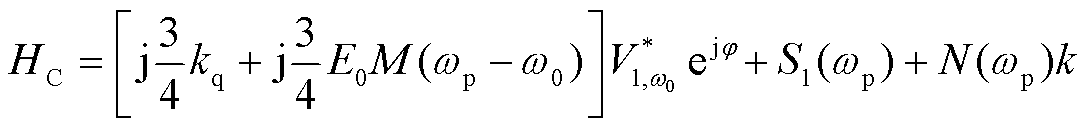 (40)
(40)
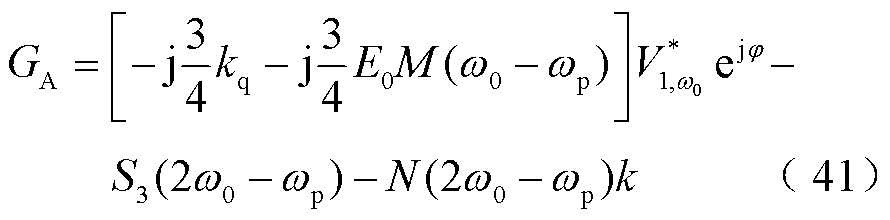
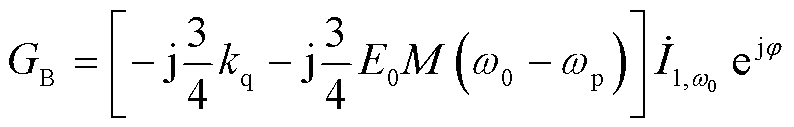
其中
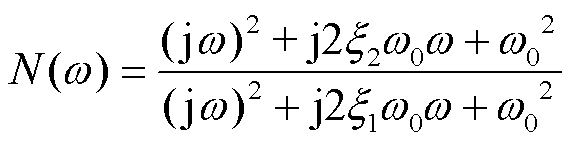 (42)
(42)
式中,x1和x2为陷波系数, 0.018 8,
 -4.7× 10⁻⁴;w0 =100π rad/s。
将反馈系数k引入构网型变流器阻抗模型中,计及频率耦合效应,可得到变流器反馈系数-频率二元等效阻抗模型为
 (43)
(43)
那么加入阻抗重塑控制策略后,系统等效开环传递函数变为关于反馈系数-频率的二元函数,即
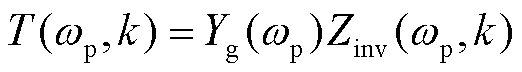 (44)
(44)
由式(44)可知,只要保证二元开环传递函数稳定,就可以得到反馈系数的取值范围。
反馈系数k作为重塑构网型变流器输出阻抗的重要参数,其合理取值可以提高系统阻尼,进而达到抑制振荡的效果。对于T(wp, k),可求出其幅频响应M(wp, k)和相频响应j(wp, k)分别为
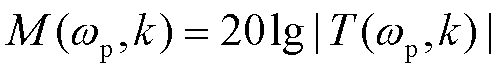 (45)
(45)
 (46)
(46)
当反馈系数从0变化到1时,绘制二元等效开环传递函数T(wp, k)的三维幅频响应M(wp, k)和相频响应j(wp, k),如图10所示。
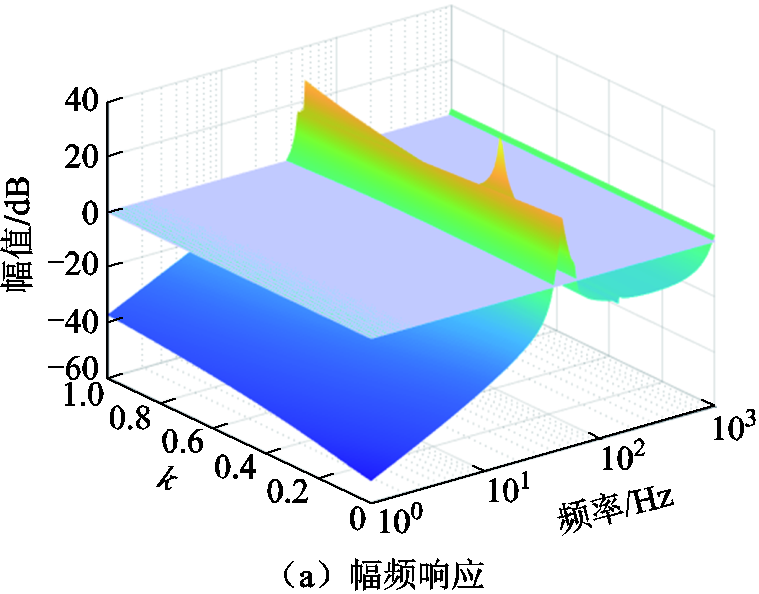
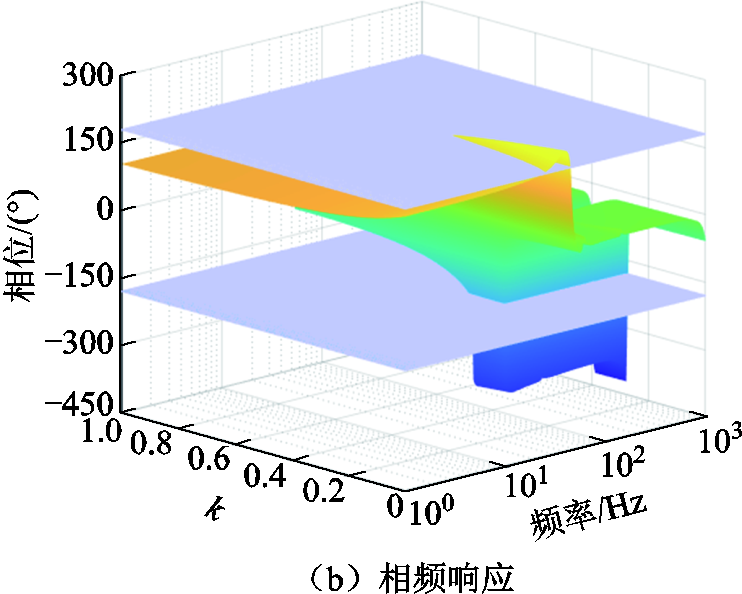
图10 二元开环传递函数T(wp,k)对应的三维伯德图
Fig.10 3D Bode plot corresponding to the binary open-loop transfer function T(wp,k)
在图10的三维伯德图中的k-f平面内绘制出二元开环传递函数T(wp, k)的0 dB幅值等值线以及kp(k为奇数)的相位等值线,对应图10中浅紫色平面。将0 dB幅值等值线以及kp的相位等值线所截部分投影到k-f所对应平面上,可以得到如图11所示的幅相特性等值线图。
图11 幅相特性等值线图
Fig.11 Amplitude-phase characteristic contour plot
对于开环稳定的系统,在幅值增益大于0的频段范围内,如果相频曲线穿越每条kp(k为奇数)线的次数均为偶数,则闭环系统稳定[32]。对应到幅相等值线图中,当kÎ[0,1]时,在幅值增益M(wp, k)>0(图11阴影部分)的区域内,对应某一反馈系数k0,绘制一条平行于频率轴的点线,如图中紫色点线所示。若点线与T(wp, k)=kp(k为奇数)交点个数为偶数,则在该反馈系数k0下,系统稳定。
在图11中,幅值增益大于0的区域内,对应每一个反馈系数,平行于频率轴的点线与0 dB线都会有两个交点,说明系统存在两个谐振点。因此,使系统稳定的条件为当且仅当每一个交点对应的平行于频率轴的点线与T(wp,k)=kp(k为奇数)交点都是偶数个。从图11可以看出,灰色区域内j(wp,k)= 180°等值线与点线交点是偶数个对应反馈系数的区间为(0.39, 0.43)以及(0.43, 1),说明谐振点A在此区间内是稳定的;而j(wp,k)=-180°等值线与点线交点个数为偶数的区间为(0, 0.28)以及(0.39, 1),说明谐振点B在此区间内是稳定的;若要保证变流器系统是稳定的,需保证谐振点A和B都是稳定的。因此能够使系统稳定的反馈系数的取值区间是两个谐振点稳定区间的交集,为0.39~0.43以及0.43~1。由此可以看出,只要保证谐振点A稳定,就能保证变流器系统是稳定的。
另外,在图11中绘制相位分别为170°、160°、150°以及-170°、-160°、-150°的等值线,谐振点A对应下的170°、160°、150°相位等值线与 0 dB线交点所对应的反馈系数分别为0.46、0.53、0.59,此时系统的相位裕度分别是10°、20°、30°。由此可以看出,临界状态下,反馈系数k取值越大,系统相位裕度越大,系统越稳定。
取k=0.5,绘制系统串补度为84%时,阻抗重塑前后等效阻抗的频率特性曲线,如图12所示。图中蓝色线是阻抗重塑前系统Zinv(wp)的频率特性曲线,此时其与电网阻抗Zg(wp)交点处的相位差大于180°,系统失稳。阻抗重塑后Zinv(wp)的频率特性曲线(黑色线)与电网阻抗Zg(wp)的交点仍在次同步频段内,但其相频曲线整体下移,尤其在50 Hz以下的频段内相频曲线大幅度下移,致使谐振点处的相位差小于180°,系统相位裕度提高,振荡被抑制。
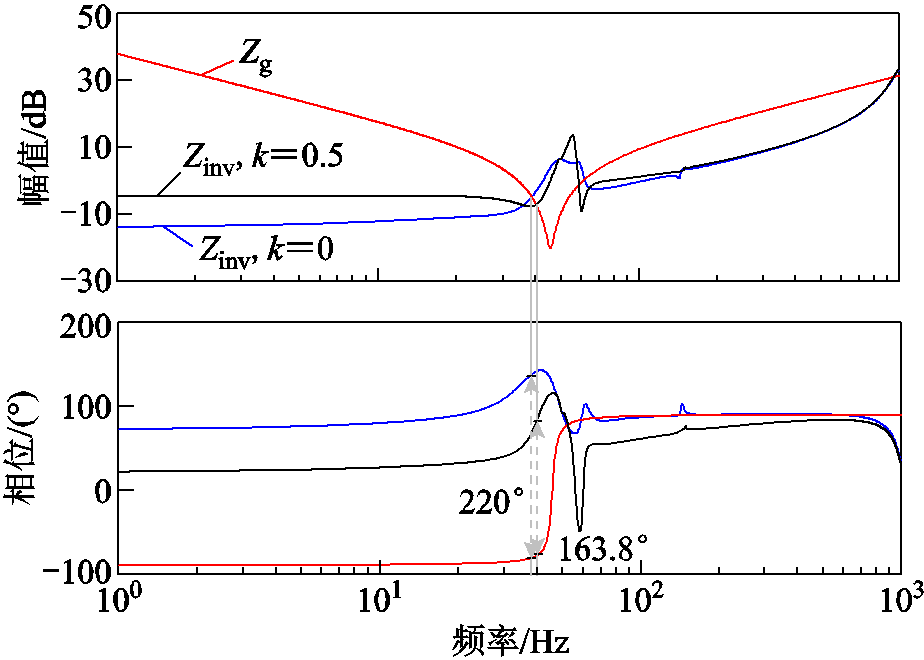
图12 系统阻抗重塑前后Zinv(wp)的频率特性对比
Fig.12 Comparison of frequency characteristics of Zinv(wp) before and after system impedance remodeling
在Matlab/Simulink中搭建构网型变流器仿真模型以验证理论分析结果的正确性。参数取值见表1,系统串补度为84%。由第3节分析可知,当反馈系数k取值在(0.39, 0.43)以及(0.43, 1)之间时,系统稳定。设置系统在0.5 s时反馈系数由0.38变为0.42,并网电流波形如图13a所示;图13b给出了系统在0.5 s时反馈系数由0.38变为0.50时的并网电流波形。图14给出了k=0.38时的并网电流FFT分析结果,结果显示,PCC电流起初包含频率为40 Hz和60 Hz的振荡分量。根据图13可得,当k=0.38时系统出现振荡现象,之后k变为0.42和0.50,均能使系统稳定。
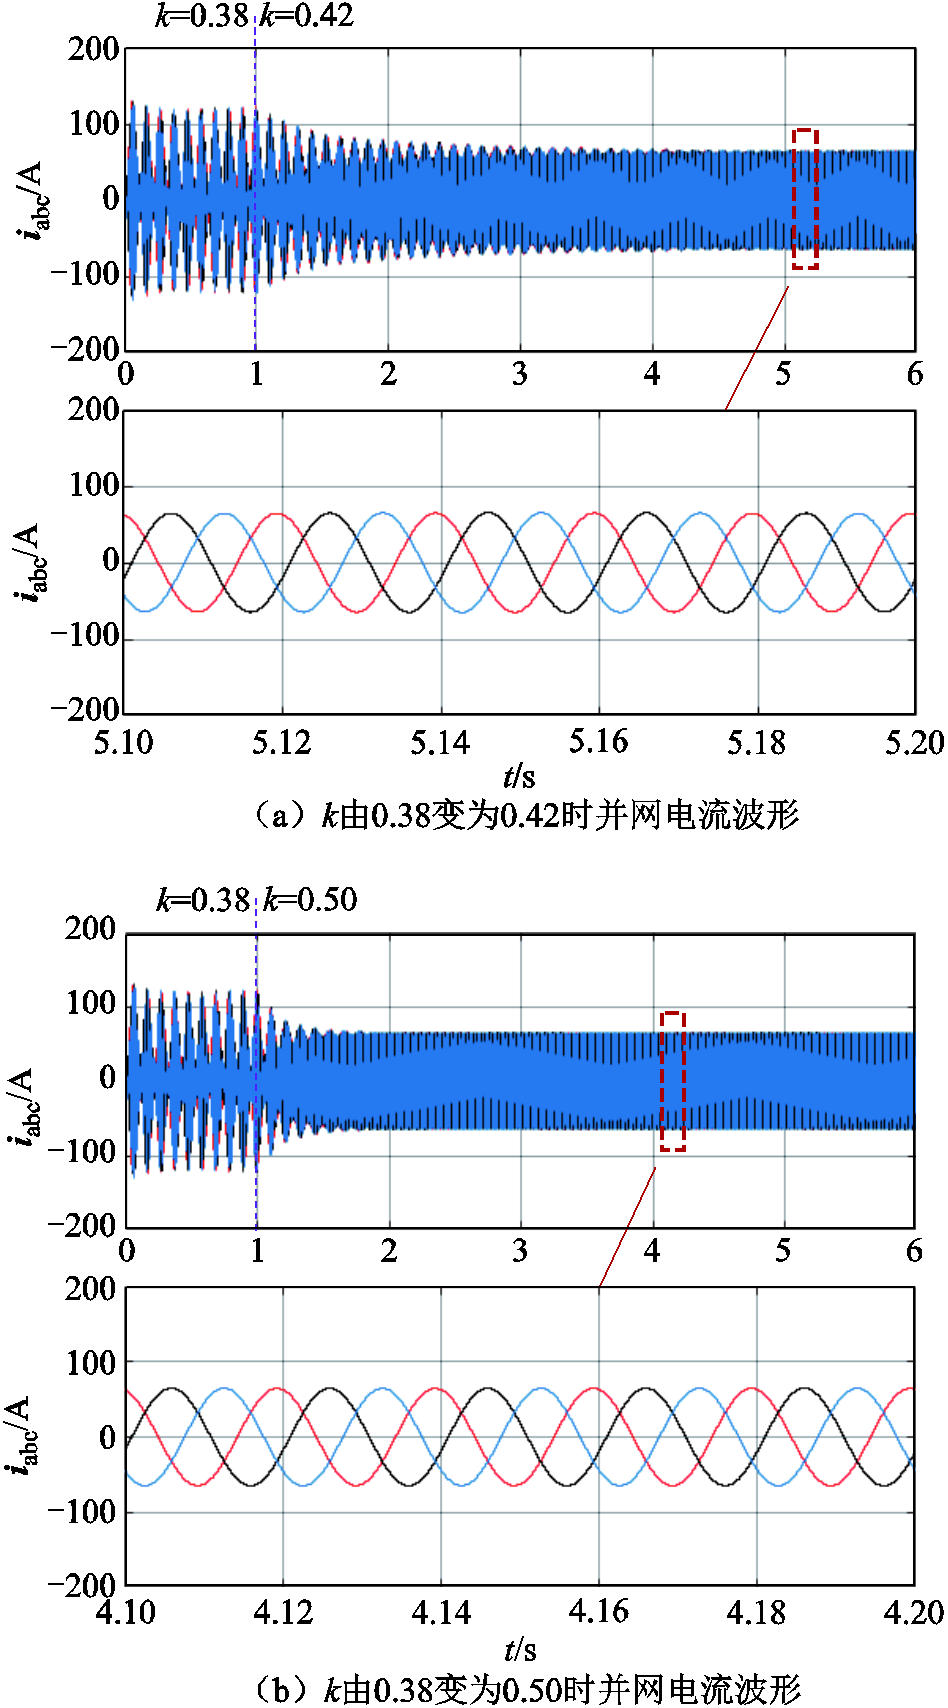
图13 k=0.42及k=0.50时并网电流波形
Fig.13 Grid-connected current waveforms when k=0.41 and k=0.50
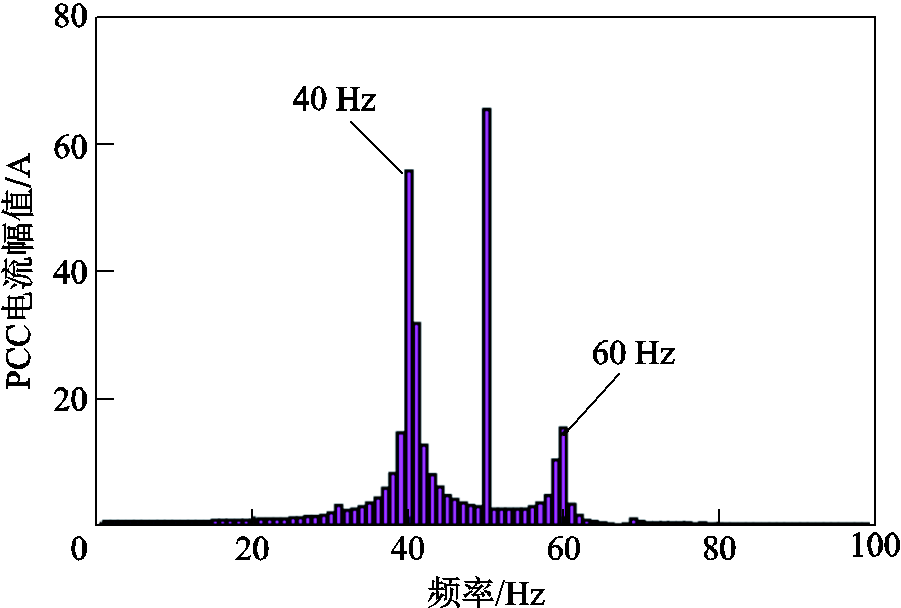
图14 k=0.38时并网电流FFT分析
Fig.14 FFT analysis of grid-connected current when k=0.38
由3.2节分析可知,当反馈系数k取值分别为0.46、0.53、0.56时,系统的稳定裕度分别为10°、20°、30°。图15给出了k由0.38变为0.46、0.53以及0.56时系统并网电流波形。从图15中可以看出,k值越大,系统稳定裕度越大,系统由不稳定变为稳定所用的调节时间越短。
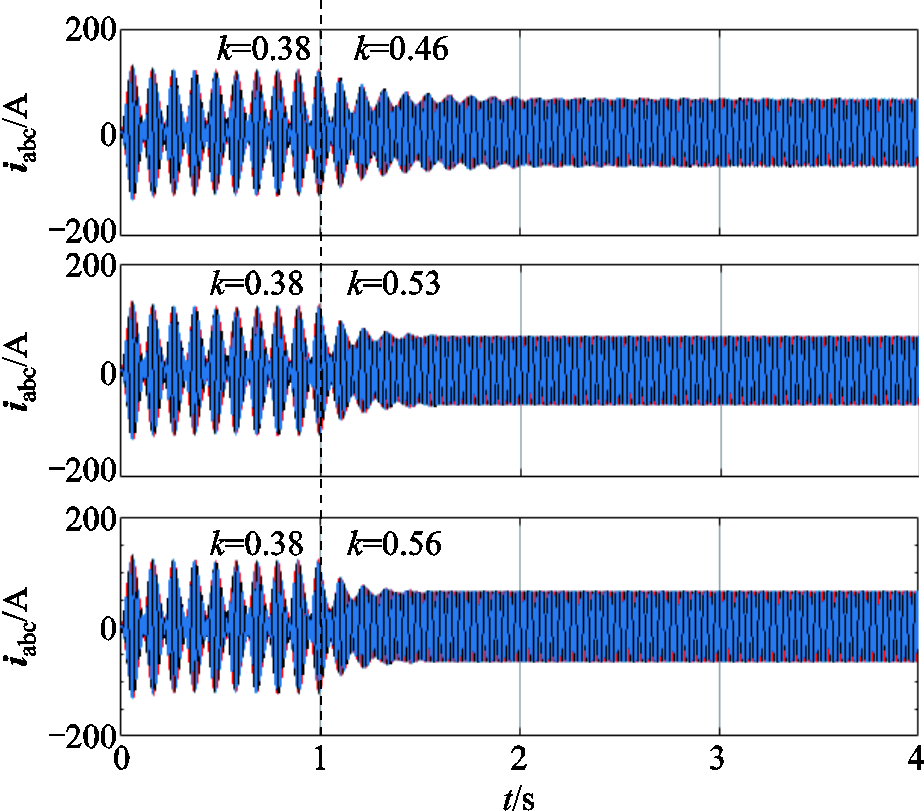
图15 k分别为0.46、0.53及0.56时系统并网电流波形
Fig.15 Grid-connected current waveforms when k is 0.46, 0.53, and 0.56, respectively
为进一步验证理论分析的正确性,搭建构网型变流器经串补线路并网的实验平台,如图16a所示。阻尼控制器通过光纤通信采集系统并网点电流信号,经过图9控制环节后将并网电流反馈信号给动矩实时仿真器以实现振荡抑制。
为验证次同步振荡抑制策略中反馈系数的有效性,设置系统串补度为84%。需要说明的是,实时仿真器的运行步长为5 ms, 阻尼控制器的运行步长为50 ms,考虑到带控制器回路与实时仿真回路离散化步长和算法的不一致,以及阻尼控制器回路相较于实时仿真回路叠加了纯延时环节,而纯延时环节是一个发散的环节,二者势必会带来一定的误差。因此设置反馈系数值为0.8,使系统有较高的稳定裕度以实现次同步振荡抑制,结果如图17所示。由图17可知,基于电流反馈的阻抗重塑策略可有效地抑制次同步振荡。图18给出了反馈系数取0.9时的实验电流波形,对比图17和图18可以看出,k值越大,系统由不稳定过渡到稳定所用的调节时间越短。

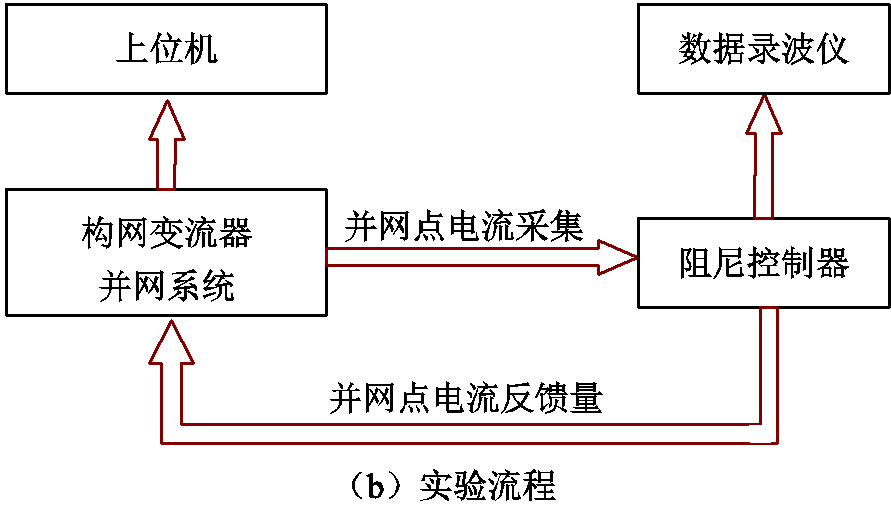
图16 实验平台及流程
Fig.16 Experimental platform and flow chart
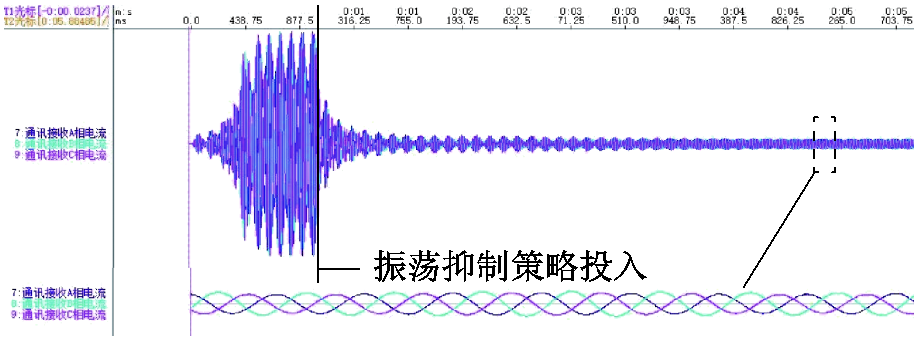
图17 反馈系数k为0.8时实验电流波形
Fig.17 Experimental current waveform with feedback coefficient k of 0.8
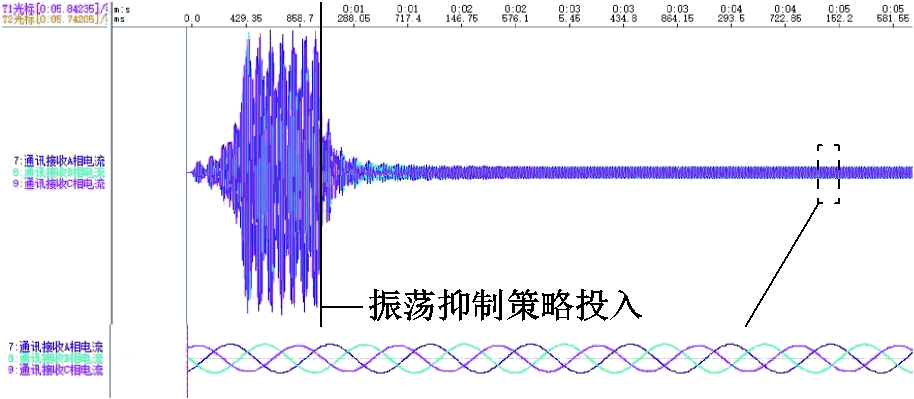
图18 反馈系数k为0.9时实验电流波形
Fig.18 Experimental current waveform with feedback coefficient k of 0.9
本文针对构网型变流器经串联电容补偿线路并入电网引发的次同步振荡问题,从系统阻抗建模、不同串补度和频率耦合效应对系统稳定性的影响以及次同步振荡抑制策略三方面进行了全面的研究。
1)构网型变流器与串补线路作用易引发次同步振荡现象,且串补度越大,振荡风险越高。此外,在某些工况下,计及频率耦合效应的阻抗分析结果更加准确,不可忽略其影响。
2)在基于并网电流反馈的阻抗重塑策略中,采用幅相等值线图可直观判断出反馈系数k对系统运行特性的影响,并得出系统处于稳态或失稳状态下反馈系数k的取值范围。此外,可根据基于幅相等值线图稳定性判据对系统在不同稳定裕度下k的取值进行设计。最后,通过仿真和实验验证了该策略的有效性。
参考文献
[1] 余果, 吴军, 夏热, 等. 构网型变流器技术的发展现状与趋势研究[J]. 综合智慧能源, 2022, 44(9): 65-70.
Yu Guo, Wu Jun, Xia Re, et al. Study on the status quo and development trend of grid-forming converter technology[J]. Integrated Intelligent Energy, 2022, 44(9): 65-70.
[2] Huang Linbin, Xin Huanhai, Li Zhiyi, et al. Grid-synchronization stability analysis and loop shaping for PLL-based power converters with different reactive power control[J]. IEEE Transactions on Smart Grid, 2020, 11(1): 501-516.
[3] 陈露洁, 徐式蕴, 孙华东, 等. 高比例电力电子电力系统宽频带振荡研究综述[J]. 中国电机工程学报, 2021, 41(7): 2297-2310.
Chen Lujie, Xu Shiyun, Sun Huadong, et al. A survey on wide-frequency oscillation for power systems with high penetration of power electronics[J]. Proceedings of the CSEE, 2021, 41(7): 2297-2310.
[4] Liu Qing, Caldognetto T, Buso S. Review and comparison of grid-tied inverter controllers in microgrids [J]. IEEE Transactions on Power Electronics, 2020, 35(7): 7624-7639.
[5] 许诘翊, 刘威, 刘树, 等. 电力系统变流器构网控制技术的现状与发展趋势[J]. 电网技术, 2022, 46(9): 3586-3595.
Xu Jieyi, Liu Wei, Liu Shu, et al. Current state and development trends of power system converter grid-forming control technology[J]. Power System Techno-logy, 2022, 46(9): 3586-3595.
[6] 曹炜, 钦焕乘, 陆建忠, 等. 新型电力系统下虚拟同步机的定位和应用前景展望[J]. 电力系统自动化, 2023, 47(4): 190-207.
Cao Wei, Qin Huancheng, Lu Jianzhong, et al. Orientation and application prospect of virtual synchronous generator in new power system[J]. Automation of Electric Power Systems, 2023, 47(4): 190-207.
[7] Mohandes B, El Moursi M S, Hatziargyriou N, et al. A review of power system flexibility with high penetration of renewables[J]. IEEE Transactions on Power Systems, 2019, 34(4): 3140-3155.
[8] Peng Qiao, Jiang Qin, Yang Yongheng, et al. On the stability of power electronics-dominated systems: challenges and potential solutions[J]. IEEE Transactions on Industry Applications, 2019, 55(6): 7657-7670.
[9] 詹长江, 吴恒, 王雄飞, 等. 构网型变流器稳定性研究综述[J]. 中国电机工程学报, 2023, 43(6): 2339-2359.
Zhan Changjiang, Wu Heng, Wang Xiongfei, et al. An overview of stability studies of grid-forming voltage source converters[J]. Proceedings of the CSEE, 2023, 43(6): 2339-2359.
[10] Zhao Fangzhou, Wang Xiongfei, Zhu Tianhua. Low-frequency passivity-based analysis and damping of power-synchronization controlled grid-forming inverter [J]. IEEE Journal of Emerging and Selected Topics in Power Electronics, 2023, 11(2): 1542-1554.
[11] 熊小玲, 李昕悦, 周琰, 等. 基于陷波器的构网型换流器同步频率谐振抑制策略[J]. 电工技术学报, 2024, 39(12): 3827-3839.
Xiong Xiaoling, Li Xinyue, Zhou Yan, et al. Synchronous frequency resonance suppression of grid-forming converter based on notch filter[J]. Transactions of China Electrotechnical Society, 2024, 39(12): 3827-3839.
[12] 秦世耀, 齐琛, 李少林, 等. 电压源型构网风电机组研究现状及展望[J]. 中国电机工程学报, 2023, 43(4): 1314-1334.
Qin Shiyao, Qi Chen, Li Shaolin, et al. Review of the voltage-source grid forming wind turbine[J]. Proceedings of the CSEE, 2023, 43(4): 1314-1334.
[13] 潘子迅, 杨晓峰, 赵锐, 等. 不平衡电网下虚拟同步机的多模式协调策略[J]. 电工技术学报, 2023, 38(16): 4274-4285.
Pan Zixun, Yang Xiaofeng, Zhao Rui, et al. Multi-mode coordination control of virtual synchronous generator under unbalanced power grid[J]. Transactions of China Electrotechnical Society, 2023, 38(16): 4274-4285.
[14] 王祺, 张泽轲, 郭杰帅, 等. 新型电力系统主动构网机理与技术路径[J]. 中国电机工程学报, 2024, 44(2): 504-517.
Wang Qi, Zhang Zeke, Guo Jieshuai, et al. Mechanism and technical path of active grid-forming of new type power system[J]. Proceedings of the CSEE, 2024, 44(2): 504-517.
[15] Xu Haizhen, Yu Changzhou, Liu Chun, et al. An improved virtual inertia algorithm of virtual synchronous generator[J]. Journal of Modern Power Systems and Clean Energy, 2020, 8(2): 377-386.
[16] 杨伊茜, 陈杰, 万雨朦, 等. 电网电压前馈控制VSG的阻抗建模与并网稳定性分析[J]. 电力工程技术, 2021, 40(6): 52-61.
Yang Yiqian, Chen Jie, Wan Yumeng, et al. The impedance modelling and stability analysis of VSG with grid voltage feedforward control[J]. Electric Power Engineering Technology, 2021, 40(6): 52-61.
[17] Leon A E, Mauricio J M. Virtual synchronous generator for VSC-HVDC stations with DC voltage control[J]. IEEE Transactions on Power Systems, 2023, 38(1): 728-738.
[18] 高本锋, 邓鹏程, 孙大卫, 等. 基于匹配控制的构网型直驱风电场次同步振荡机理与特性研究[J]. 电工技术学报, 2024, 39(9): 2755-2770.
Gao Benfeng, Deng Pengcheng, Sun Dawei, et al. Mechanism and characteristics of subsynchronous oscillation of grid-forming direct-drive wind farm based on matching control[J]. Transactions of China Electrotechnical Society, 2024, 39(9): 2755-2770.
[19] 谢震, 杨曙昕, 代鹏程, 等. 构网型全功率风电机组网侧变流器耦合分析及抑制策略[J]. 电工技术学报, 2023, 38(14): 3745-3758, 3768.
Xie Zhen, Yang Shuxin, Dai Pengcheng, et al. Grid-side coupling analysis and suppression strategy of grid-forming full-power wind turbines[J]. Transactions of China Electrotechnical Society, 2023, 38(14): 3745-3758, 3768.
[20] Xu Yunyang, Nian Heng, Hu Bin, et al. Impedance modeling and stability analysis of VSG controlled type-IV wind turbine system[J]. IEEE Transactions on Energy Conversion, 2021, 36(4): 3438-3448.
[21] 殷桂梁, 董浩, 代亚超, 等. 光伏微网中虚拟同步发电机参数自适应控制策略[J]. 电网技术, 2020, 44(1): 192-199.
Yin Guiliang, Dong Hao, Dai Yachao, et al. Adaptive control strategy of VSG parameters in photovoltaic microgrid[J]. Power System Technology, 2020, 44(1): 192-199.
[22] Zhou Xinyi, Cheng Shu, Wu Xun, et al. Influence of photovoltaic power plants based on VSG technology on low frequency oscillation of multi-machine power systems[J]. IEEE Transactions on Power Delivery, 2022, 37(6): 5376-5384.
[23] 伍文华, 周乐明, 陈燕东, 等. 序阻抗视角下虚拟同步发电机与传统并网逆变器的稳定性对比分析[J]. 中国电机工程学报, 2019, 39(5): 1411-1421.
Wu Wenhua, Zhou Leming, Chen Yandong, et al. Stability comparison and analysis between the virtual synchronous generator and the traditional grid-connected inverter in the view of sequence impedance [J]. Proceedings of the CSEE, 2019, 39(5): 1411-1421.
[24] 杜燕, 赵韩广, 杨向真, 等. 考虑频率耦合效应的虚拟同步发电机序阻抗建模[J]. 电源学报, 2020, 18(6): 42-49.
Du Yan, Zhao Hanguang, Yang Xiangzhen, et al. Sequence impedance modeling of virtual synchronous generator considering frequency coupling effect[J]. Journal of Power Supply, 2020, 18(6): 42-49.
[25] Shi Kai, Wang Yu, Sun Yuxin, et al. Frequency-coupled impedance modeling of virtual synchronous generators[J]. IEEE Transactions on Power Systems, 2021, 36(4): 3692-3700.
[26] Sun Jian, Li Mingjie, Zhang Zhigang, et al. Renewable energy transmission by HVDC across the continent: system challenges and opportunities[J]. CSEE Journal of Power and Energy Systems, 2017, 3(4): 353-364.
[27] 杜程茂, 杜雄, 苏婧媛, 等. 定子电流控制的双馈风机导纳建模与次同步振荡风险分析[J]. 电力系统自动化, 2023, 47(13): 159-167.
Du Chengmao, Du Xiong, Su Jingyuan, et al. Admittance modeling and subsynchronous oscillation risk analysis of DFIG-based wind turbine with stator current control[J]. Automation of Electric Power Systems, 2023, 47(13): 159-167.
[28] Wu Wenhua, Zhou Leming, Chen Yandong, et al. Sequence-impedance-based stability comparison between VSGs and traditional grid-connected inverters [J]. IEEE Transactions on Power Electronics, 2019, 34(1): 46-52.
[29] Li Gaoxiang, Chen Yandong, Luo An, et al. Analysis and mitigation of subsynchronous resonance in series-compensated grid-connected system controlled by a virtual synchronous generator[J]. IEEE Transactions on Power Electronics, 2020, 35(10): 11096-11107.
[30] 刘欣, 郭志博, 贾焦心, 等. 基于序阻抗的虚拟同步发电机并网稳定性分析及虚拟阻抗设计[J]. 电工技术学报, 2023, 38(15): 4130-4146.
Liu Xin, Guo Zhibo, Jia Jiaoxin, et al. Stability analysis and virtual impedance design of virtual synchronous machine based on sequence impedance [J]. Transactions of China Electrotechnical Society, 2023, 38(15): 4130-4146.
[31] 王国宁, 杜雄, 邹小明, 等. 用于三相并网逆变器稳定性分析的自导纳和伴随导纳建模[J]. 中国电机工程学报, 2017, 37(14): 3973-3981, 4275.
Wang Guoning, Du Xiong, Zou Xiaoming, et al. Self and accompanying admittance model for three-phase grid-tied inverter stability analysis[J]. Proceedings of the CSEE, 2017, 37(14): 3973-3981, 4275.
[32] Zou Xiaoming, Du Xiong, Tai Hengming. Two-variable admittance model for D-PMSG-based wind turbine and stability criterion based on magnitude and phase contour plot[J]. IEEE Transactions on Power Electronics, 2020, 35(2): 1484-1498.
A Sub-Synchronous Oscillation Suppression Strategy for the Grid-Forming Converter Based on Grid-Connected Current Feedback
Abstract Similar to synchronous generators, the grid-forming converter mostly uses power synchronization or inertial synchronization control strategies, which can provide inertia and damping support to the grid. However, the similar external characteristics of the grid-forming converter and synchronous generator result in its susceptibility to sub-synchronous oscillations when connected to the grid through aseries capacitor compensation line. In view of this, this paper carries out a comprehensive research work on the stability analysis and sub-synchronous oscillation suppression strategy for the grid-forming converter connected to the grid via a series capacitor compensation line.
Firstly, the self-impedance and the accompanying impedance models of the grid-forming converter are established by using the complex variable representation method. The self-impedance and the accompanying impedance are verified using the frequency scanning method, and the scanning results were consistent with the analytical model, verifying the correctness of both. The established the self-impedance and the accompanying impedance models can accurately explain and characterize the single-frequency input and dual-frequency output of the grid-forming converter. Afterwards, the equivalent impedance model of the system with single input and single output of the grid-forming converter is derived, taking into account the frequency coupling effect and the influence of the series complementary lines.
Secondly, the stability of the grid-connected system at different series compensation degrees is analysed by using the Nyquist stability criterion based on an equivalent impedance model that accounts for thefrequency coupling effect. It is found that the larger series compensation degree is, the worse the system stability is. In addition, the impedance stability analysis taking into account the frequency coupling effect is more accurate under certain operating conditions.
Then, a current feedback-based impedance reshaping strategy is proposed for the phenomenon of sub-synchronous oscillations generated by the interaction between the grid-forming converter and the series-complementary line. The strategy is that the grid-connected current passes through the notch filter and the feedback coefficient as part of the modulation wave output to achieve system impedance reshaping. The function of the trap filter is to maintain the fundamental frequency output impedance and avoid the working point offset of the converter. And the current feedback coefficient was introduced into the equivalent impedance model, the feedback coefficient-frequency binary equivalent impedance model was established, and the amplitude-phase contour stability criterion was used to parameterize the current feedback coefficients. It is found that the larger the feedback coefficient k is, the larger the phase margin of the system is, and the more stable the system is. In addition, after the system is shaped by impedance, the phase-frequency curve moves down as a whole, especially in the frequency band below 50 Hz, the phase-frequency curve moves down greatly, resulting in the phase difference at the resonance point less than 180°, and the oscillation is suppressed.
Finally, the grid-connected system model of the grid-forming converter via series-complementary line is built through simulation and experiment, and the impedance remodeling control strategy is implemented on the damping controller to verify the correctness of the theoretical analysis as well as the parameter design. This study draws the following conclusions. (1) The interaction between the grid-forming converter and the series compensation line is easy to cause sub-synchronous oscillation, and the greater the series compensation degree, the higher the oscillation risk. In addition, under certain operating conditions, impedance analyses that take into account frequency coupling effect are more accurate and their influence cannot be ignored. (2) The amplitude-phase contour plot can be used to determine intuitively the influence of the feedback coefficient k on the operating characteristics of the system and to derive the range of values of the feedback coefficient k parameter when the system is in a stable or unstable state.
Keywords:Grid-forming converter, complex variable, equivalent impedance, stability analysis, oscillation suppression
中图分类号:TM46
DOI: 10.19595/j.cnki.1000-6753.tces.241391
国家自然科学基金资助项目(52377169, 51937001)。
收稿日期2024-08-03
改稿日期2024-08-21
张 琦 男,1995年生,博士研究生,研究方向为新能源并网系统稳定性分析。
E-mail:zhangqi@stu.cqu.edu.cn
陈 兵 男,1977年生,教授级高级工程师,研究方向为新能源并网系统稳定性和直流输电系统稳定性。
E-mail:cbsure@163.com(通信作者)
(编辑 郭丽军)