 (1)
(1)
摘要 高比例新能源并网与管道掺氢为配电网灵活运行带来了巨大挑战。为定量评估配电网运行的灵活性,该文以电-气-氢耦合为载体,提出了一种电-气-氢混联综合能源配电网灵活运行域模型。首先,考虑配电网管道掺氢的准动态运行过程,建立了电-气-氢混联综合能源配网运行模型;其次,考虑光伏预测误差和系统多断面时域耦合特性,提出了考虑管道掺氢的配电网机会约束灵活运行域模型;然后,提出了一种径向自适应重构算法获取灵活运行域边界运行点,并基于运行点构建灵活运行域空间;最后,在由33节点配电网和20节点配气网构成的电-气混联系统中开展测试,基于可视化灵活运行域空间准确、直观地刻画了光伏不确定性和灵活资源调控特性对于配电网灵活调控能力的影响,验证了所提模型的有效性。
关键词:配电网 掺氢配气网 灵活运行域 机会约束优化
在“双碳”战略目标与新型电力系统建设协同推进的背景下,风电、光伏等新能源高比例并网显著提升了电力系统灵活性需求[1]。氢能凭借零碳排放特性、高能量密度优势及快速响应能力,已成为支撑能源转型的关键技术,驱动产业进入战略发展期[2-4]。据预测,到2030年我国氢能需求将达到3 810万t,到2060年达到8 600万t[5]。一方面,鉴于氢能产业的规模化发展需求,管道掺氢输运技术成为当前氢能运输的关键载体[6];另一方面,电制氢机组具备ms级功率响应能力,可有效平抑电网侧的功率波动[7]。二者的系统级耦合实现了电-氢能流的协同转换[8-9],能够有效地支撑高比例新能源配电网的灵活性需求[10]。因此,深入挖掘氢能参与的灵活性价值,精准评估考虑新能源不确定性和掺氢配气网耦合下配电网运行灵活性具有重要意义。
当前文献针对计及电制氢与管道掺氢的电力系统灵活运行开展了研究。文献[11]通过精细化建模氢能制取与用能设备,有效提升了电氢耦合系统的运行灵活性。文献[12]提出了考虑绿氢参与的电力系统安全约束调度模型,表明了制氢-储氢的灵活运行可有效促进新能源消纳。文献[13]建立了天然气掺氢系统的准动态运行模型,评估了电制氢参与调峰和备用服务的灵活性价值。文献[14]考虑了电制氢机组的产热过程,将掺氢气网与电网、热网深度耦合,研究了氢气注入下多能耦合系统的经济效益。文献[15]计及了掺氢比的动态调整,综合考虑了管道长度和电负荷系数等因素,实现了管道掺氢的收益最大化。值得研究的是,以上研究侧重于考虑电制氢或管道掺氢的电力系统优化运行方面,缺乏对系统灵活性的直观量化。
当前电力系统灵活调节能力量化主要采用基于灵活运行域的方法,如文献[16]从工程实用角度出发,提出了一种面向全维观测的数值解析域模型。文献[17]推导了灵活运行域的解析表达式,精确量化了配电网时空耦合下的灵活运行空间。文献[18]将配电网高维运行域向根节点有功-无功二维空间进行映射,并采用椭圆近似高效求解。文献[19]提出一种降维观测和凸包收缩的拟合方法,较好地实现了运行域的精准拟合。上述文献从电力系统角度进行灵活运行域的刻画,随着其他形式能源的耦合,配电网的灵活性需进一步考虑耦合系统网络约束的影响。如文献[20]考虑了供热网对配电网灵活性的支撑作用,并基于模型的线性化处理采用模拟法进行域边界点搜索。文献[21]进一步考虑了掺氢配气网的耦合,但各能源子系统的运行域采用了简化的内盒模型,无法准确描述其灵活性。文献[22]考虑了碳流和氢流耦合,研究了电-气-氢综合能源系统碳排放运行域。多能流方程呈现高维非线性,在传统配电网可行域求解方法中,基于投影近似的解析法[16-18]难以直接适用,而模拟法[19-22]搜索边界点也存在求解效率偏低的问题。
基于此,本文提出了电-气-氢混联综合能源配网灵活运行域模型,刻画了多能耦合和多时间断面下的配电网灵活运行空间。本文开展了两方面创新工作:①相比于当前的运行域模型,所提运行域模型深入考虑了制氢机组的动态制氢特性和管道掺氢下的配气网准动态运行;②提出了径向自适应重构算法搜索运行域边界点,实现了多能耦合下多断面运行域的高效、精准求解。
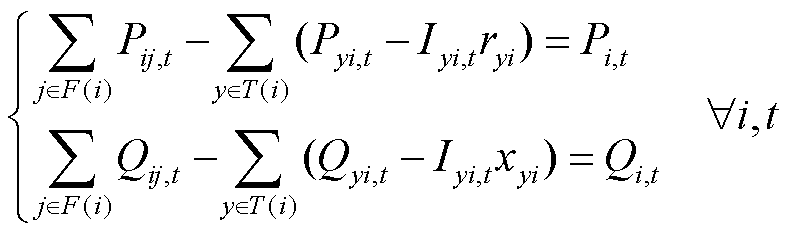
1)交流配电网支路潮流模型[23]
(1)
 (2)
(2)
 (3)
(3)
 (5)
(5)
 (6)
(6)
式中,下标 为调度时刻;下标i、j、y均为配电网节点;下标
 、
、 、
、 和
和 分别为燃气机组、光伏机组、电制氢机组和储能;
 、
、 、
、 、
、 、
、 和
和 分别为与节点
 相连的首端线路集合、末端线路集合、燃气机组集合、光伏机组集合、电制氢机组集合和储能集合;
 和
和 分别为线路ij的电阻和电抗;
 和
和 分别为线路
分别为线路 在时刻传输的有功和无功功率;
 和
和 分别为节点在时刻注入的有功和无功功率;
 和
和 分别为节点和线路在时刻的电压和电流;
 和
和 分别为根节点在时刻的有功和无功出力;
 、
、 和
和 分别为燃气机组、光伏机组和电制氢机组在时刻的有功出力;
 和
和 分别为储能在时刻的充电和放电功率;
 和
和 分别为节点在时刻的负荷有功和无功需求功率;
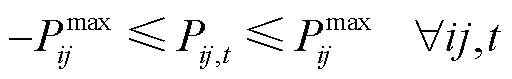
 为线路有功传输容量。
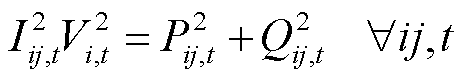
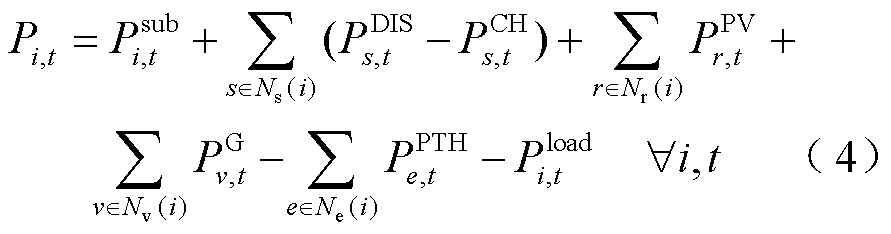
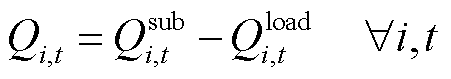
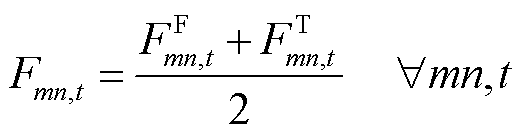
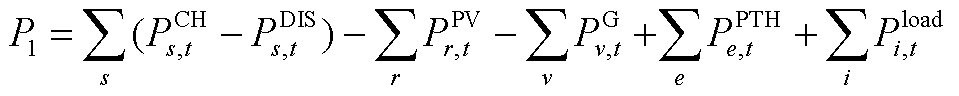
式(1)为节点功率平衡方程;式(2)为支路电压降落方程;式(3)为支路容量方程;式(4)和式(5)为节点注入功率方程;式(6)为有功传输容量约束。
2)储能运行约束
 (7)
(7)
 (8)
(8)
 (9)
(9)
 (10)
(10)
式中, 为调度间隔;
 和
和 分别为储能在时刻的充电和放电状态;
 和
和 分别为充电和放电效率;
 为储能在时刻的储能容量;
 和
和 分别为储能的充电和放电功率上限;
 和
和 分别为储能容量的下限和上限。
式(7)为储能功率平衡约束;式(8)为储能充放状态约束,限制了不能同时进行充电和放电;式(9)为储能充电/放电功率约束;式(10)为储能容量约束。
3)电制氢机组运行约束
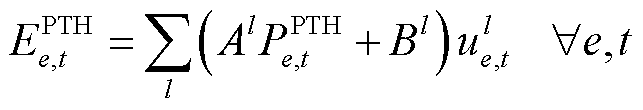
考虑到电解水制氢过程中效率并非恒定,而计及详细电解过程的制氢模型过于复杂,本文采用文献[24]中的分段线性制氢曲线,其分段线性拟合结果如附图1所示。此时电制氢机组相关运行约束为
 (11)
(11)
 (12)
(12)
 (13)
(13)
 (14)
(14)
式中,上标 为分段数;
为分段数; 和
和 为阶段下的制氢曲线参数;
 用于确定机组在时刻的制氢曲线阶段,=1表示当前所处制氢曲线的阶段,
 表示当前不处于制氢曲线的阶段l;
 为电制氢机组在时刻的氢气能量;
 和
和 分别为机组出力的下限和上限;
 为机组爬坡功率上限。
式(11)和式(12)描述了电制氢机组的分段制氢曲线;式(13)和式(14)分别为电制氢机组出力上下限约束和爬坡约束。
4)燃气机组运行约束
 (15)
(15)
 (16)
(16)
 (17)
(17)
式中, 为燃气机组在时刻消耗的气体能量;
 为电-气转换效率;
 和
和 分别为机组出力下限和上限;
 为机组爬坡功率上限。
式(15)为燃气机组能量转换方程;式(16)和式(17)分别为燃气机组出力约束和爬坡约束。
基于天然气稳态运行模型,考虑氢气注入后的气体热值变化,掺氢配气网运行模型[13]如下。
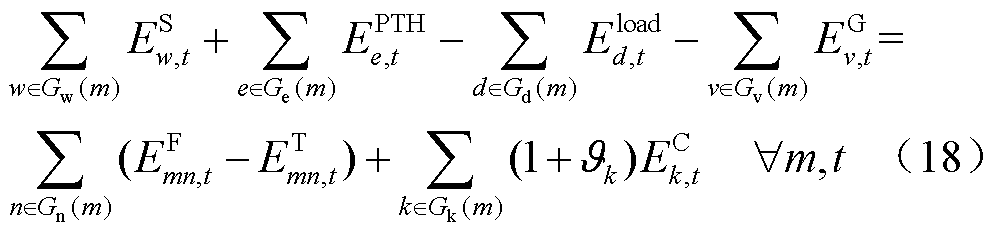
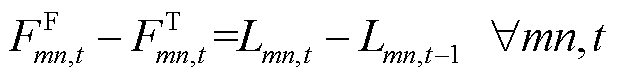
1)气体能量平衡约束
式中,下标 和
和 均为天然气系统节点;下标
 、
、 和
和 分别为气源、加压站和天然气负荷;
 、
、 、
、 、
、 、
、 和
和 分别为与节点相连的气源集合、燃气机组集合、电制氢机组集合、管道集合、加压站集合和气负荷集合;
 为气源在时刻的供应能量;
 为管道
为管道 首端在时刻的传输能量;
 为管道末端在时刻的传输能量;
 为加压站在时刻的传输能量;
 为加压站的损耗能量百分比;
 为负荷在时刻的需求能量。
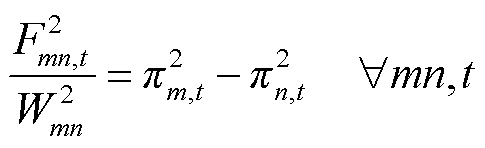
2)管道流量与管道两端压力降的非线性关系
 (19)
(19)
 (20)
(20)
式中, 为管道首端在时刻的传输流量;
 为管道末端在时刻的传输流量;
 为管道在时刻的平均流量;
 为节点在时刻的压力;
 为Weymouth常数。
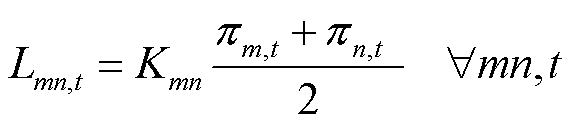
3)管道流量与管存量关系
 (21)
(21)
式中, 为管道在时刻的管存流量。
4)管道首末端压力与管存量关系
 (22)
(22)
式中, 为管道的管存常数。
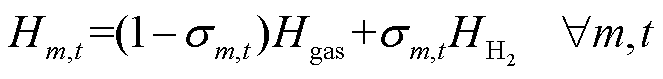
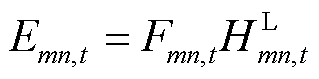
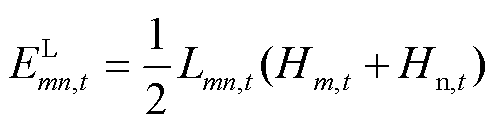
5)混合气体热值约束
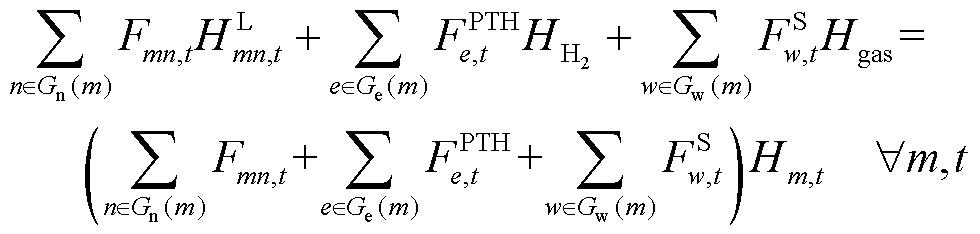 (23)
(23)
式中, 和
和 分别为管道和节点在时刻的气体热值;
 和
和 分别为氢气和天然气的气体热值;
 为电制氢机组在时刻产出的氢气流量;
 为气源在时刻产出的气体流量。
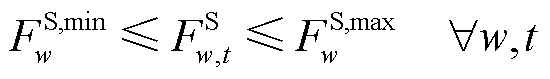
6)系统安全约束
 (24)
(24)
 (25)
(25)
 (26)
(26)
 (27)
(27)
 (28)
(28)
 (29)
(29)
 (30)
(30)
式中, 和
和 分别为管道传输流量的下限和上限;
 为加压站的传输流量上限;
 和
和 分别为节点气体压力的最小值和最大值;
 和
和 分别为加压站的最小和最大加压比;
 和
和 分别为时刻流入和流出加压站的气体的压力;
 和
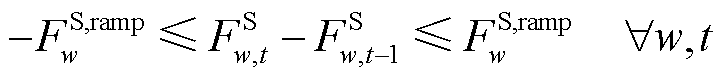
和 分别为气源的出力下限和上限;
 为气源爬坡能力上限。
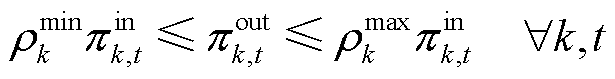
7)注氢比与气体热值关系
 (31)
(31)
 (32)
(32)
式中, 为节点在时刻的注氢比;
 为注氢比上限。
8)气体热值、流量和能量转换关系
 (33)
(33)
 (34)
(34)
 (35)
(35)
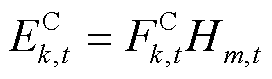 (36)
(36)
 (37)
(37)
式(33)~式(37)分别为气源、电制氢机组、管道、加压站、管存的气体体积流量和能量之间的转换关系。
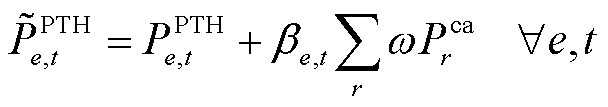
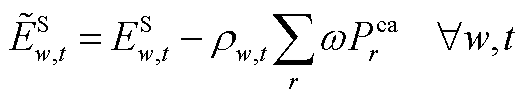
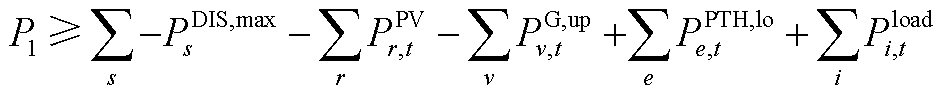
光伏出力具有随机性和波动性特征,预测出力通常与实际出力存在一定偏差[25]。本文计及光伏预测偏差,采用机会约束刻画光伏实际出力的不确定性。考虑时域耦合和光伏出力波动,基于机会约束的配电网灵活运行域可表述为:在给定置信水平下,满足综合能源配网所有运行约束的根节点连续多断面下的有功功率运行点集合。具体定义为
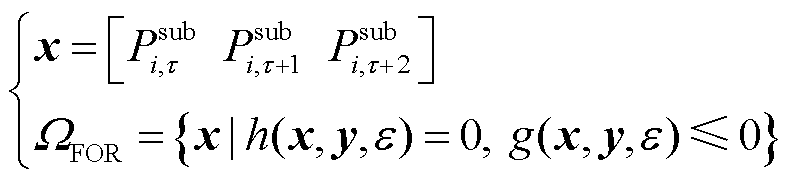 (38)
(38)
式中, 为描述运行域状态空间的向量,由根节点连续多断面有功功率组成;
 为系统其余状态变量;
 为指定的置信度;
 为灵活运行域;
 和
和 分别为配电网运行过程中的所有等式约束和不等式约束。
需要说明的是,本文所提灵活运行域刻画了配电网与上级电网交互功率的可行空间,基于此实际运行(包括考虑不确定性的决策、与输电网的交互协同)只需校核运行点是否位于域内,从而避免了传统配电网优化运行模型需重复校核运行点可行性的不足,也可为输-配高效协同决策提供灵活性量化结果支撑。
鉴于当前配电网规模下的负荷预测技术已经较为成熟,本文仅考虑光伏侧的预测误差,并采用机会约束处理该误差引起的功率波动。基于光伏预测数据,计及预测误差的光伏真实出力 为
为
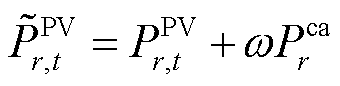 (39)
(39)
式中, 为光伏装机容量;光伏相对误差ω服从基于历史数据的概率分布。本文采用高斯混合模型构建其概率密度函数,模型参数通过最大似然估计法进行校准,具体分布特性详见附图2及附表1。
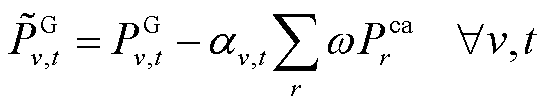
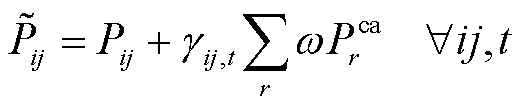
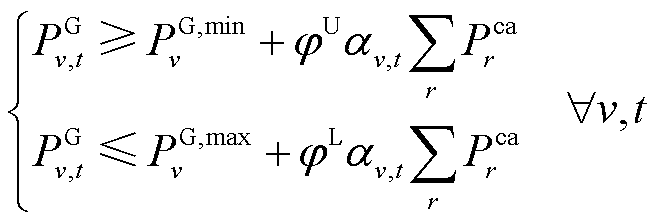
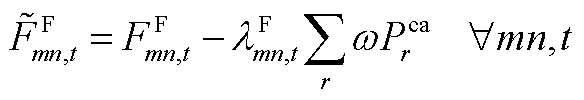
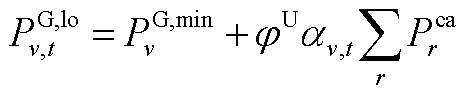
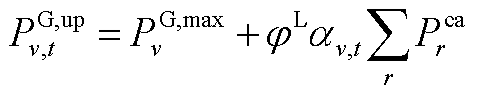
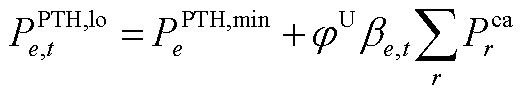
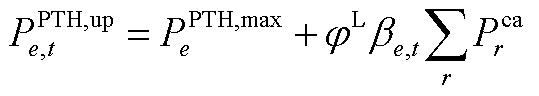
针对光伏预测误差引起的功率波动,提出功率平抑控制策略,其中燃气机组与电制氢机组构成主动调节单元,输电线路作为被动缓冲单元参与系统调节。此时机组和线路实时功率可表征[26]为
 (40)
(40)
 (41)
(41)
 (42)
(42)
式中, 、
、 和
和 分别为燃气机组、电制氢机组和线路在时刻的平抑系数。将上述功率代入电力系统运行约束,可获取平抑系数的相关约束。
 (43)
(43)
 (44)
(44)
 (45)
(45)
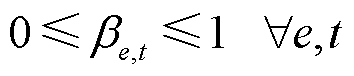
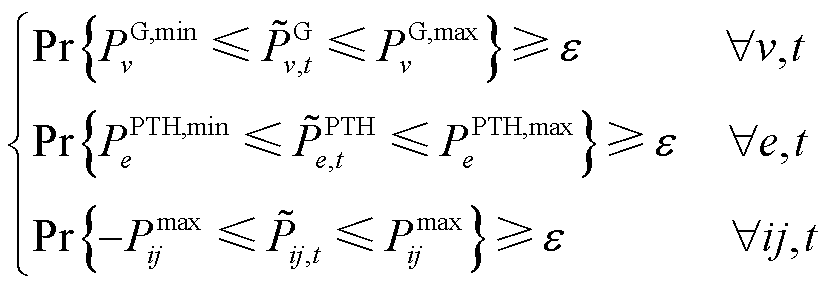
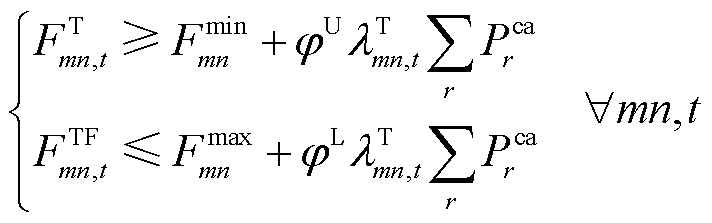
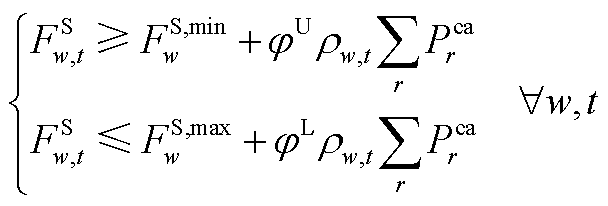
在计及光伏出力波动的机会约束框架下,燃气机组、电制氢机组及输电线路的运行边界约束可表述为以下机会约束形式。
 (47)
(47)
基于光伏出力预测误差的概率密度特性,将上述概率形式的约束进行确定性转换,得到
 (48)
(48)
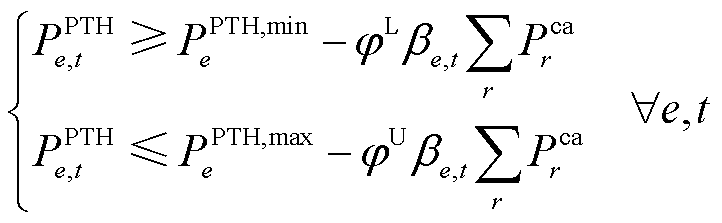 (49)
(49)
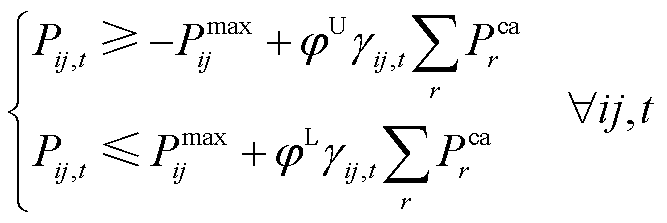 (50)
(50)
式中,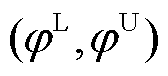 为置信度确定的置信区间。
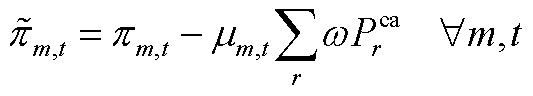
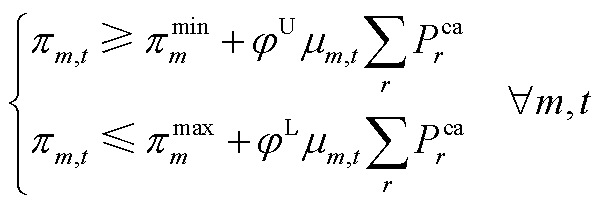
作为耦合系统的双向能量枢纽,燃气机组与电制氢机组在平抑光伏功率波动的过程中,将电网侧的不确定性向气网侧传导。为维持多能系统动态平衡,配气网需建立主动调节机制,通过气源出力( )、管道传输功率(
 、
、 )及节点压力(
 )三个维度的协同控制实现波动能量消纳。此时,式(24)、式(27)~式(29)基于概率转换的机会约束形式为
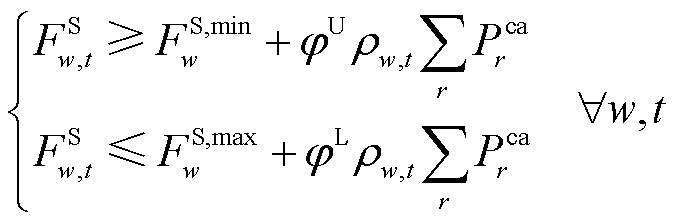 (51)
(51)
 (52)
(52)
 (53)
(53)
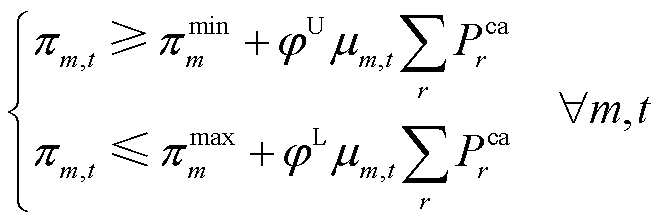 (54)
(54)
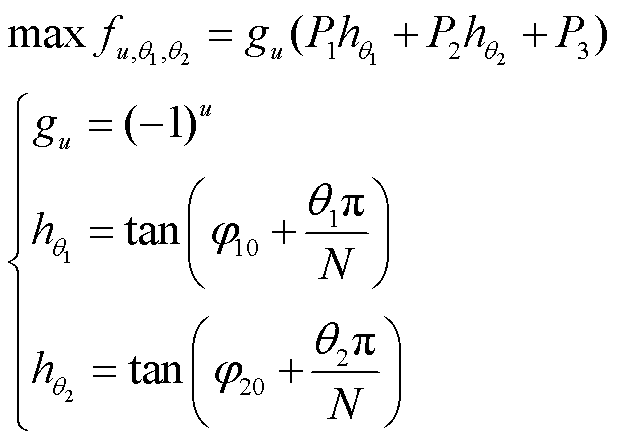
本文针对上述时域耦合灵活运行域的多面体特性,对文献[27]中所提迭代算法进行了改进,采用径向自适应重构算法求解灵活运行域边界运行点,生成可观测的综合能源配网灵活运行域。以二维运行域为例,径向自适应重构算法边界点搜索的目标函数为
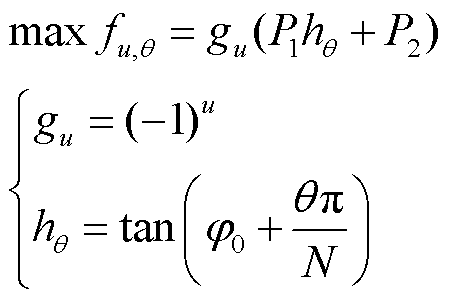 (55)
(55)
式中, 、
、 为连续时间断面下的根节点有功功率;
 为整数变量,通过改变取值以改变运行点的搜索方向;
 为指定步长,将区间
 进行N等分;
 ;
; 为初始角度,用于控制首次搜索的目标函数。通过u、v的不同组合取值,更新目标函数
 并求解,即可获取一系列边界点[28]。
图1给出了 、
、 下,上述方法对于椭圆运行域的求解过程。
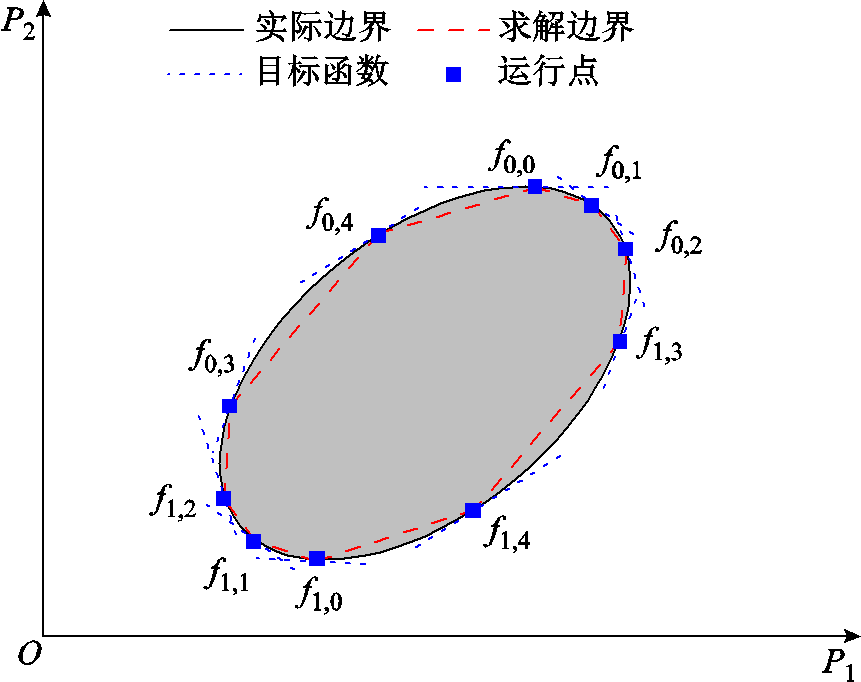
图1 径向自适应重构算法求解运行域示意图
Fig.1 Schematic diagram of solving the operating regions through radial adaptive reconstruction algorithm
由图1可知,当前步长下能够很好地拟合实际边界,并且拟合精度将随着步长N的增加而提升。实际上,对于本文选取的连续多段面有功运行域而言,其运行域呈现凸多面体特性(具体运行域边界见附录第3节),通过上述方法能够迅速找到凸多面体域的边界点,快速生成综合能源配网的灵活运行域。
为充分说明当前方法的优势,图2给出了两种方法对于二维多边形域的理论求解过程。由图2可知,对于八边形运行域,径向自适应重构算法仅需逐次求解8个目标函数(具体流程见附录第4节);相比之下,径向迭代搜索方法需经历两次迭代,且在迭代过程中不断生成新的目标函数,前后经历16次求解。
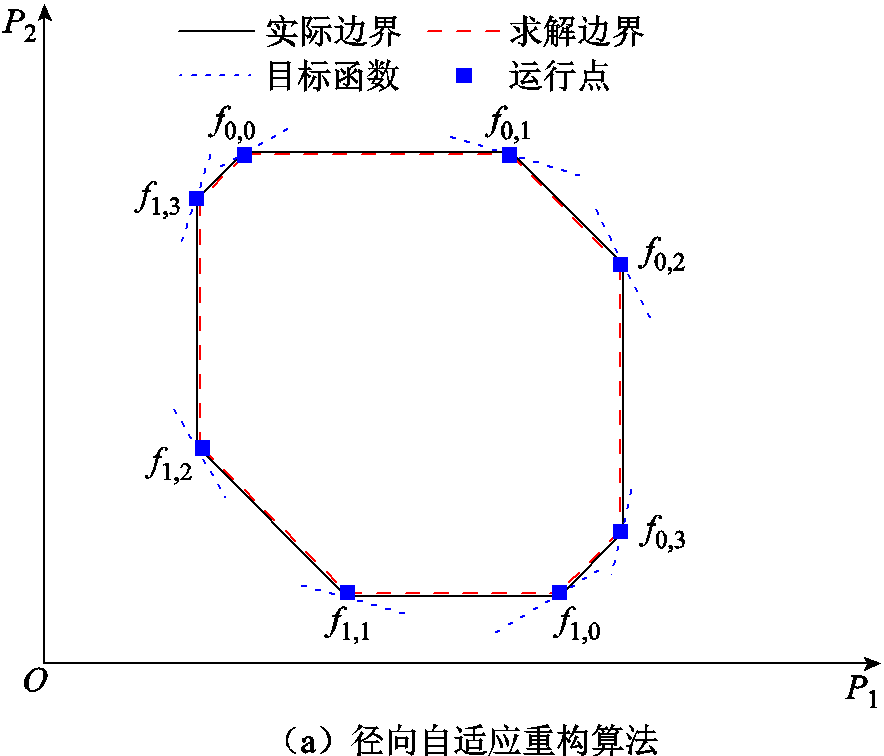
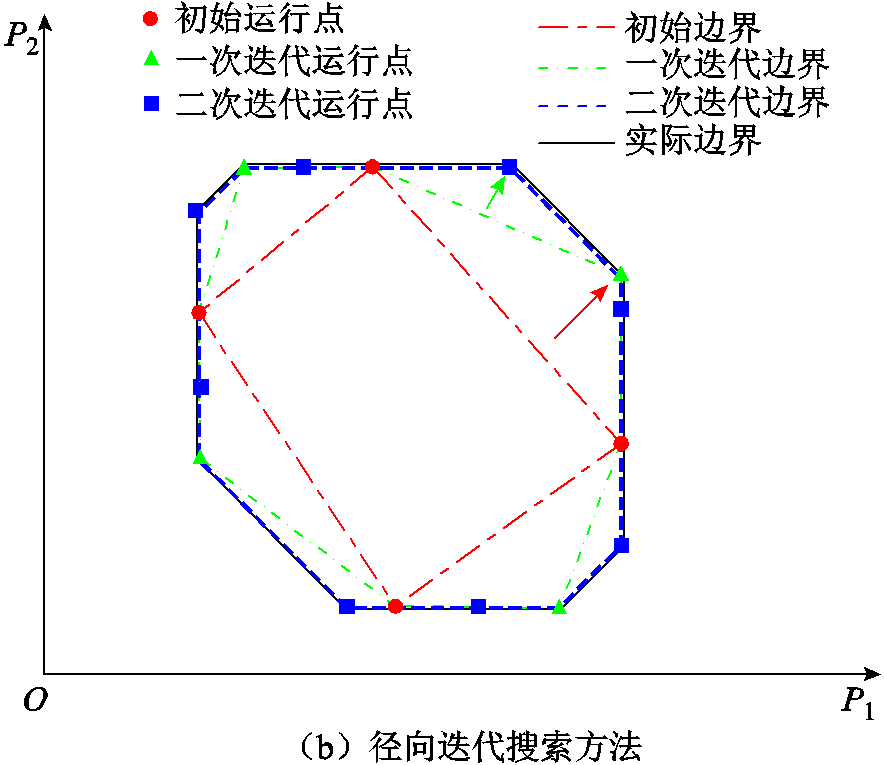
图2 多边形运行域求解示意图
Fig.2 Schematic diagram of polygon operation domain solution
对于三维运行域,只需增加搜索的维度,以二维平面形式寻找运行域的顶点,此时目标函数更新为
 (56)
(56)
式中, 、、
、、 为连续三个时间断面下的根节点有功功率;
 、
、 、
、 、
、 的定义与取值和二维域中的
 和类似,此处不再赘述。
需要说明的是,本文所提连续时间断面下的时域耦合运行域,考虑了日内短期运行(连续2 h/3 h运行断面)下的电网调控能力的量化,通过二维/三维运行域呈现;而对于3个运行断面以上的运行域刻画,可通过时序解耦为多个二维/三维运行域[29],因此本文重点关注二维/三维运行域。
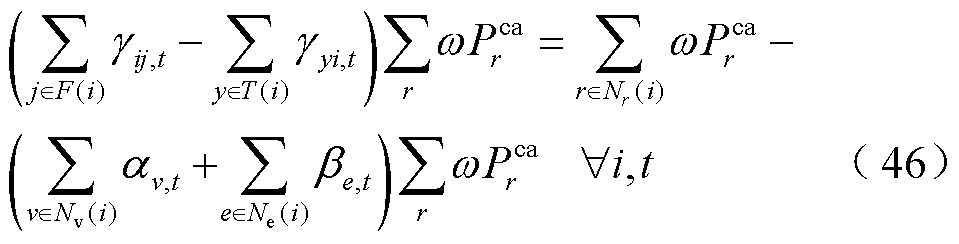
本文采用图3所示的由IEEE 33节点配电网和20节点配气网组成的电-气混联综合能源配网算例[13,18]进行测试。光伏装机容量为3 MW,分布式燃气机组装机容量为1.76 MW,在配电网节点2、5、7、8、9分别配备了电制氢机组,装机容量分别为0.25、0.25、0.25、0.25、0.20 MW。具体设备并网与耦合情况如图3所示,设备参数见附表1~附表4。本文在GAMS软件平台开展仿真测试,调用DICOPT求解器求解所提MINLP模型。
本文选取9:00—10:00(P1)、10:00—11:00(P2)及11:00—12:00(P3)的根节点有功功率交互量作为研究对象,构建配电网三维运行域模型。采用所提径向自适应重构算法求解,结果如图4所示。整体而言,三维运行域呈现非规则多面体结构,其二维投影特性表现为:P1-P2与P2-P3投影域为凸多边形,P1-P3投影域为矩形。其中P1-P2与P2-P3的不规则性源于分布式资源调控能力与动态耦合效应的交互作用,而P1-P3的规则形态则受静态功率平衡约束主导。此外,能够预见的是,忽略时间断面间的动态耦合效应,三维运行域将退化为各维度独立约束的立方体域,在配电网多断面协同调度场景中难以适用。
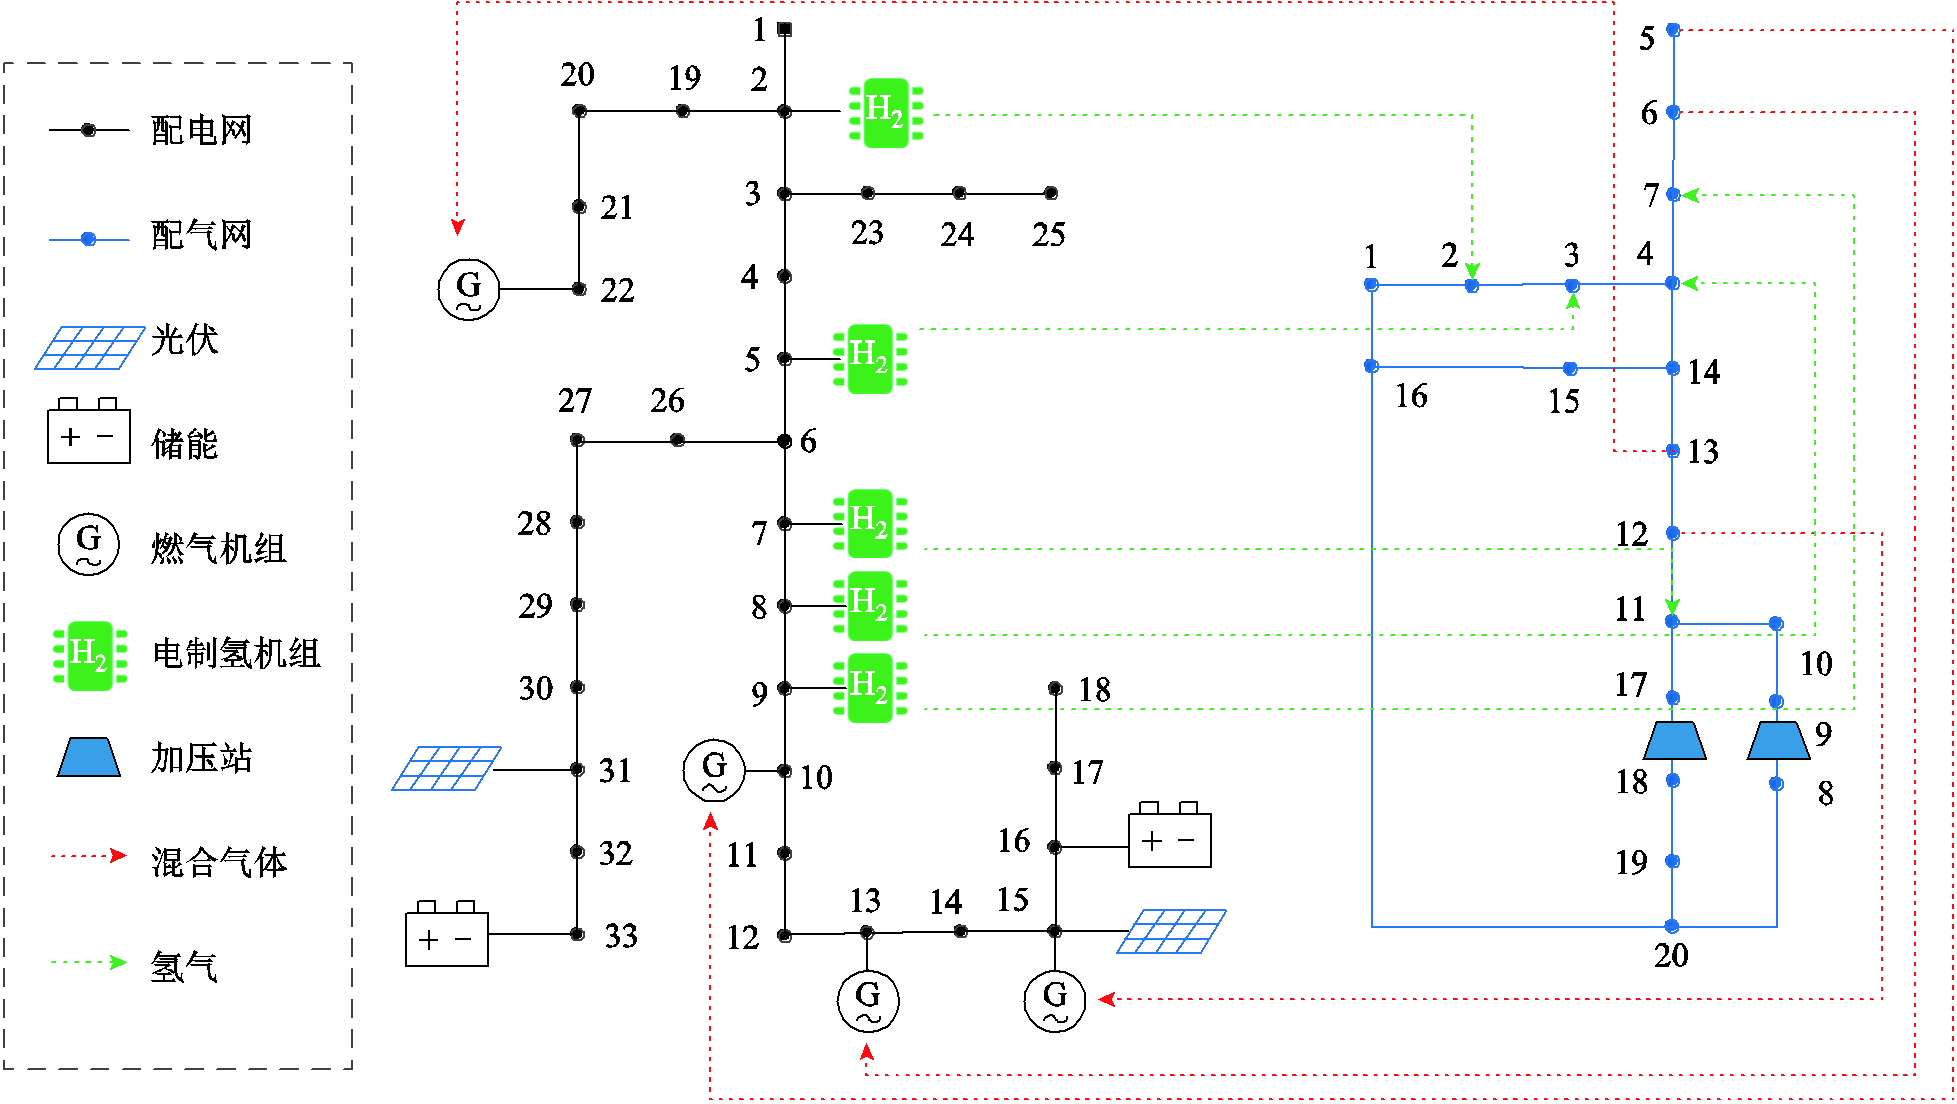
图3 33节点配电网系统和20节点配气网系统
Fig.3 Integrated distribution networks of 33-node power system and 20-node natural gas system
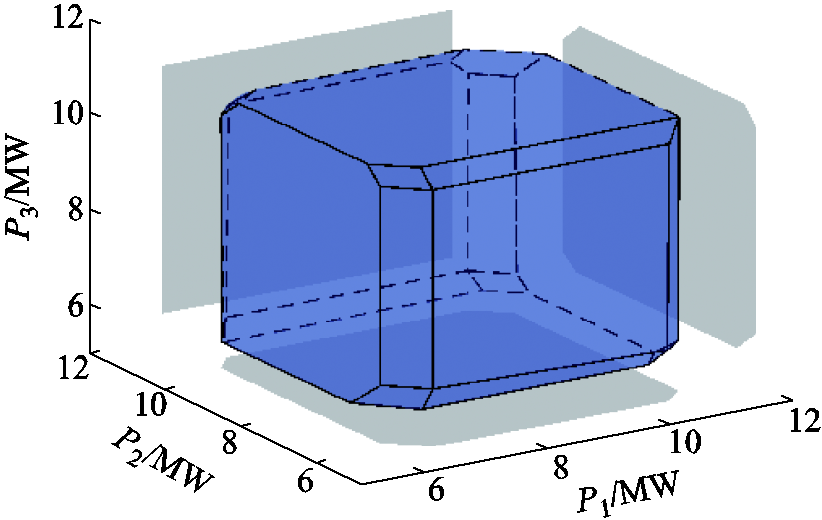
图4 三维有功运行域示意图
Fig.4 Three-dimensional active operating region
为说明本文所提运行域模型在配电网24 h时间断面下的刻画结果,本文以时序解耦形式将日内的运行域模型降维为24个二维运行域模型。图5给出了4:00—6:00、9:00—11:00、14:00—16:00、19:00—21:00的运行域。由图5可知,由于负荷需求和光伏出力的变化,不同时段下的运行域范围和面积均存在明显差异。附图3进一步给出了24个时段下的运行域面积(其中时段t对应运行域[ ,
, ])。由图5可知,受到光伏出力的影响,配电网灵活运行域面积在日内存在显著差异。其中,光伏出力为零时段(时段1~7、时段19~24)的运行域面积相比光伏高发时段(时段9~17)削减50%~230%。
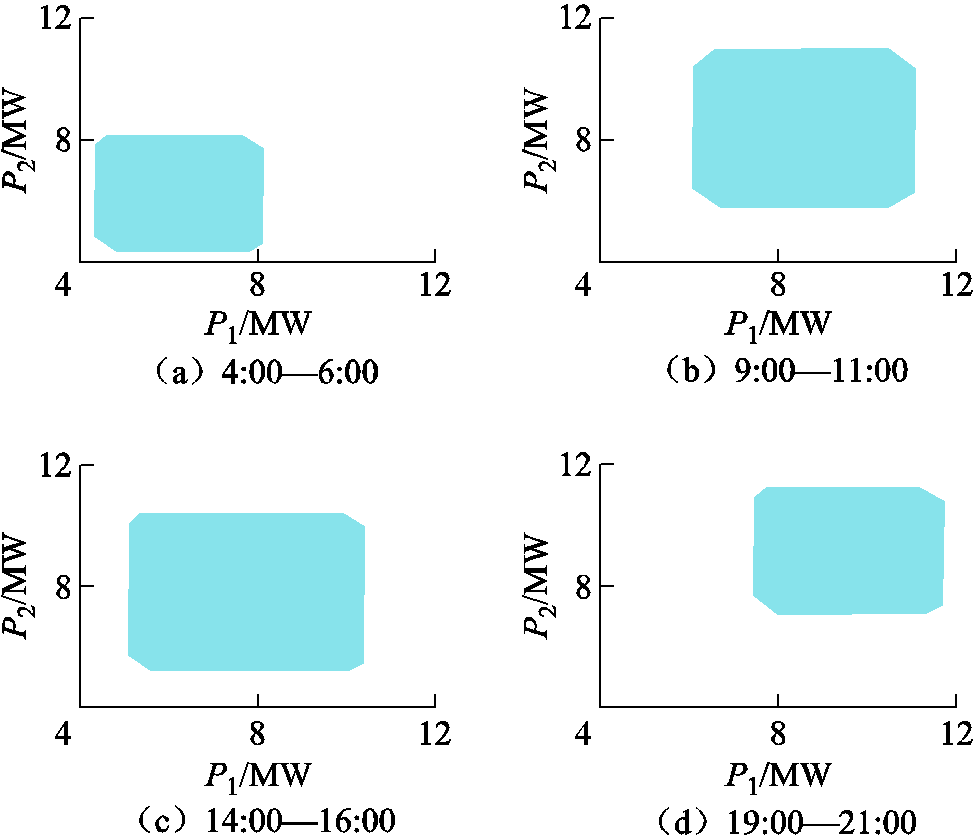
图5 不同时段下的二维运行域
Fig.5 Two-dimensional operating region at different time periods
综上所述,运行空间的量化对于配电网运行的准确安全评估具有重要意义。为方便说明,下文二维运行域统一取9:00—11:00为研究对象,三维运行域取9:00—12:00为研究对象。
为进一步分析各灵活资源对配电网灵活性的贡献度,本节基于确定性优化下P1-P2的灵活运行域,通过逐步增加灵活资源对比了不同灵活性资源下的配电网灵活运行域,结果如图6所示,其中运行域1~4为依次增加光伏、储能、燃气轮机和电制氢后的运行域。由图6可知,光伏出力主要影响灵活运行域的上边界,即可通过控制光伏消纳量来调整配电网根节点的功率交互量;而储能得益于其充能和放能的双向交互特性,对灵活运行域的上下边界均有较大影响,且其时域耦合特性限制了灵活运行域的对角边界;燃气机组作为电力供应,可替代部分根节点有功购入,因此拓展了灵活运行域下边界,其爬坡特性决定了灵活运行域的对角边界;与燃气机组类似,电制氢作为电力负荷,影响了灵活运行域的上边界和对角边界。
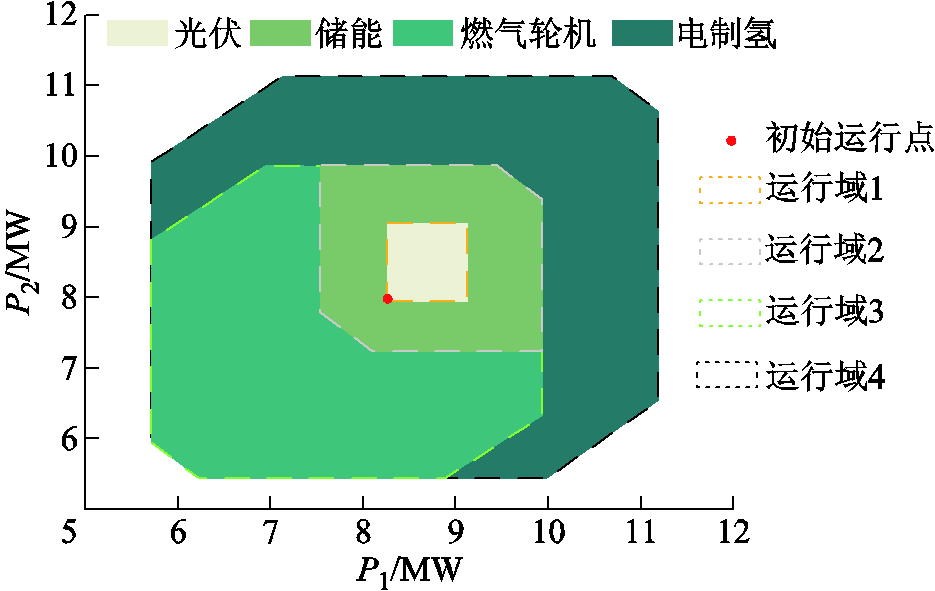
图6 不同资源对于运行域的贡献度分析
Fig.6 Contributions of different energy resources to the two-dimensional operating region
为分析光伏不确定性对灵活运行域的影响,本节首先对比了确定性优化和机会约束优化下的配电网三维灵活运行域,结果如图7所示。由图7可知,相比确定性灵活运行域,机会约束灵活运行域整体缩小(运行域体积减小了32.06%),主要原因在于燃气机组和电制氢机组在机会约束模型中需要提供一定有功调节裕度以平抑光伏出力波动,因而为根节点提供的运行空间有所降低。此外,确定性灵活运行域与机会约束灵活运行域在边界形态上呈现部分重叠特征,如图7中阴影部分所示。该边界由机组爬坡特性决定,而机会约束引起的机组保留裕度始终低于机组的最大爬坡功率,因此确定性灵活运行域和机会约束灵活运行域均受到该边界的制约。
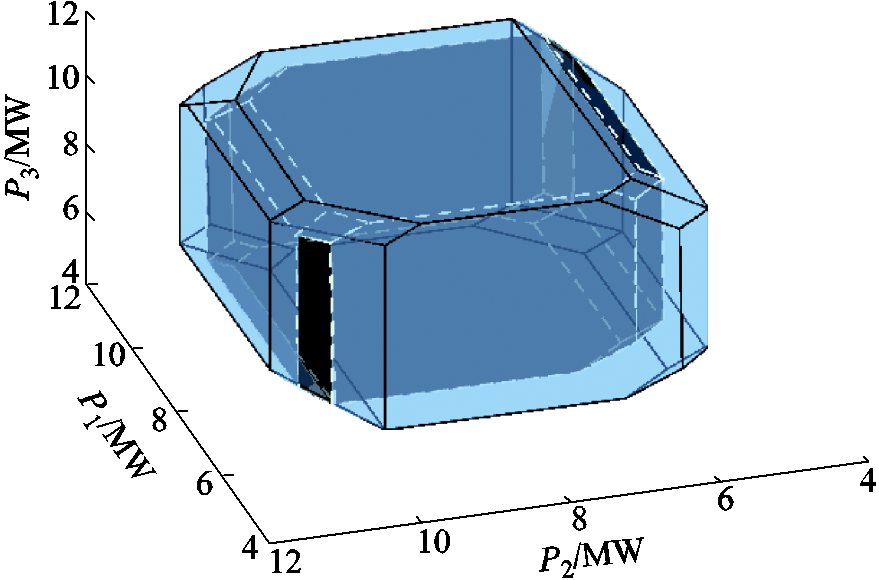
图7 确定性域与机会约束域对比(三维)
Fig.7 Comparison between deterministic region and chance-constrained region (three-dimensional)
为分析置信水平对灵活运行域的影响,图8展示了90%、95%和99%三种置信水平下配电网的二维灵活运行域。
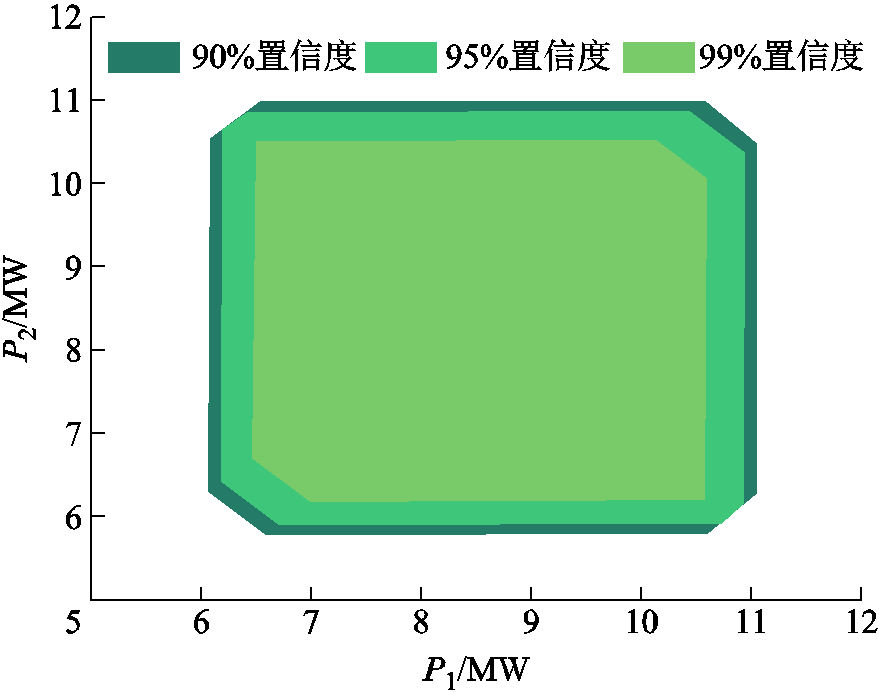
图8 不同置信度下的运行域对比
Fig.8 Comparison of operating region under different confidence levels
由图8可知,随着置信水平的提高,灵活运行域呈缩小趋势,这是由于高置信水平下机组和线路需要保持更高的裕度以平抑间歇性光伏波动,导致机组有功功率可调控范围缩小。此外,与4.2节的分析结果相同,二维运行域下爬坡特性造成的对角边界保持一致。
本节分析管道注氢比上限对于灵活运行域的影响。以二维运行域为例,2%、6%和10%三种不同注氢比上限的运行域对比如图9所示。由图9可知,灵活运行域的上边界随着注氢比上限的提高而增大。整体而言,当注氢比上限从2%提升至6%时,运行域面积提升35.70%,而上限增至10%时面积提升55.05%。这是由于注氢比上限限制了电制氢机组的实际出力。需要说明的是,注氢比上限对灵活运行域的扩展效应呈现显著的非线性饱和特性。该现象本质上是电制氢机组额定容量限制与天然气网络承载能力协同约束的结果。
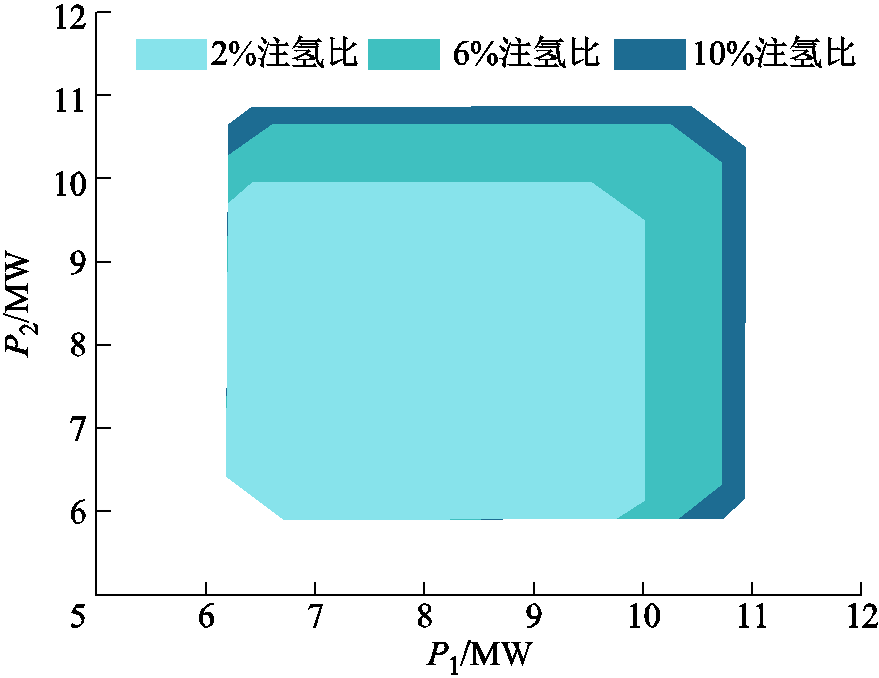
图9 不同注氢比上限下的运行域对比
Fig.9 Comparison of operating regions under different hydrogen injection ratio limits
基于不同的电制氢机组容量和天然气管网压力下限场景,进一步对比了灵活运行域面积随管道注氢比上限的变化情况,结果如图10所示。由图10a可知,随着压力下限值的升高,运行域面积显著减小,特别是当压力下限取到55 bar(1 bar=105 Pa)时,增加注氢比上限对于运行域面积已经无明显提升。该结果是由于氢气注入天然气后,必然引起热值降低,为供应相同能量的负荷,需传输更多的气体流量,进而造成更多的压降,当气体压力下降到最低值时,天然气系统已无法承载更多的绿氢注入。由图10b可知,提升电制氢装机容量可以在高注氢比场景(10%、14%)下增加运行域面积,但是在低注氢比场景(2%、6%)下无明显提升。这是因为较低的注氢比上限,电制氢少量出力便能达到,而较高的注氢比上限,即使机组全部出力也无法达到,因而装机容量对于运行域的提升只有在高注氢比场景才发挥作用。
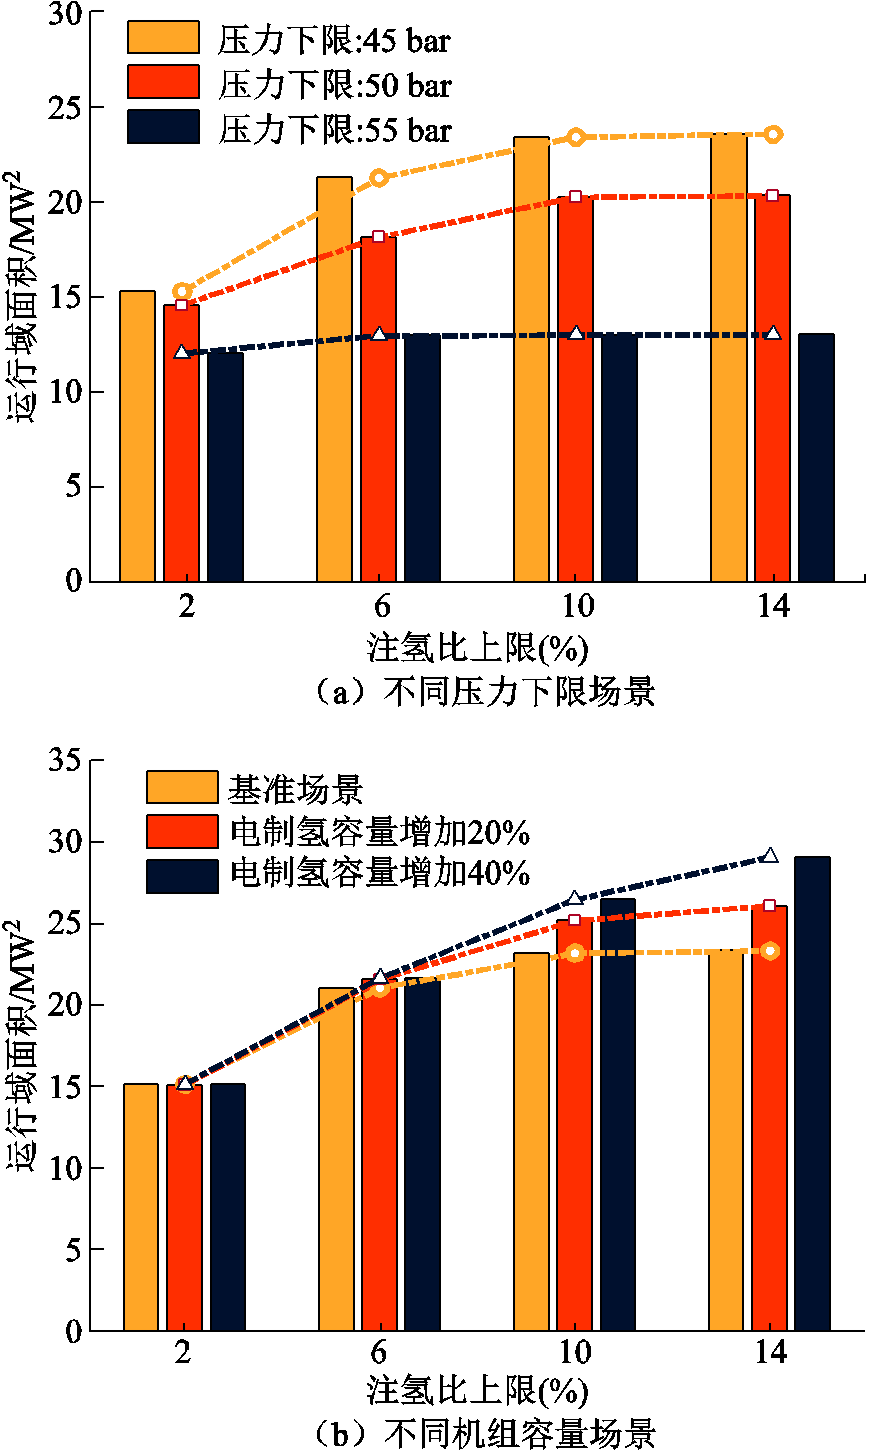
图10 运行域面积随注氢比上限的变化
Fig.10 Change of operating region area with respect to different hydrogen injection ratio limits
本节基于确定性优化下的P1-P2、P2-P3、P1-P3运行域,对比了本文所提径向自适应重构算法和传统径向迭代搜索方法的性能差异,对比结果见表1。由表1可知,相比径向迭代搜索方法,径向自适应重构算法的求解效率提升了100%~150%,该结果是由于径向自适应重构算法降低了模型求解次数。求解精度方面,二者所得运行域面积误差控制在0.5%以内,且该误差主要来自非线性模型的数值求解过程。同时,在4.1节~4.4节所涉及的运行域模型中,径向自适应重构算法求解二维运行域模型的时间均在8 min以内,求解三维运行域的求解时间在100 min以内。因而所提径向自适应重构算法具备较好的适用性和精确性。
表1 两种方法求解结果对比
Tab.1 Comparison of two methods for solving results
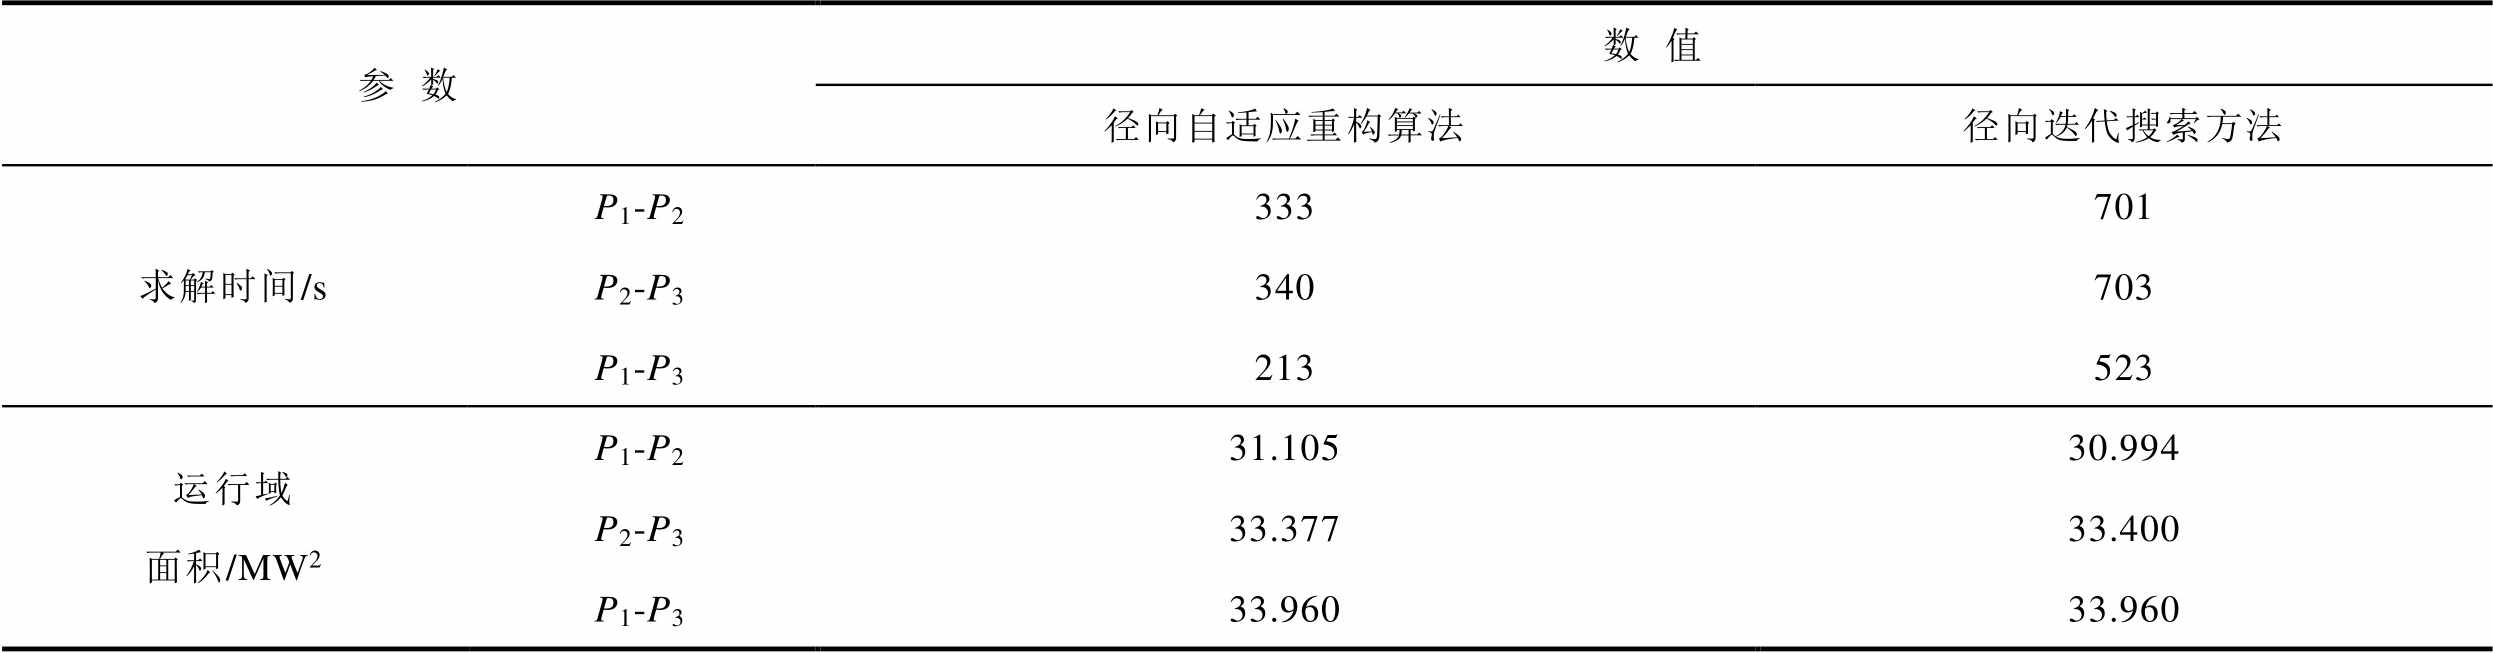
参数数值 径向自适应重构算法径向迭代搜索方法 求解时间/sP1-P2333701 P2-P3340703 P1-P3213523 运行域面积/MW2P1-P231.10530.994 P2-P333.37733.400 P1-P333.96033.960
本文构建了考虑电-气-氢混联综合能源配网多断面有功功率灵活运行域模型,采用机会约束表征光伏出力的不确定性,并通过径向自适应重构算法求解灵活运行域的边界点,生成连续时间段面下的配电网根节点有功功率灵活运行域,有效地支撑高比例新能源和管道掺氢下配电网灵活调控能力的精准评估。基于算例结果,可得以下结论:
1)本文构建的多断面灵活运行域刻画了不同时间断面间配电网的有功功率调节能力,可为配电网多时段调度和滚动优化提供技术参考,支撑新能源配电网灵活运行。
2)机会约束运行域有效地考虑了光伏出力不确定性对于配电网灵活运行的影响,且高置信度下导致配电网灵活运行空间受到限制,实际置信度的选择需综合考虑光伏预测精度与运行风险。
3)配气网管道注氢比上限直接影响配电网灵活运行域空间(2%、6%、10%混氢比下运行域空间存在显著差别),同时绿氢的灵活注入需充分考虑混氢配气网的安全运行约束。
本文所提刻画运行域方法对于凸多边形/多面体运行域具备良好的适用性;而对于高维非线性运行域,可通过增加重构次数(分段线性次数)以保证运行域的精度。
附 录
1. 算例仿真参数
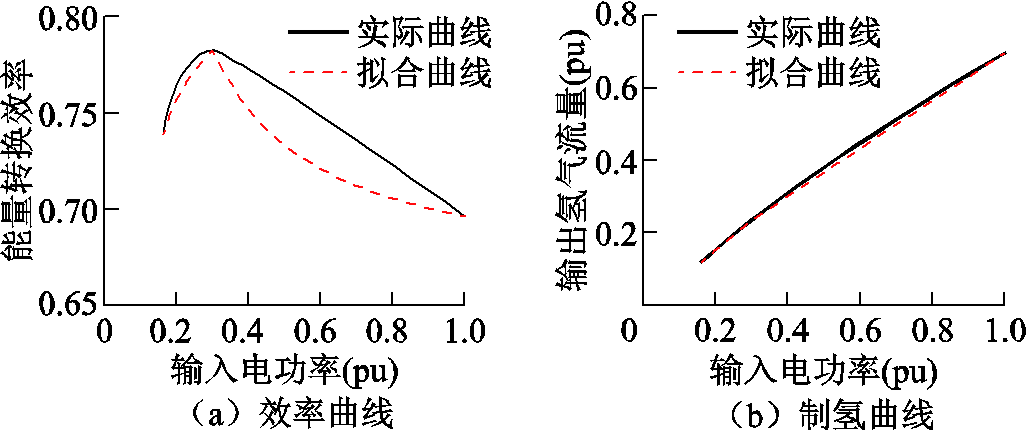
附图1 电制氢非线性制氢和效率曲线及其分段近似结果
App.Fig.1 Nonlinear productions/efficiency curve for electrolyzer and segmented approximation curve
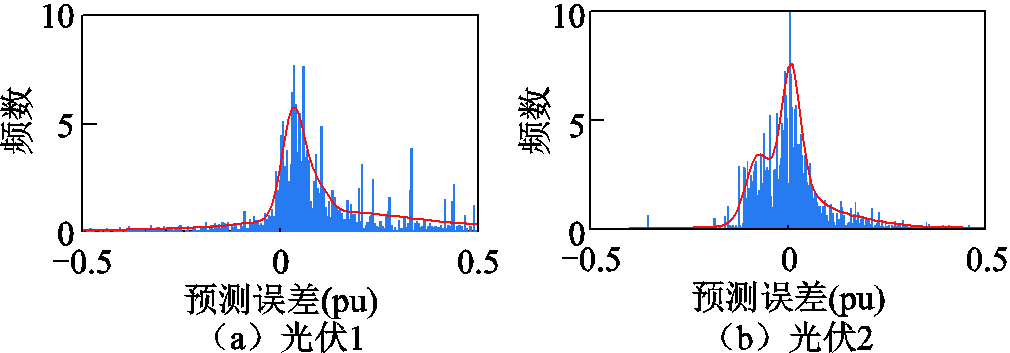
附图2 光伏预测误差频率直方图及聚合曲线
App.Fig.2 Frequency histogram of photovoltaic forecast error and aggregation curves
2. 配气网侧机会约束模型及推导过程
给定配气网气源、管道首末端流量、管道平均流量和节点压力的平抑系数分别为 、
、 、
、 和
和 ,此时实际值表述为
附表1 新能源预测误差95%置信区间
App.Tab.1 Confidence interval of photovoltaic forecast error at different confidence levels
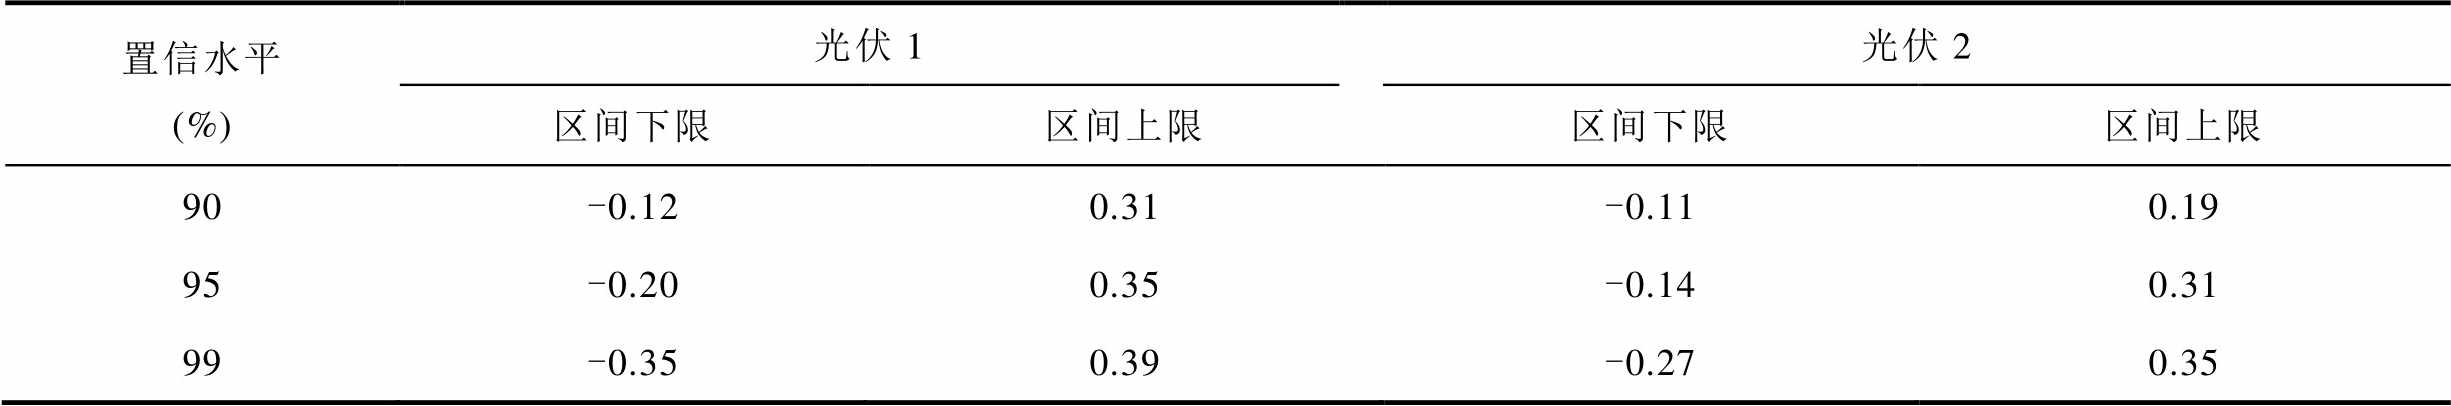
置信水平(%)光伏1光伏2 区间下限区间上限区间下限区间上限 90-0.120.31-0.110.19 95-0.200.35-0.140.31 99-0.350.39-0.270.35
附表2 耦合设备参数
App.Tab.2 Parameters for coupling equipment
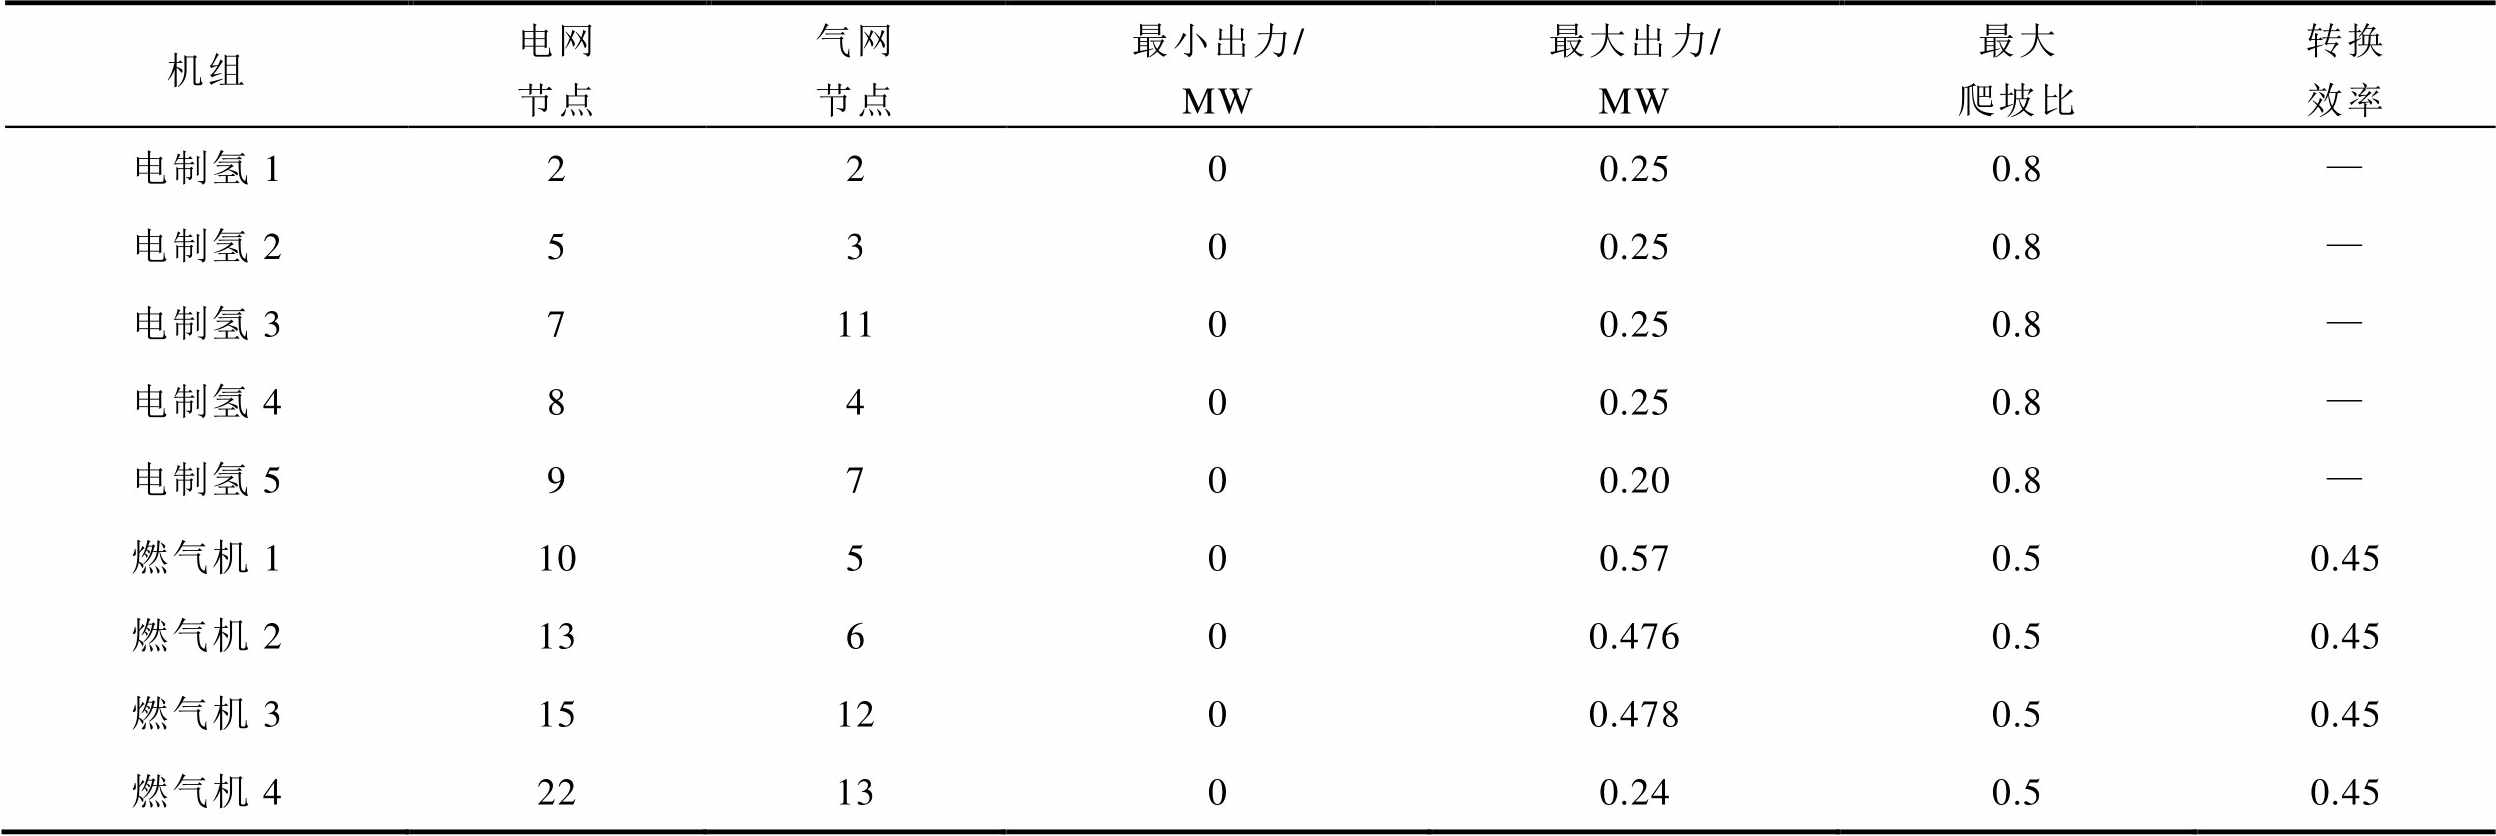
机组电网节点气网节点最小出力/MW最大出力/MW最大爬坡比转换效率 电制氢12200.250.8— 电制氢25300.250.8— 电制氢371100.250.8— 电制氢48400.250.8— 电制氢59700.200.8— 燃气机110500.570.50.45 燃气机213600.4760.50.45 燃气机3151200.4780.50.45 燃气机4221300.240.50.45
附表3 天然气源参数
App.Tab.3 Equipment parameters for natural gas source
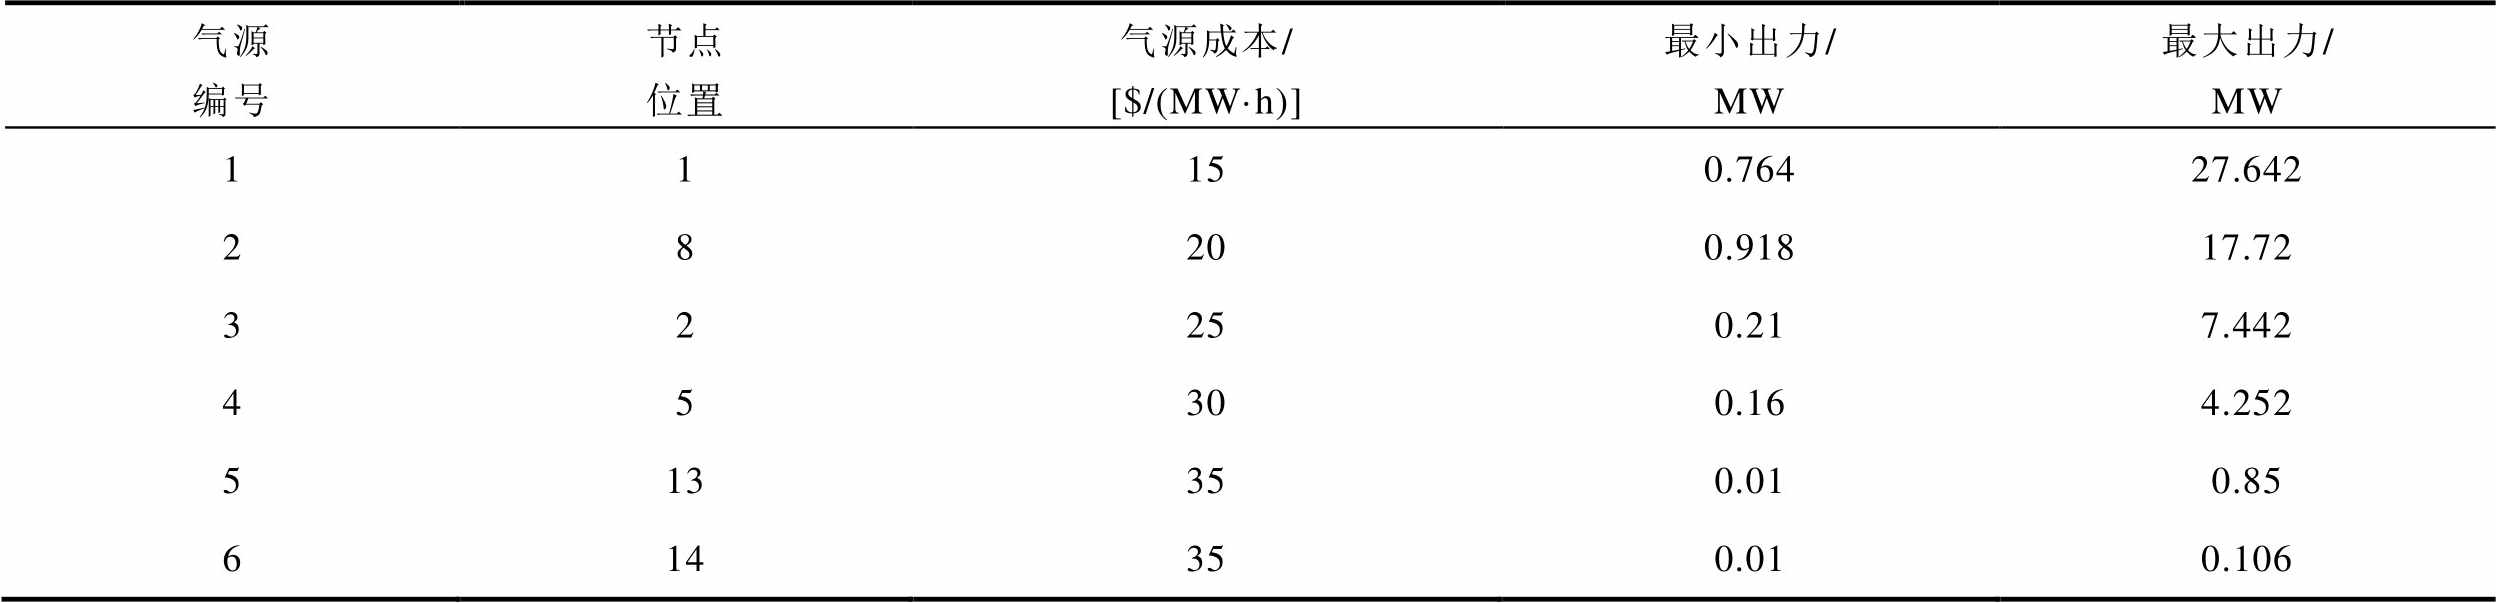
气源编号节点位置气源成本/[$/(MW·h)]最小出力/MW最大出力/MW 11150.76427.642 28200.91817.72 32250.217.442 45300.164.252 513350.010.85 614350.010.106
附表4 储能和光伏设备参数
App.Tab.4 Parameters for energy storage and photovoltaic
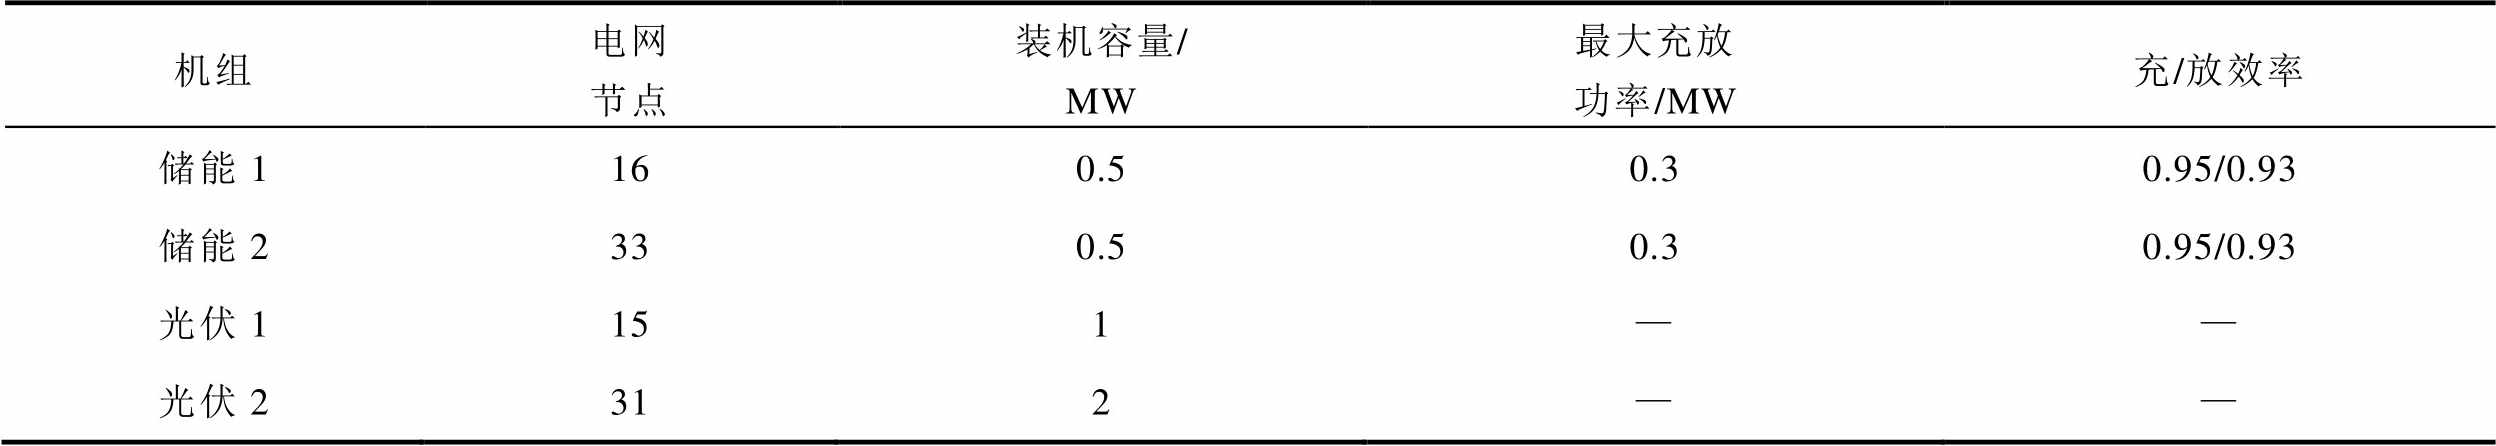
机组电网节点装机容量/MW最大充放功率/MW充/放效率 储能1160.50.30.95/0.93 储能2330.50.30.95/0.93 光伏1151—— 光伏2312——
附表5 加压站参数
App.Tab.5 Equipment parameters for pressure station
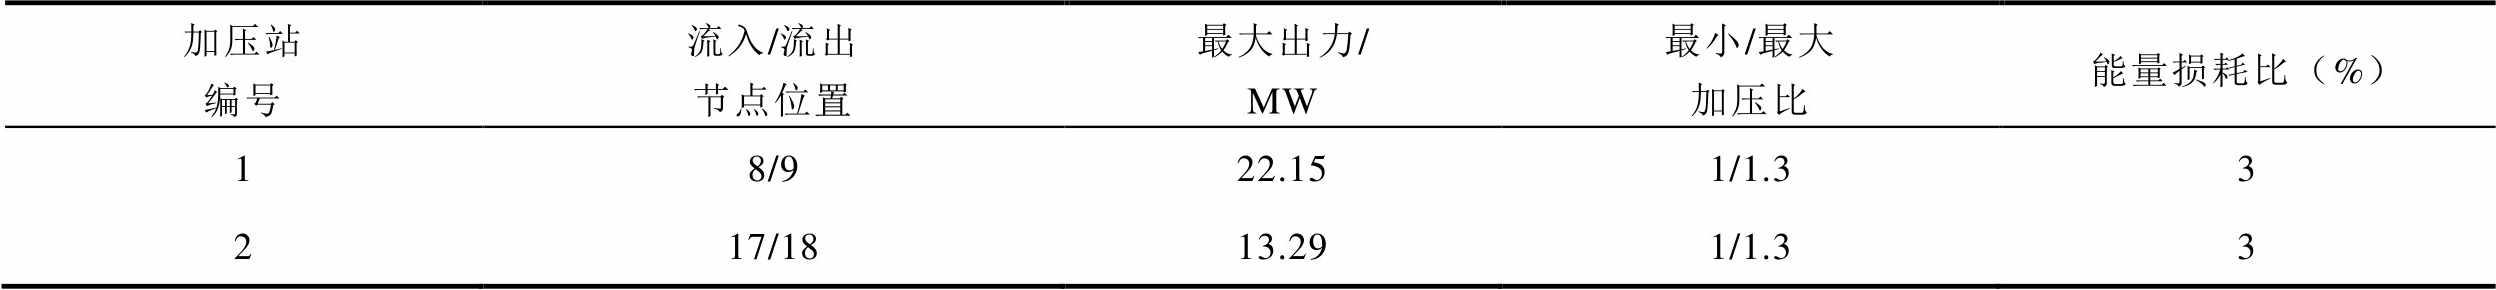
加压站编号流入/流出节点位置最大出力/MW最小/最大加压比能量损耗比(%) 18/922.151/1.33 217/1813.291/1.33
 (A1)
(A1)
 (A2)
(A2)
 (A3)
(A3)
 (A4)
(A4)
将式(A1)~式(A4)代入式(18)~式(22)中,可得
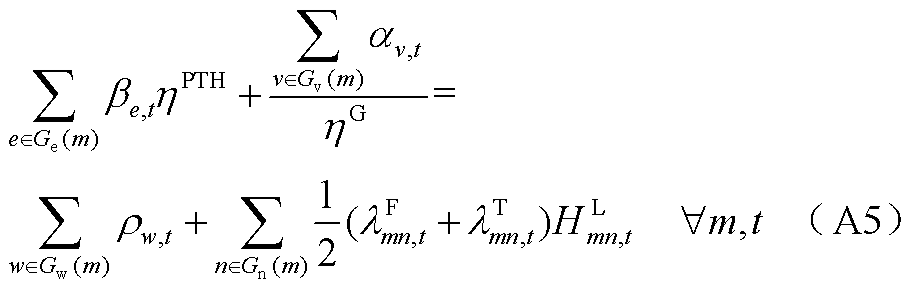
 (A6)
(A6)
 (A7)
(A7)
 (A8)
(A8)
此时,相应变量的机会约束形式为
 (A9)
(A9)
确定性转换形式为
 (A10)
(A10)
 (A11)
(A11)
 (A12)
(A12)
 (A13)
(A13)
3. 运行域的边界表达式推导
为明确运行域边界的物理意义,此处以二维运行域为例,从功率平衡角度出发,推导了运行域的边界表达式。在实际配电网运行过程中,配电网侧的线路容量、节点电压以及配气网侧的节点压力、注氢比的相关约束等都会限制机组的有功出力,因此,仅从功率平衡推导的表达式结果较为保守。
由有功平衡方程可得连续时间段面[t,t+1]下的有功功率为
 (A14)
(A14)
 (A15)
(A15)
机会约束下发电机组 的实际出力下限和上限受到功率裕度的制约,即
 (A16)
(A16)
 (A17)
(A17)
同理,电制氢机组 的实际出力下限和上限的具体表达式分别为
 (A18)
(A18)
 (A19)
(A19)
根据机组出力限制,运行域的左、右、下、上边界分别为
 (A20)
(A20)
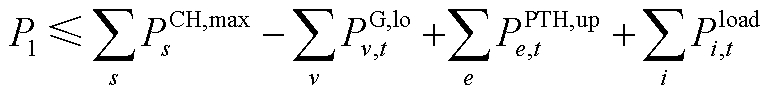 (A21)
(A21)
 (A22)
(A22)
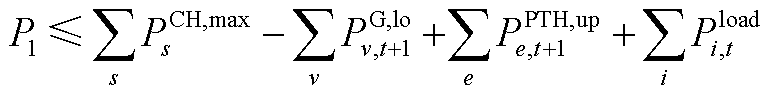 (A23)
(A23)
根据式(A14)和式(A15),可得对角边界为
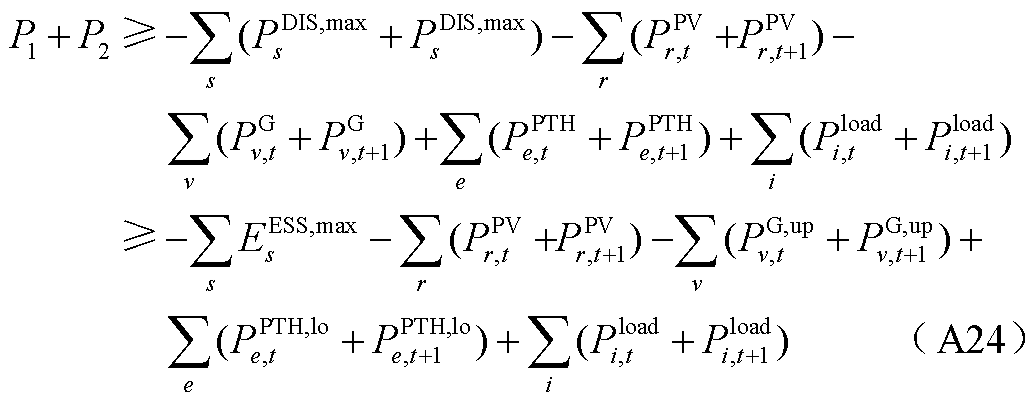
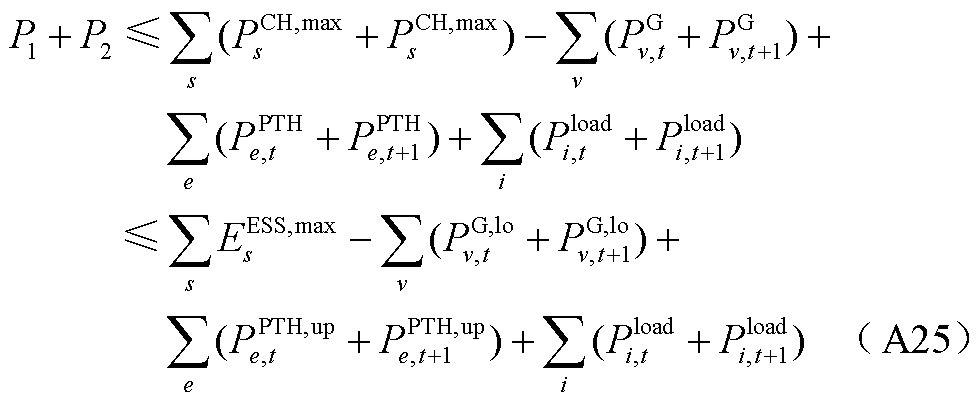
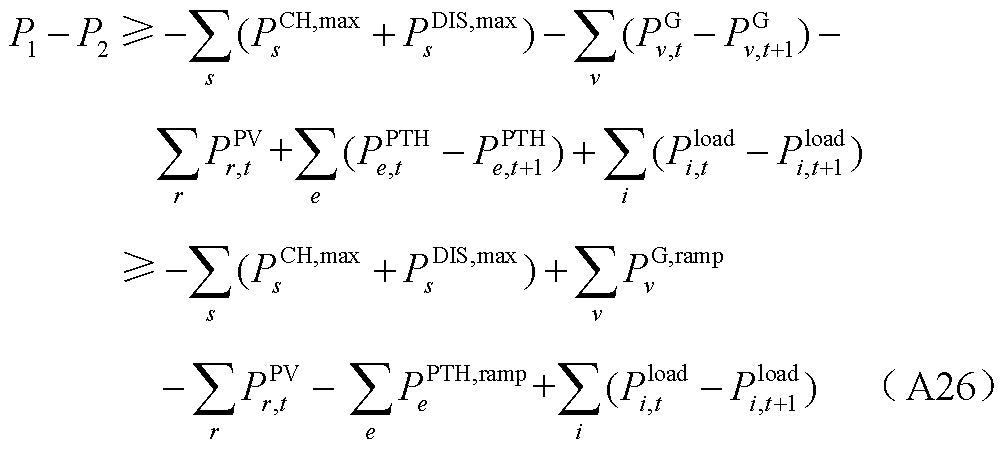
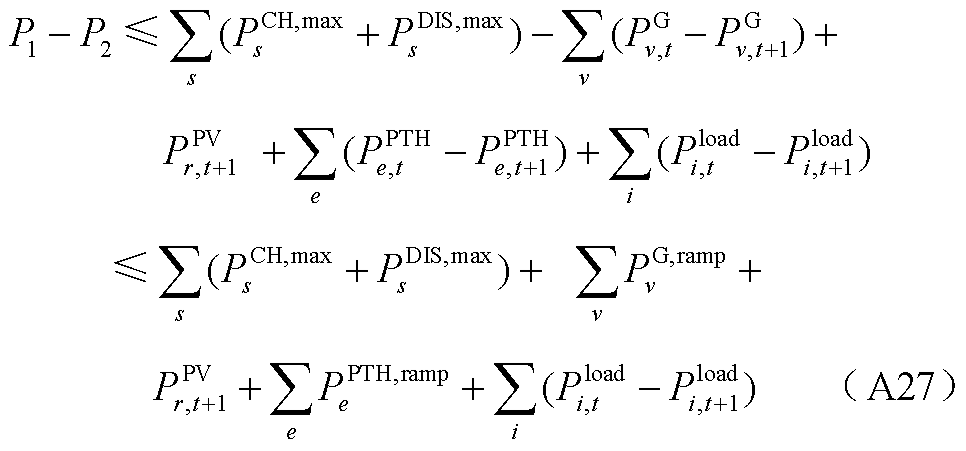
式(A24)和式(A25)的时域耦合特性由储能容量决定,式(A26)和式(A27)的时域耦合特性由燃气机组和电制氢机组的爬坡功率决定。
由式(A20)~式(A27)可知,二维运行域为多边形域,其中灵活运行空间主要取决于各类机组出力裕度,时域耦合特性取决于机组爬坡限制和储能容量限制。三维运行域边界条件更为复杂,但本质与二维运行域类似,可预见为多面体域,此处不再推导。
4.径向自适应重构算法伪代码
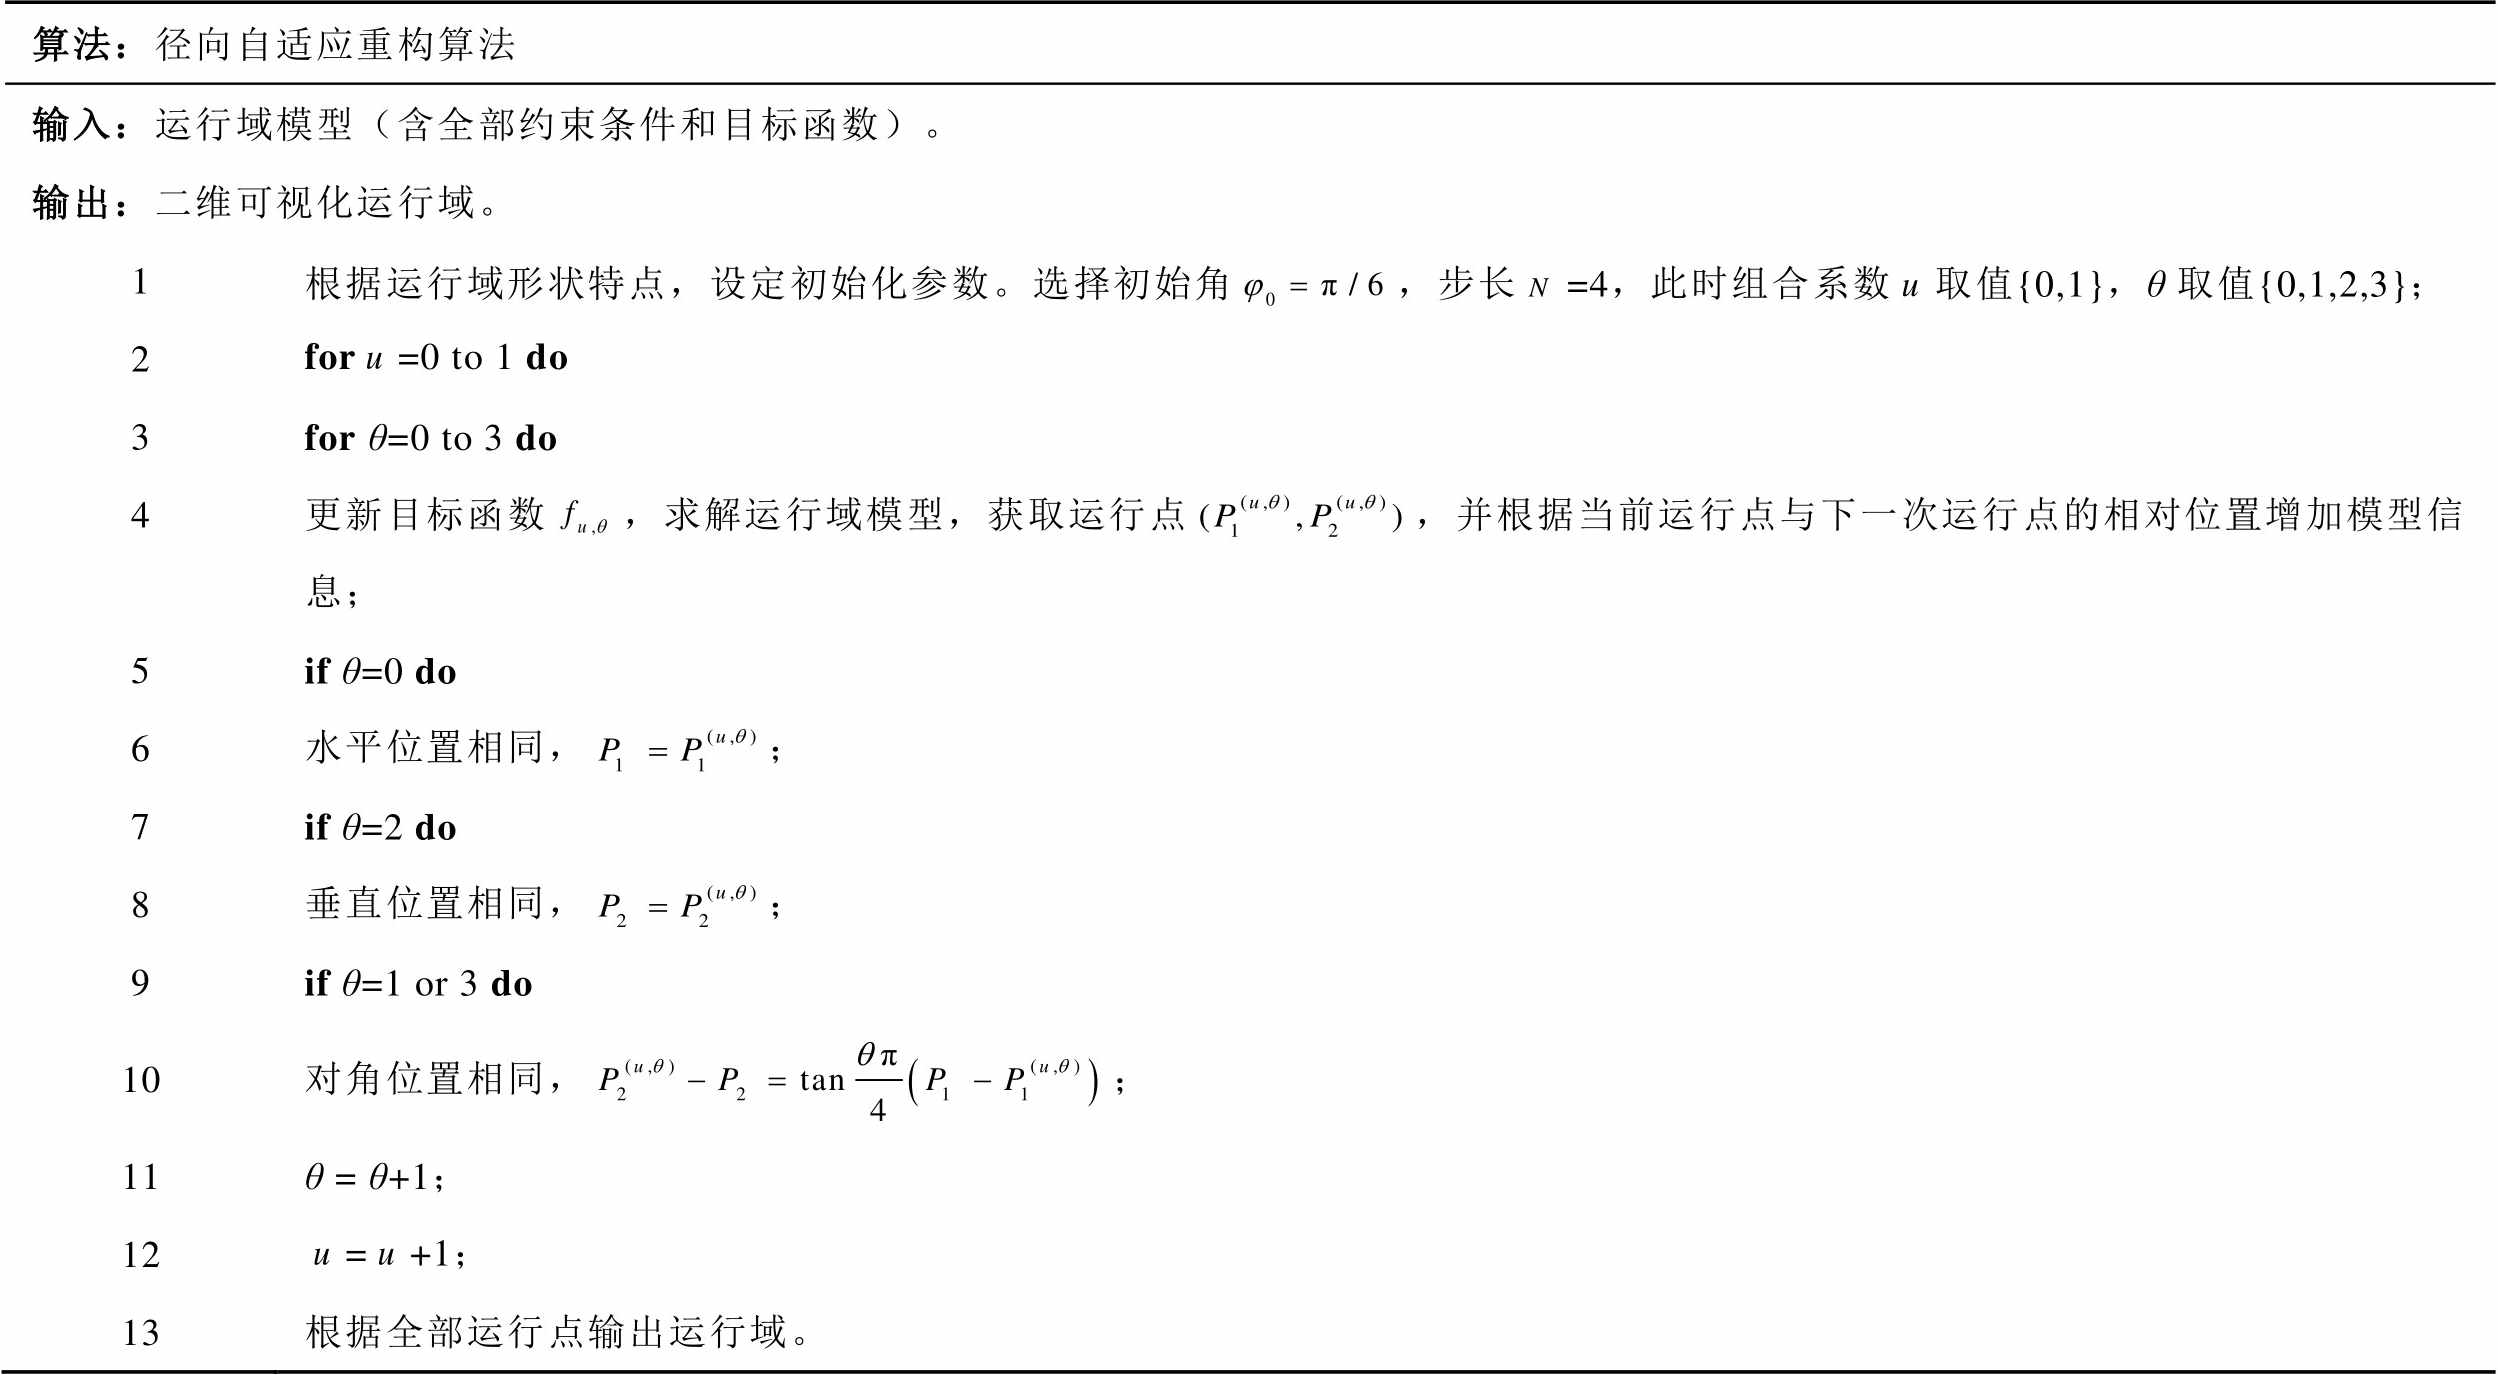
算法:径向自适应重构算法 输入:运行域模型(含全部约束条件和目标函数)。 输出:二维可视化运行域。 1根据运行域形状特点,设定初始化参数。选择初始角,步长=4,此时组合系数取值{0,1},θ取值{0,1,2,3}; 2for=0 to 1 do 3for θ=0 to 3 do 4更新目标函数,求解运行域模型,获取运行点,并根据当前运行点与下一次运行点的相对位置增加模型信息; 5ifθ=0 do 6水平位置相同,; 7ifθ=2 do 8垂直位置相同,; 9ifθ=1 or 3 do 10对角位置相同,; 11θ = θ+1; 12=+1; 13根据全部运行点输出运行域。
5. 不同时段下的运行域面积
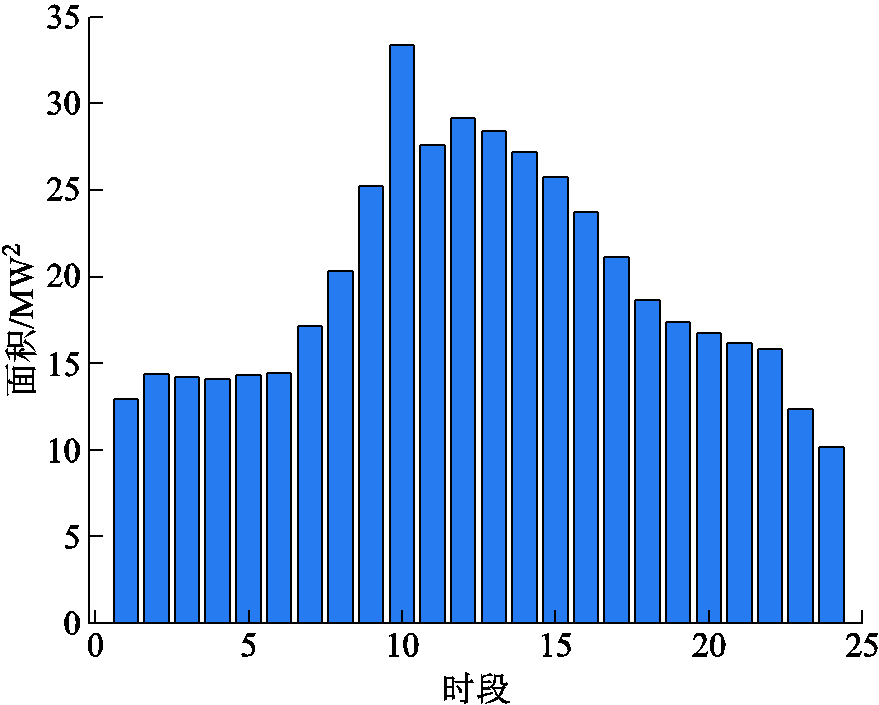
附图3 不同时段下的运行域面积
App.Fig.3 Operating region area at different time periods
参考文献
[1] 刘文昕, 方家琨, 胡可崴, 等. 计及氢气-天然气混输的气电综合能源系统动态最优能流计算[J]. 电工技术学报, 2023, 38(增刊1): 1-17.
Liu Wenxin, Fang Jiakun, Hu Kewei, et al. Dynamic optimal energy flow in the integrated natural gas and electrical power systems considering hydrogen-blended transient transportation process[J]. Transactions of China Electrotechnical Society, 2023, 38(S1): 1-17.
[2] 李佳蓉, 林今, 邢学韬, 等. 主动配电网中基于统一运行模型的电制氢(P2H)模块组合选型与优化规划[J]. 中国电机工程学报, 2021, 41(12): 4021-4033.
Li Jiarong, Lin Jin, Xing Xuetao, et al. Technology portfolio selection and optimal planning of power-to-hydrogen(P2H) modules in active distribution network[J]. Proceedings of the CSEE, 2021, 41(12): 4021-4033.
[3] 蒙军, 任洲洋, 王皓. 氢能交互下的多区域电氢综合能源系统可靠性提升策略[J]. 电工技术学报, 2024, 39(16): 5011-5027.
Meng Jun, Ren Zhouyang, Wang Hao. Reliability improvement strategies of multi-region electricity-hydrogen integrated energy systems considering hydrogen interaction between different regions[J]. Transactions of China Electrotechnical Society, 2024, 39(16): 5011-5027.
[4] 李建林, 张则栋, 梁策, 等. 计及源-荷不确定性的综合能源系统多目标鲁棒优化调度[J]. 上海交通大学学报, 2025, 59(2): 175-185.
Li Jianlin, Zhang Zedong, Liang Ce, et al. Multi-objective robustness of integrated energy system considering source-load uncertainty[J]. Journal of Shanghai Jiao Tong University, 2025, 59(2): 175-185.
[5] 中国石化经济技术研究院. 中国石化首次发布氢能展望报告预计2060年氢能产业规模4.6万亿元[N]. 中国石化报, 2024-01-08(008).
[6] 邱玥, 周苏洋, 顾伟, 等. “碳达峰、碳中和”目标下混氢天然气技术应用前景分析[J]. 中国电机工程学报, 2022, 42(4): 1301-1321.
Qiu Yue, Zhou Suyang, Gu Wei, et al. Application prospect analysis of hydrogen enriched compressed natural gas technologies under the target of carbon emission peak and carbon neutrality[J]. Proceedings of the CSEE, 2022, 42(4): 1301-1321.
[7] 陈胜, 张景淳, 卫志农, 等. 面向能源转型的电-气-氢综合能源系统规划与运行[J]. 电力系统自动化, 2023, 47(19): 16-30.
Chen Sheng, Zhang Jingchun, Wei Zhinong, et al. Energy transition oriented planning and operation of electricity-gas-hydrogen integrated energy system[J]. Automation of Electric Power Systems, 2023, 47(19): 16-30.
[8] 谭洪, 王宇炜, 王秋杰, 等. 基于氢能固态运输的电-氢综合能源系统双层调度模型[J]. 电工技术学报, 2025, 40(3): 744-758.
Tan Hong, Wang Yuwei, Wang Qiujie, et al. A bi-level dispatching model for electricity-hydrogen integrated energy system based on hydrogen solidity transport[J]. Transactions of China Electrotechnical Society, 2025, 40(3): 744-758.
[9] 冯健冰, 任洲洋, 姜云鹏, 等. 电力系统定碳排运行域: 概念与方法[J]. 中国电机工程学报, 2024, 44(22): 8846-8860.
Feng Jianbing, Ren Zhouyang, Jiang Yunpeng, et al. Committed carbon emissions operation regions of power system: concept and method[J]. Proceedings of the CSEE, 2024, 44(22): 8846-8860.
[10] 薛晟, 代林昊, 李锦键. 基于电-氢混合储能的综合能源系统直流母线电压虚拟惯性控制策略[J/OL]. 发电技术, 2025: 1-12. (2025-04-02). https://kns. cnki.net/kcms/detail/detail.aspx?dbcode=CJFD&dbname= CJFD&filename=SLJX20250402004.
Xue Sheng, Dai Linhao, Li Jinjian. Virtual inertia control strategy for direct current bus voltage in integrated energy systems based on electro-hydrogen hybrid energy storage[J/OL]. Power Generation Technology, 2025: 1-12. (2025-04-02). https://kns.cnki. net/kcms/detail/detail.aspx?dbcode=CJFD&dbname=CJFD&filename=SLJX20250402004.
[11] 胡俊杰, 童宇轩, 刘雪涛, 等. 计及精细化氢能利用的综合能源系统多时间尺度鲁棒优化策略[J]. 电工技术学报, 2024, 39(5): 1419-1435.
Hu Junjie, Tong Yuxuan, Liu Xuetao, et al. Multi-time-scale robust optimization strategy for integrated energy system considering the refinement of hydrogen energy use[J]. Transactions of China Electrotechnical Society, 2024, 39(5): 1419-1435.
[12] Rabiee A, Keane A, Soroudi A. Green hydrogen: a new flexibility source for security constrained scheduling of power systems with renewable energies[J]. International Journal of Hydrogen Energy, 2021, 46(37): 19270-19284.
[13] 陈胜, 张景淳, 韩海腾, 等. 计及辅助服务的电-气-氢综合能源系统优化调度[J]. 电力系统自动化, 2023, 47(11): 110-120.
Chen Sheng, Zhang Jingchun, Han Haiteng, et al. Optimal dispatch of electricity-gas-hydrogen integrated energy system considering auxiliary service[J]. Automation of Electric Power Systems, 2023, 47(11): 110-120.
[14] Fu Chen, Lin Jin, Song Yonghua, et al. Optimal operation of an integrated energy system incorporated with HCNG distribution networks[J]. IEEE Transactions on Sustainable Energy, 2020, 11(4): 2141-2151.
[15] 魏震波, 李杰, 杨超, 等. 基于动态掺氢策略的综合能源系统低碳经济调度[J]. 电网技术, 2024, 48(8): 3155-3164.
Wei Zhenbo, Li Jie, Yang Chao, et al. Low-carbon economic scheduling for integrated energy system based on dynamic hydrogen doping strategy[J]. Power System Technology, 2024, 48(8): 3155-3164.
[16] 王丹, 李思源, 贾宏杰, 等. 含可再生能源的区域综合能源系统区间化安全域研究(二): 全维观测与域的几何特征优化[J]. 中国电机工程学报, 2022, 42(21): 7809-7821.
Wang Dan, Li Siyuan, Jia Hongjie, et al. Research on interval security region of regional integrated energy system integrated with renewable energy sources, part Ⅱ: full-dimensional observation and optimization of region geometric features[J]. Proceedings of the CSEE, 2022, 42(21): 7809-7821.
[17] Zhang Shida, Ge Shaoyun, Liu Hong, et al. Region-based flexibility quantification in distribution systems: an analytical approach considering spatio-temporal coupling[J]. Applied Energy, 2024, 355: 122175.
[18] Chen Xin, Li Na. Leveraging two-stage adaptive robust optimization for power flexibility aggregation [J]. IEEE Transactions on Smart Grid, 2021, 12(5): 3954-3965.
[19] 张基岳, 任洲洋, 姜云鹏, 等. 微电网定碳排运行域: 理论、构建与观测[J]. 电工技术学报, 2024, 39(8): 2342-2359.
Zhang Jiyue, Ren Zhouyang, Jiang Yunpeng, et al. Committed carbon emission operation region of microgrids: theory, construction and observation[J]. Transactions of China Electrotechnical Society, 2024, 39(8): 2342-2359.
[20] Chen Weitao, Wang Xiaojun, Wei Wei, et al. Exploiting the flexibility of district heating system for distribution system operation: set-based characterization and temporal decomposition[J]. IEEE Transactions on Sustainable Energy, 2025, 16(1): 227-241.
[21] Li Hengyi, Qin Boyu, Wang Shihan, et al. Aggregate power flexibility of multi-energy systems supported by dynamic networks[J]. Applied Energy, 2025, 377: 124565.
[22] Jiang Yunpeng, Ren Zhouyang, Lu Chunhao, et al. A region-based low-carbon operation analysis method for integrated electricity-hydrogen-gas systems[J]. Applied Energy, 2024, 355: 122230.
[23] 裴蕾, 卫志农, 陈胜, 等. 基于凸包络的交直流混合配电网安全域[J]. 电力系统自动化, 2021, 45(18): 45-51.
Pei Lei, Wei Zhinong, Chen Sheng, et al. Convex hull based security region for AC/DC hybrid distribution networks[J]. Automation of Electric Power Systems, 2021, 45(18): 45-51.
[24] Baumhof M T, Raheli E, Johnsen A G, et al. Optimization of hybrid power plants: when is a detailed electrolyzer model necessary [C]//2023 IEEE Belgrade PowerTech, Belgrade, Serbia, 2023: 1-10.
[25] Zhang Lu, Tong Bo, Wang Zhaoqi, et al. Optimal configuration of hybrid AC/DC distribution network considering the temporal power flow complementarity on lines[J]. IEEE Transactions on Smart Grid, 2022, 13(5): 3857-3866.
[26] 陈明健, 陈胜, 王异成, 等. 考虑氢能绿证的电-氢综合能源系统机会约束优化调度[J]. 电力自动化设备, 2023, 43(12): 206-213.
Chen Mingjian, Chen Sheng, Wang Yicheng, et al. Chance constrained optimal scheduling of electric-hydrogen integrated energy system considering green certificate of hydrogen energy[J]. Electric Power Automation Equipment, 2023, 43(12): 206-213.
[27] Früh H, Müller S, Contreras D, et al. Coordinated vertical provision of flexibility from distribution systems[J]. IEEE Transactions on Power Systems, 2023, 38(2): 1834-1844.
[28] 河海大学. 一种基于遍历搜索方法的电-气-氢混联配网系统灵活域分析方法: 202410668594.7[P]. 2024-10-01.
[29] Zhang Tiance, Wang Jianxiao, Li Gengyin, et al. Characterizing temporal-coupled feasible region of active distribution networks[J]. IEEE Transactions on Industry Applications, 2022, 58(5): 5687-5696.
Abstract The integration of high proportions of renewable energy and hydrogen blending in gas pipelines presents significant challenges for the flexible operation of distribution networks. Currently, the operation domain of distribution networks emphasizes the flexibility characterization of active and reactive power in a single time segment, while there is a lack of research focusing on the construction of multi-time segment operation domain models under multi-energy coupling. Furthermore, due to the high-dimensional nonlinearity of the coupled electrical-gas-hydrogen multi-energy flow equations, the analytical methods based on projection approximation are difficult to apply directly to construct the operation domain. Additionally, simulation methods for searching boundary points also suffer from low computational efficiency. To address this, this paper uses electrical-gas-hydrogen coupling as a framework, taking into account the dynamic hydrogen production characteristics of hydrogen generation units and the quasi-dynamic operation processes of the gas network under pipeline hydrogen blending, thereby constructing a flexible operation domain model for integrated electrical-gas-hydrogen energy distribution networks.
Firstly, considering the quasi-dynamic operation process of pipeline hydrogen blending in the distribution network, a coupled electrical-gas-hydrogen integrated energy distribution network operation model was established. Next, taking into account photovoltaic forecasting errors and the multi-cross-section time-domain coupling characteristics of the system, an opportunity-constrained flexible operation domain model for the distribution network with pipeline hydrogen blending was constructed. Then, the radial adaptive reconstruction algorithm was utilized to obtain the boundary operational points of the flexible operation domain, and the flexible operation domain space was constructed based on these points. Finally, tests were conducted within a coupled electrical-gas system composed of a 33-node distribution network and a 20-node gas network, where the visually represented flexible operation domain space accurately and intuitively depicted the impact of photovoltaic uncertainty and flexible resource regulation characteristics on the flexible regulation capability of the distribution network.
Based on the results of the case studies, the following conclusions can be drawn: (1) The multi-time segment flexible operation domain constructed in this paper characterizes the active regulation capability of the distribution network across different time segments, thereby providing a technical reference for multi-period scheduling and rolling optimization of the distribution network, supporting the flexible operation of renewable energy-based distribution networks. (2) The opportunity-constrained operation domain effectively considers the impact of photovoltaic output uncertainty on the flexible operation of the distribution network, revealing that under high confidence levels, the flexible operation space of the distribution network is constrained. The selection of actual confidence levels must comprehensively take into account the accuracy of photovoltaic forecasting and operational risks. (3) The upper limit of hydrogen injection ratios in the gas network pipeline directly affects the flexible operation domain space of the distribution network, with significant differences observed under 2%, 6%, and 10% hydrogen blending ratios. Additionally, the flexible injection of green hydrogen must adequately consider the safe operational constraints of the blended gas network.
keywords:Distribution network, natural gas network with hydrogen injections, flexible operating region, chance-constrained optimization
中图分类号:TM73
DOI: 10.19595/j.cnki.1000-6753.tces.241804
国家自然科学基金项目(52377091)和中国科协青年人才托举工程项目(2021QNRC001)资助。
收稿日期 2024-10-16
改稿日期 2025-04-11
陈 胜 男,1990年生,教授,研究方向为综合能源系统运行与市场交易、能源系统低碳化转型。E-mail:chensheng2019@hhu.edu.cn(通信作者)
陈明健 男,2000年生,硕士研究生,研究方向为绿氢综合能源系统。E-mail:599036409@qq.com
(编辑 赫 蕾)