图1 电缆线路的分布参数模型
Fig.1 Distributed parameter model of cable line
摘要 为解决现有的电缆局部缺陷检测方法中缺陷定位效果差、缺陷类型判断困难等问题,提出一种基于反射系数谱(RCS)的新型电缆缺陷诊断方法。首先,利用电缆线路的分布参数模型,建立了含局部缺陷电缆线路的RCS数学模型,根据RCS数学模型,确定合理的核函数,设计出基于RCS的新型缺陷诊断函数,该缺陷诊断函数的极值峰可用于定位电缆线路中的缺陷,并确定缺陷的类型、严重程度等特征;然后,对不同类型与严重程度的电缆线路缺陷进行建模仿真诊断,测试该方法的可行性与准确性;最后,在同轴电缆与10 kV电力电缆上设计了局部缺陷,并用该方法对真实电缆缺陷进行诊断分析。仿真与实测结果表明,该方法能精准地定位电缆线路中的缺陷,并且可以准确地判断出缺陷的类型与严重程度,说明了该方法的实用性,且具有较高的实际工程价值。
关键词:电缆线路 局部缺陷 反射系数谱 缺陷定位 缺陷分析
随着城市电网建设的快速发展,交联聚乙烯(Cross-Linked Polyethylene, XLPE)电力电缆凭借着自身优良的电气性能及力学性能,被广泛用于输配电网络中[1-2]。随着电缆服役时间的增长,在恶劣运行环境和自身质量欠佳的影响下,电缆线路的局部区域会产生缺陷,进一步发展可能会造成电缆线路故障,严重威胁电网的稳定运行。因此,研究电缆缺陷的诊断技术具有重要的意义[3-4]。
局部缺陷会使电缆线路中相应位置的特征参数产生变化,形成阻抗失配点,而行波会在该阻抗失配点位置产生携带缺陷信息的反射波。其中,反射波的传播长度可用于确定该阻抗失配点的位置,反射波的特征极性可用于确定该阻抗失配点的类型[5]。因此,行波反射法被广泛用于电缆的缺陷诊断领域,其主要分为时域反射法和频域反射法。时域反射法凭借技术简单、结果直观的特点,长期被用于电缆中击穿故障的定位[6-7]。该方法需要检测单极性脉冲在阻抗失配点处的反射信号,但是由于单极性脉冲中高频分量的能量较低,并且高频分量极易受到电缆中衰减效应与噪声干扰的影响,所以该方法难以诊断故障早期的微弱缺陷。频域反射法将特定频率区段的等功率扫频信号作为测试信号,测试信号的频率能量分布均匀,因此对微弱缺陷具备更强的检测效果,但是,该方法测试获取的宽频阻抗谱(Broadband Impedance Spectrum, BIS)或反射系数谱(Reflection Coefficient Spectrum, RCS)是频域数据,难以直接提取数据中缺陷的信息,因此必须选择合适的数学方法将测试数据变换为缺陷诊断函数,实现缺陷的特征信息提取[8-9]。
文献[10-11]利用积分变换方法分析BIS或RCS,成功获取了电缆的缺陷定位函数,但是该方法需要预先测量获取电缆的相关原始数据,导致该方法在实际工程运用上存在较大的局限性。文献[12-13]利用快速傅里叶变换算法分析BIS或RCS,提出新的缺陷定位函数,避免相关原始数据的影响,从而增强了频域反射法的通用性。但是由于快速傅里叶变换算法存在变换前后点数恒定的缺点,所以该方法中缺陷的距离分辨率会受到测试点数的限制,严重影响缺陷定位的精准度。文献[14-15]利用加Kaiser窗的离散傅里叶变换算法分析BIS或RCS,该方法减少了原有快速傅里叶变换算法中频谱泄露与栅栏效应的负面影响,提升了微弱缺陷的定位效果,但是该方法存在特征参数难确定、计算冗余度大的问题。现有的大部分频域反射技术仅关注缺陷的定位算法,但是未对缺陷类型等特征开展定性分析。文献[16-17]利用快速傅里叶逆变换算法将RCS变换为缺陷的时域特征波形,实现了缺陷的定位与反射波的特征极性诊断,但是该方法需要利用插值与随机赋值方法改写RCS的测试数据,降低了缺陷诊断结果的可靠性。文献[18]利用高斯窄带包络信号将RCS变换为缺陷的时频脉冲特征波形,并利用时频脉冲特征波形中主峰的极性判断缺陷的类型,避免了低频段数据需要随机赋值的问题。但是该方法中缺陷处时频脉冲特征波形存在多个干扰侧峰,且主峰会在电缆中色散效应的影响下产生偏移,所以可能存在将侧峰错选为主峰的情况,导致缺陷类型诊断结果错误。
针对上述传统方法存在的问题,本文提出了一种基于RCS的新型电缆缺陷诊断方法,该方法利用RCS数据构建新型电缆缺陷诊断函数,通过该函数可准确地定位电缆中的缺陷,并定性分析缺陷的类型。本文首先介绍了所提新型缺陷诊断函数的变换原理;然后通过设计典型的仿真电缆样本开展缺陷的诊断分析,论证了本文方法的可行性;最后对真实的同轴电缆与10 kV XLPE电力电缆进行缺陷诊断分析,说明了本文方法对电缆缺陷的定位精准度较高,并且对缺陷类型的诊断结果准确性较高。
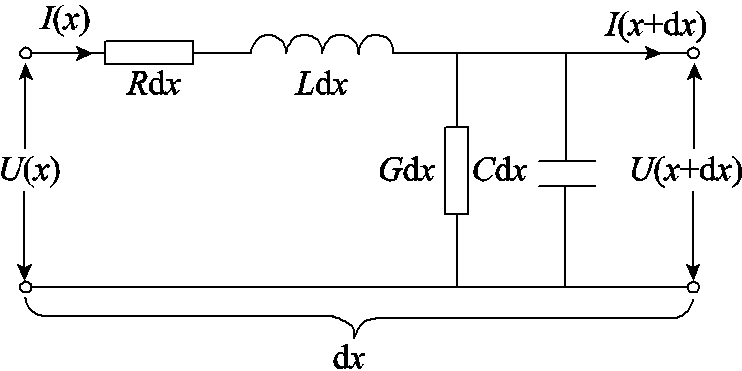
传输线理论[19-20]表明,当电缆线路中传输信号的频率较高时,传输信号的波长会远小于电缆线路的物理尺寸,必须采用分布参数模型分析电缆线路,其具体模型如图1所示。在图1的分布参数模型中,dx为电缆线路的单位长度,U(x)和I(x)分别为距首端x处的电压和电流,R、L、G、C分别为电缆线路中单位长度的电阻、电感、电导和电容。
图1 电缆线路的分布参数模型
Fig.1 Distributed parameter model of cable line
在电缆线路中距首端x处的反射系数Γ(x)被定义[20-21]为
 (1)
(1)
式中,l为电缆线路的总长;Zl为电缆线路末端的负载阻抗;γ和Z0分别为电缆线路本体的传播常数与特征阻抗,表示为
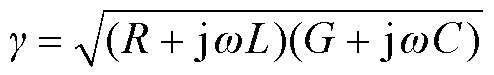 (2)
(2)
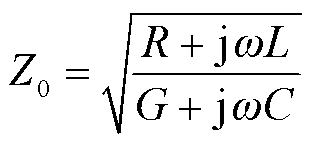 (3)
(3)
式中,ω为电缆线路中传输信号的角频率。
式(2)中γ也可以表示为
 (4)
(4)
式中,α和β分别为电缆线路的衰减常数与相位常数。
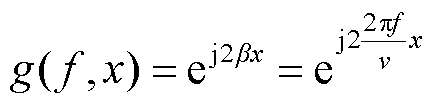
β可以表示为
 (5)
(5)
式中,f和v分别为电缆线路中传输信号的频率和速度。
当式(1)中x=0时,可获得电缆线路中首端处反射系数Γ(0)为
 (6)
(6)
同理可知,当电缆线路中距首端d处产生局部缺陷时,其首端处RCS会出现新的数据分量为
 (7)
(7)
式中,Zd为电缆线路中距首端d处局部缺陷的特征阻抗。
由式(7)可知, 的值与参数Γ(d)、d相关,所以可用来诊断电缆的局部缺陷。其中,利用与d的关联关系,可以确定局部缺陷的位置;而利用与Γ(d)的关联关系,可以定性地分析局部缺陷的类型等特征。
为解决传统方法中缺陷诊断函数存在的问题,本文构建基于RCS的新型缺陷诊断函数F(x)为
 (8)
(8)
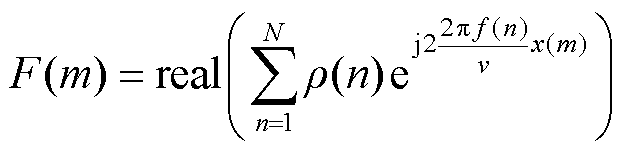
式中,real(·)表示取数据的实部;fmin和fmax分别为RCS的最低测试频率和最高测试频率;g(f, x)为缺陷诊断函数的核函数。
在电缆线路中距首端d处的局部缺陷位置产生反射波时,首端处RCS中会出现数据分量,通过选择合理的g(f, x),可以提取数据分量的特征信息,不仅可以定位电缆中的缺陷,而且可以定性分析缺陷的类型等特征信息。而real(·)的操作能将复数形式的RCS相关函数变换为实数数据,方便观察函数的波形特征。
本文将g(f, x)设置为
 (9)
(9)
结合欧拉公式可得
![]() (10)
(10)
令T(x, f)为F(x)的特征函数,将其定义为
对式(11)进行分析,当x≠l时,T(x)是频率为2|x-l|/v的余弦三角函数,基于余弦三角函数的周期性可知,此时F(x)的取值较小;而当x=l时,T(x)的频率为0,因此T(x)由原本的余弦三角函数变换成值恒为1的直线函数,此时F(x)的取值与x≠l时F(x)的取值明显不同,呈现为函数F(x)曲线的极值峰。考虑式(10)中的参数因子 >0,所以,F(x)中函数曲线的极值峰种类仅与Γ(l)相关,即F(x)中函数曲线的极值峰种类仅与电缆线路中末端处负载阻抗的变化特征相关。
当电缆线路末端的负载阻抗大于电缆线路的本体特征阻抗时,即Zl>Z0,可确定Γ(l)>0,电缆线路末端的反射系数大于0,F(x)会在电缆线路末端位置形成一个正极性的极值峰;反之,当电缆线路末端的负载阻抗小于电缆线路的本体特征阻抗时,F(x)会在电缆线路末端位置形成一个负极性的极值峰。
同理可知,对于某一缺陷形成的阻抗失配点而言,当该位置处特征阻抗大于电缆线路的本体特征阻抗时,F(x)会在缺陷位置形成一个正极性的极值峰;而当该位置处特征阻抗小于电缆线路的本体特征阻抗时,F(x)会在缺陷位置形成一个负极性的极值峰。因此,借助F(x)中极值峰的特征,可以有效定位电缆缺陷并定性分析缺陷的阻抗特征。
本文提出基于RCS的新型电缆缺陷诊断函数变换方法,其具体流程为:
(1)利用RCS测试平台对电缆线路进行测试,获取电缆线路的首端处RCS,确定测试结果中RCS的离散序列为ρ(n),对应频率的离散序列为f(n),其中,n=1, 2,…, N,N为RCS序列的数据总量。
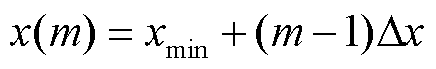
(2)根据电缆线路的长度确定距离x的离散数据序列为x(m),将x(m)定义为
 (12)
(12)
式中,xmin为分析距离的最小值,为减少测试夹具的遮蔽效应影响,通常可取0.1l;Δx为缺陷的距离分辨率,可根据测试效果确定;m为x(m)的序列数,m=1, 2,…, M,M为x(m)的数据总量,定义为
![]() (13)
(13)
式中,Floor(·)表示数据向下取整;xmax为分析距离的最大值,为保证缺陷分析结果的准确性,通常可取1.1l。需要说明的是,xmax与xmin也可以根据测试效果进行修正。
(3)建立核函数g(f, x)的离散形式G(n,m)为
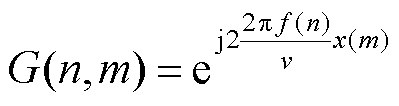 (14)
(14)
(4)建立新型电缆缺陷诊断函数F(x)的离散形式F(m)为
 (15)
(15)
(5)根据x(m)与F(m)构建新型缺陷诊断函数曲线,提取该曲线存在的极值峰,确定F(m)中极值峰对应的序列数为mp。
(6)定位电缆线路中缺陷,根据mp与数据序列x(m),确定x(mp)为电缆中缺陷距首端的距离。
(7)定性分析电缆线路中缺陷特征,根据mp与数据序列F(m),确定F(mp)的极值峰特征。当F(mp)的极值峰为正极性时,距离x(mp)的位置对应的是特征阻抗增大的缺陷;当F(mp)的极值峰为负极性时,距离x(mp)的位置对应的是特征阻抗减小的缺陷。
为了验证本文所提方法的有效性,搭建了如图2所示的仿真测试分析平台。仿真测试对象为10 kV XLPE电力电缆,电缆总长为250 m,测试频率区段为0.15~200 MHz,测试点数为3 998。
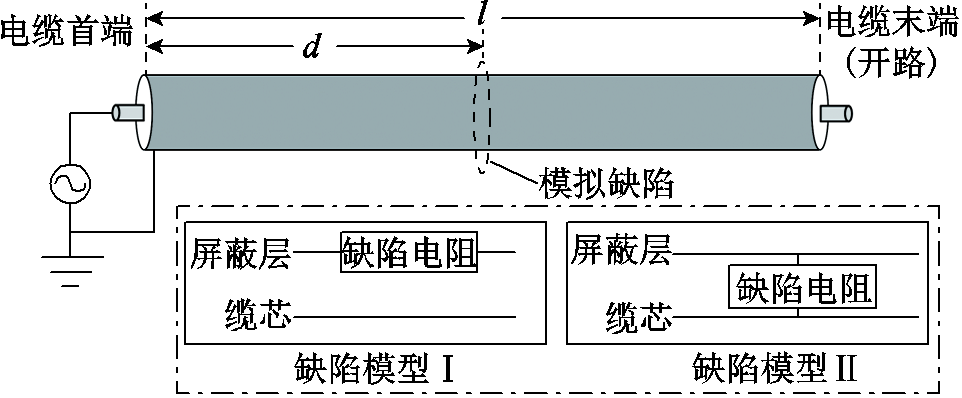
图2 仿真测试分析平台
Fig.2 Simulation test and analysis platform
本文在模拟缺陷位置建立了两种典型缺陷模型,分别为缺陷模型Ⅰ和缺陷模型Ⅱ,如图2所示。根据文献[22]的研究结果,缺陷模型Ⅰ指电缆的缆芯或屏蔽层产生缺陷,缺陷模型Ⅱ指电缆的绝缘层产生缺陷。缺陷模型Ⅰ中缺陷位置处缆芯或屏蔽层的电阻值大于缆芯或屏蔽层的正常电阻值,当该缺陷电阻值趋于无穷大时,该缺陷发展为开路故障;缺陷模型Ⅱ中缺陷位置处绝缘层的电阻值小于绝缘层的正常电阻值,当该缺陷电阻值趋于0时,该缺陷发展为短路故障。
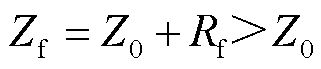
(1)缺陷模型Ⅰ的阻抗变化特征。当缺陷处电缆的缆芯或屏蔽层串联缺陷电阻Rf时,确定相应位置的阻抗Zf为
 (16)
(16)
由式(16)可知,在缺陷模型Ⅰ中,当电缆的缆芯或屏蔽层串联缺陷电阻Rf以模拟缆芯或屏蔽层的破损时(由于缆芯串联缺陷电阻和屏蔽层串联缺陷电阻的原理相似,因此本文仅研究了屏蔽层串联缺陷电阻的模型),缺陷处电缆的特征阻抗一定会增加,且缺陷的严重程度和缺陷电阻的阻值大小成正比。
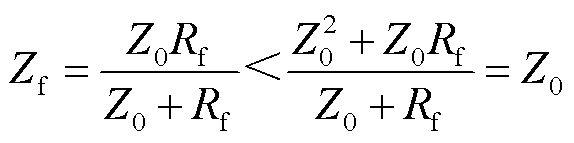
(2)缺陷模型Ⅱ的阻抗变化特征。当缺陷处电缆的缆芯与屏蔽层并联缺陷电阻Rf时,确定相应位置的阻抗Zf为
 (17)
(17)
由式(17)可知,在缺陷模型Ⅱ中,当电缆的缆芯与屏蔽层并联缺陷电阻Rf用来模拟绝缘层的绝缘性能下降时,缺陷处电缆的特征阻抗一定会减小,且缺陷的严重程度和缺陷电阻的阻值大小成反比。
本仿真实验将特定频率区段的正弦信号作为测试信号,并将该测试信号作为入射信号注入到图2中电缆模型的首端,该入射信号会在缺陷形成的阻抗失配点产生反射现象。通过测量反射信号,并与入射信号进行对比,可以获取电缆的首端处RCS。
首先分别按照表1中的参数设计仿真电缆样本,并获取各仿真电缆样本的首端处RCS;然后采用本文所提方法分析该RCS,得到不同仿真电缆样本的缺陷诊断函数如图3所示。
表1 仿真电缆样本的参数
Tab.1 Parameters of simulated cable samples

编号缺陷模型种类缺陷电阻值/Ω缺陷位置/m 1缺陷模型Ⅰ60200 2缺陷模型Ⅰ120200 3缺陷模型Ⅱ60200 4缺陷模型Ⅱ120200
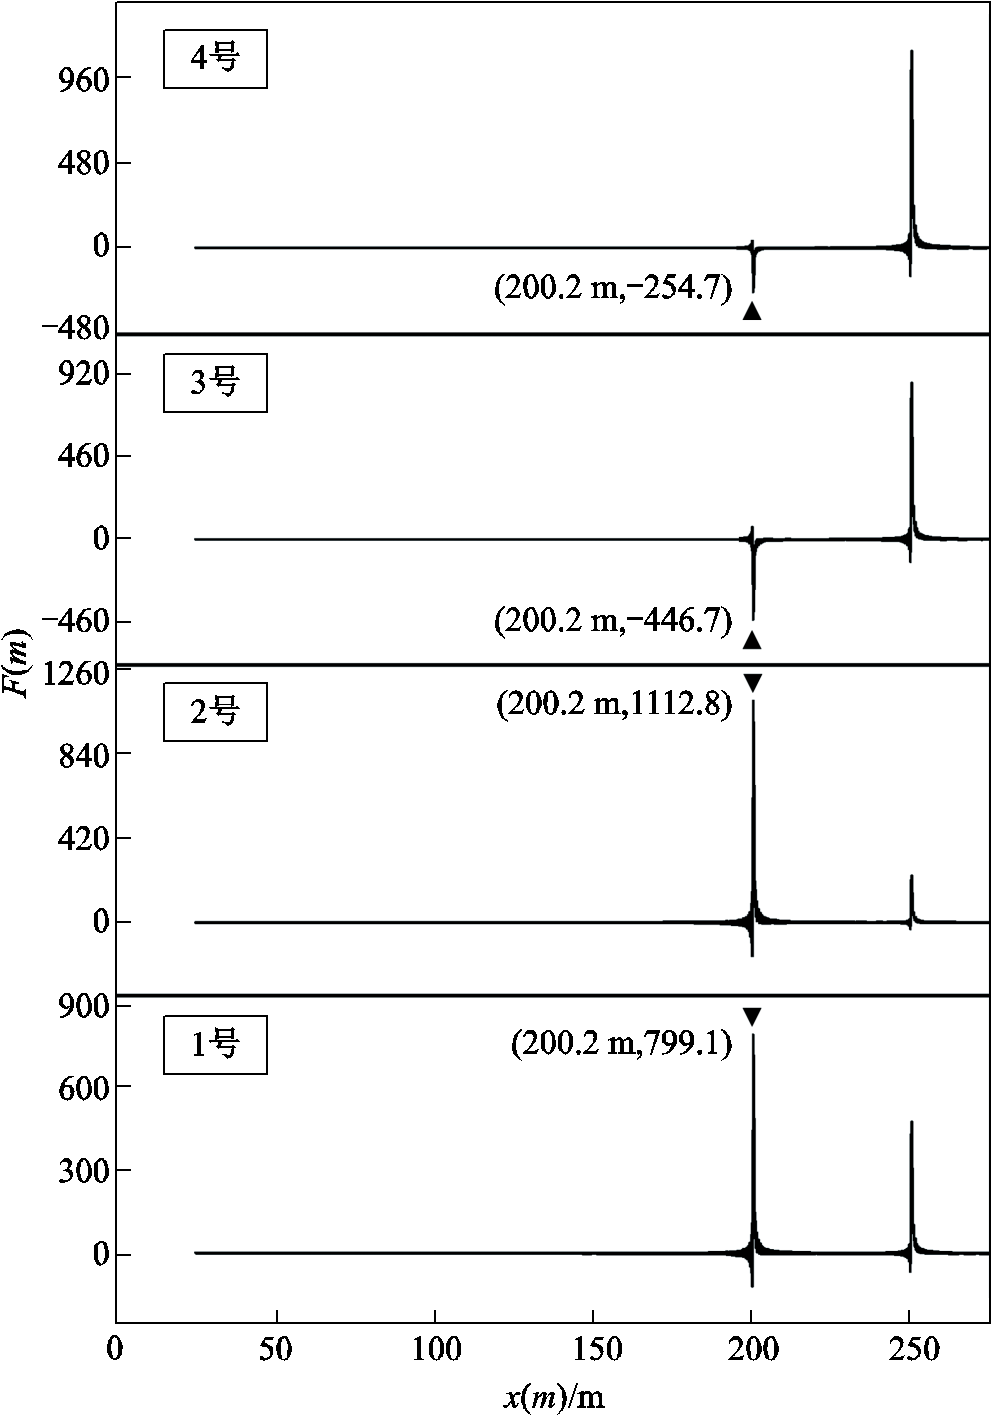
图3 仿真电缆样本的缺陷诊断函数
Fig.3 Defect diagnosis functions of simulated cable samples
(1)通过检测图3中F(m)极值峰的横坐标,可以得到1~4号仿真电缆样本的缺陷距离定位误差均为0.2 m(0.1%),实现了电缆缺陷的精准定位。
(2)本文方法通过识别缺陷位置处的F(m)可定性分析缺陷类型。在1号、2号仿真电缆样本的缺陷诊断函数中,缺陷处F(m)的极值峰极性均为正,可确定1号、2号仿真电缆样本存在特征阻抗增大的缺陷,与缺陷模型Ⅰ的实际情况一致;在3号、4号仿真电缆样本的缺陷诊断函数中,缺陷处F(m)的极值峰极性均为负,可确定3号、4号仿真电缆样本存在特征阻抗减小的缺陷,与缺陷模型Ⅱ的实际情况一致。
(3)对比图3中1号、2号仿真电缆样本的缺陷诊断函数,由于在缺陷模型Ⅰ中,当缺陷位置处串联缺陷电阻的值由60 Ω变为120 Ω时,等效于缺陷位置处缺陷的严重程度变高,信号在缺陷位置处反射信号的能量变强,所以2号仿真电缆样本中缺陷处F(m)的幅值绝对值1 112.8大于1号仿真电缆样本中缺陷处F(m)的幅值绝对值799.1。因此,对于缺陷模型Ⅰ而言,可以利用F(m)在缺陷处的幅值绝对值判定缺陷的严重程度。
(4)对比图3中3号、4号仿真电缆样本的缺陷诊断函数,在缺陷模型Ⅱ中,当缺陷位置处并联缺陷电阻的值由60 Ω变为120 Ω时,等效于缺陷位置处缺陷的严重程度变低,信号在缺陷位置处反射信号的能量变弱,所以4号仿真电缆样本中缺陷处F(m)的幅值绝对值254.7小于3号仿真电缆样本中缺陷处F(m)的幅值绝对值446.7。因此,对于缺陷模型Ⅱ而言,同样可以利用F(m)在缺陷处的幅值绝对值判定缺陷的严重程度。
(5)由图3中1~4号仿真电缆样本的缺陷诊断函数可知,本文方法一方面可以根据测试效果任意选定缺陷诊断函数的距离分辨率Δx,避免了文献[12-13]方法中快速傅里叶变换算法的距离分辨率受测试点数限制的问题,可获得更高的缺陷定位精准度;另一方面,本文方法中缺陷诊断函数在缺陷处仅存在一个极值峰,不存在文献[19]方法中时频脉冲特征波形的侧峰干扰,因此可以获得更准确的缺陷类型诊断结果。
为实际开展本文方法的电缆缺陷检测研究,搭建了如图4所示的RCS测试平台。其中,主控计算机根据设定的测试频率区段与测试点数,控制信号发生模块生成特定参数的扫频信号。生成的扫频信号通过功分器后被平分为两部分,一部分被数据收集模块记录作为参考信号,另一部分经由耦合器进入测试电缆样本作为入射信号。入射信号在测试电缆样本中缺陷处产生反射信号,反射信号则经由耦合器被数据收集模块记录。数据收集模块通过分析反射信号与参考信号,可以确定测试电缆样本的RCS,并将其上传至主控计算机,实现电缆样本的RCS测试。
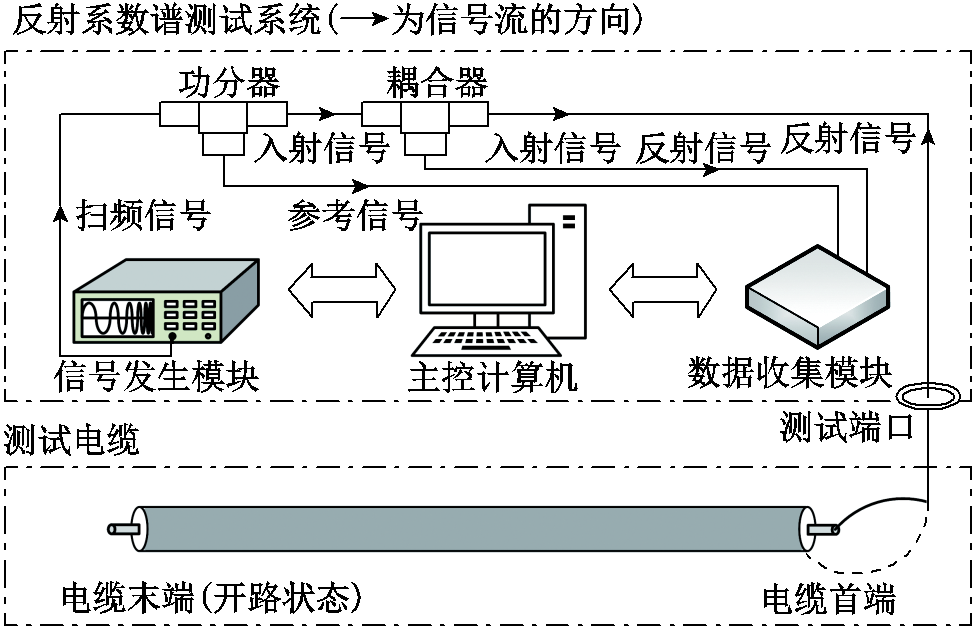
图4 RCS测试平台示意图
Fig.4 Schematic diagram of RCS test platform
实验对象采用40 m的SYV50-5-1通信同轴电缆与105 m的10 kV XLPE电力电缆。利用同轴电缆制作含缺陷的1~3号真实电缆样本,缺陷的位置均为距首端20 m。对于1号真实电缆样本而言,缺陷位置处屏蔽层串联20 Ω的缺陷电阻,与缺陷模型Ⅰ保持一致;对于2号、3号真实电缆样本而言,缺陷位置处缆芯与屏蔽层之间分别并联20 Ω和82 Ω的缺陷电阻,与缺陷模型Ⅱ保持一致。
在10 kV XLPE电力电缆上,利用饱和食盐水对局部区域的铜屏蔽层进行浸泡,腐蚀该区域的铜屏蔽层并生成铜绿,增大该局部区域中铜屏蔽层的电阻,缺陷位置为距首端43 m,从而得到4号真实电缆样本。由于4号真实电缆样本的缺陷情况是电缆的屏蔽层产生缺陷,所以4号真实电缆样本与缺陷模型Ⅰ一致。
考虑同轴电缆中高频信号的衰减效应更弱[21],因此本文令1~3号真实电缆样本对应RCS的测试频率区段为5 Hz~500 MHz,测试点数为1 601;同时令4号真实电缆样本对应RCS的测试频率区段为0.15~40 MHz,测试点数为500。利用本文方法对测试获取的RCS进行变换,分别得到1~4号真实电缆样本的缺陷诊断函数如图5和图6所示。根据该缺陷诊断函数的极值峰,可以推断出1~4号真实电缆样本的缺陷位置与类型见表2。
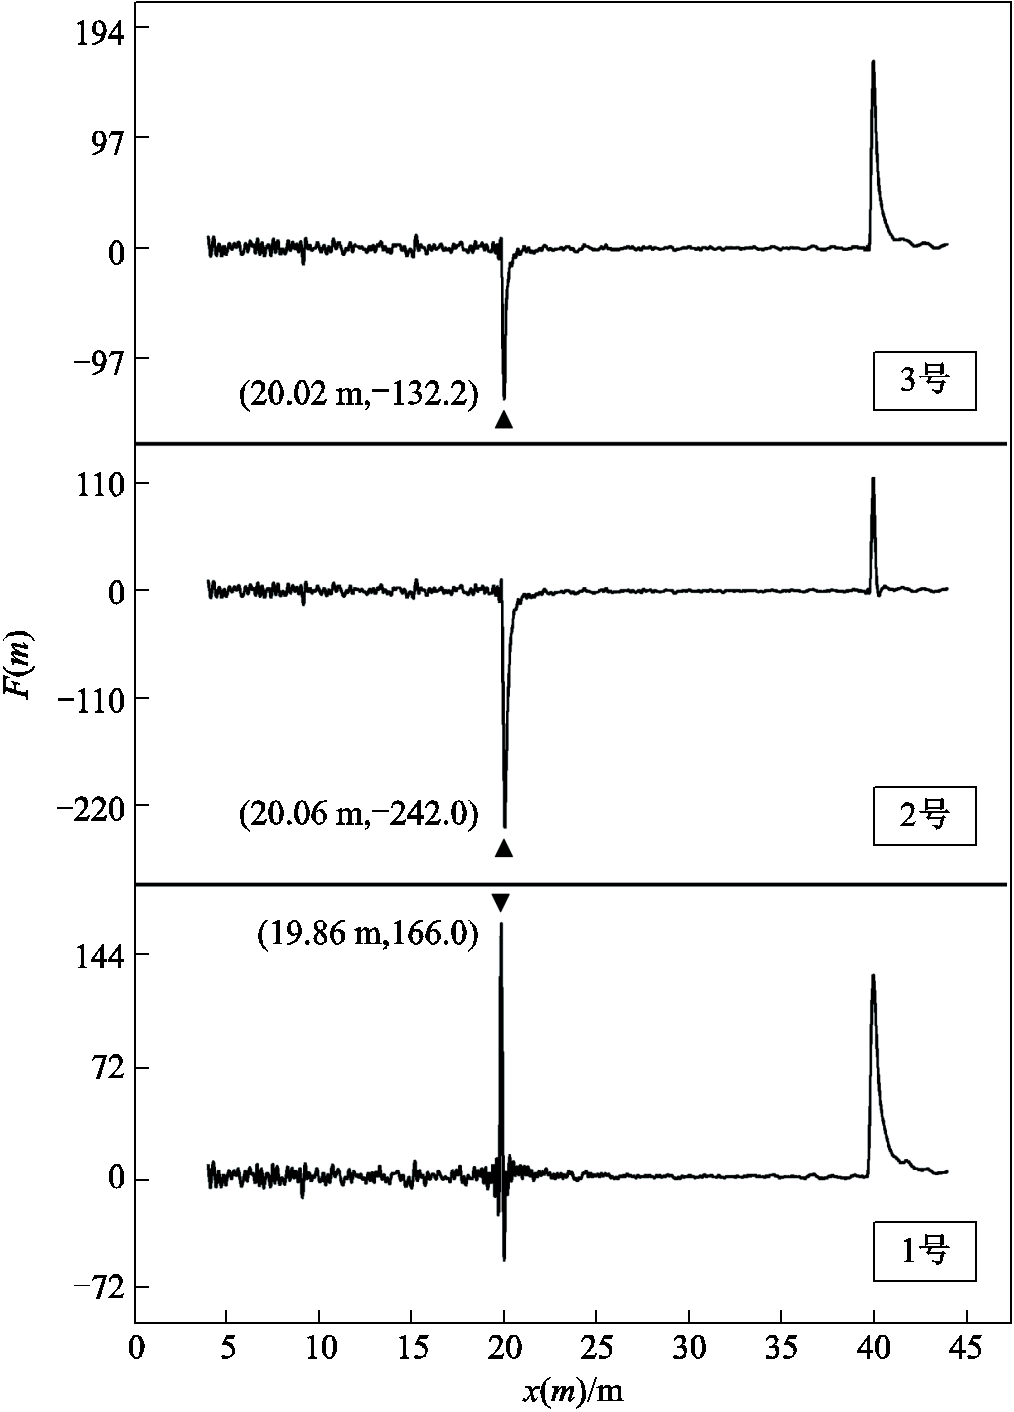
图5 真实同轴电缆样本的缺陷诊断函数
Fig.5 Defect diagnosis functions of real coaxial cable samples
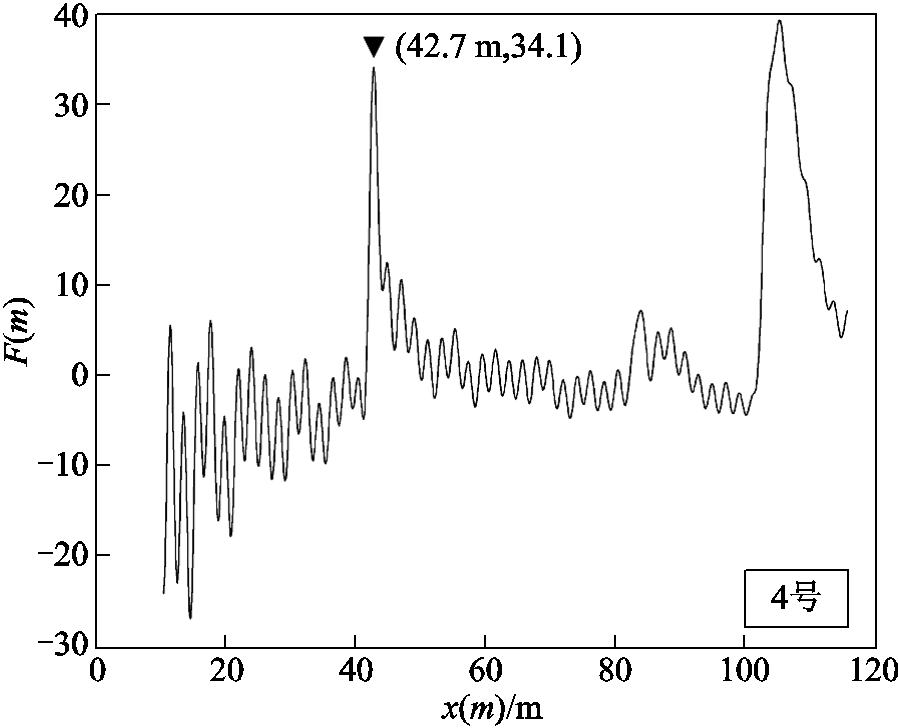
图6 真实电力电缆样本的缺陷诊断函数
Fig.6 Defect diagnosis function of real power cable sample
从表2中可以看出,对于同轴电缆对应的1~3号真实电缆样本而言,在缺陷定位结果方面,本文方法中缺陷定位结果的最大误差为0.14 m(0.7%);在缺陷类型辨识结果方面,本文方法准确地判断出1号真实电缆样本存在特征阻抗增大类型的缺陷,同时推断出2号、3号真实电缆样本存在特征阻抗减小类型的缺陷,该缺陷类型诊断结果与实际情况一致,说明本文方法可以准确检测电缆缺陷的位置与类型。
表2 真实电缆样本的缺陷分析结果
Tab.2 Defect analysis results of real cable samples
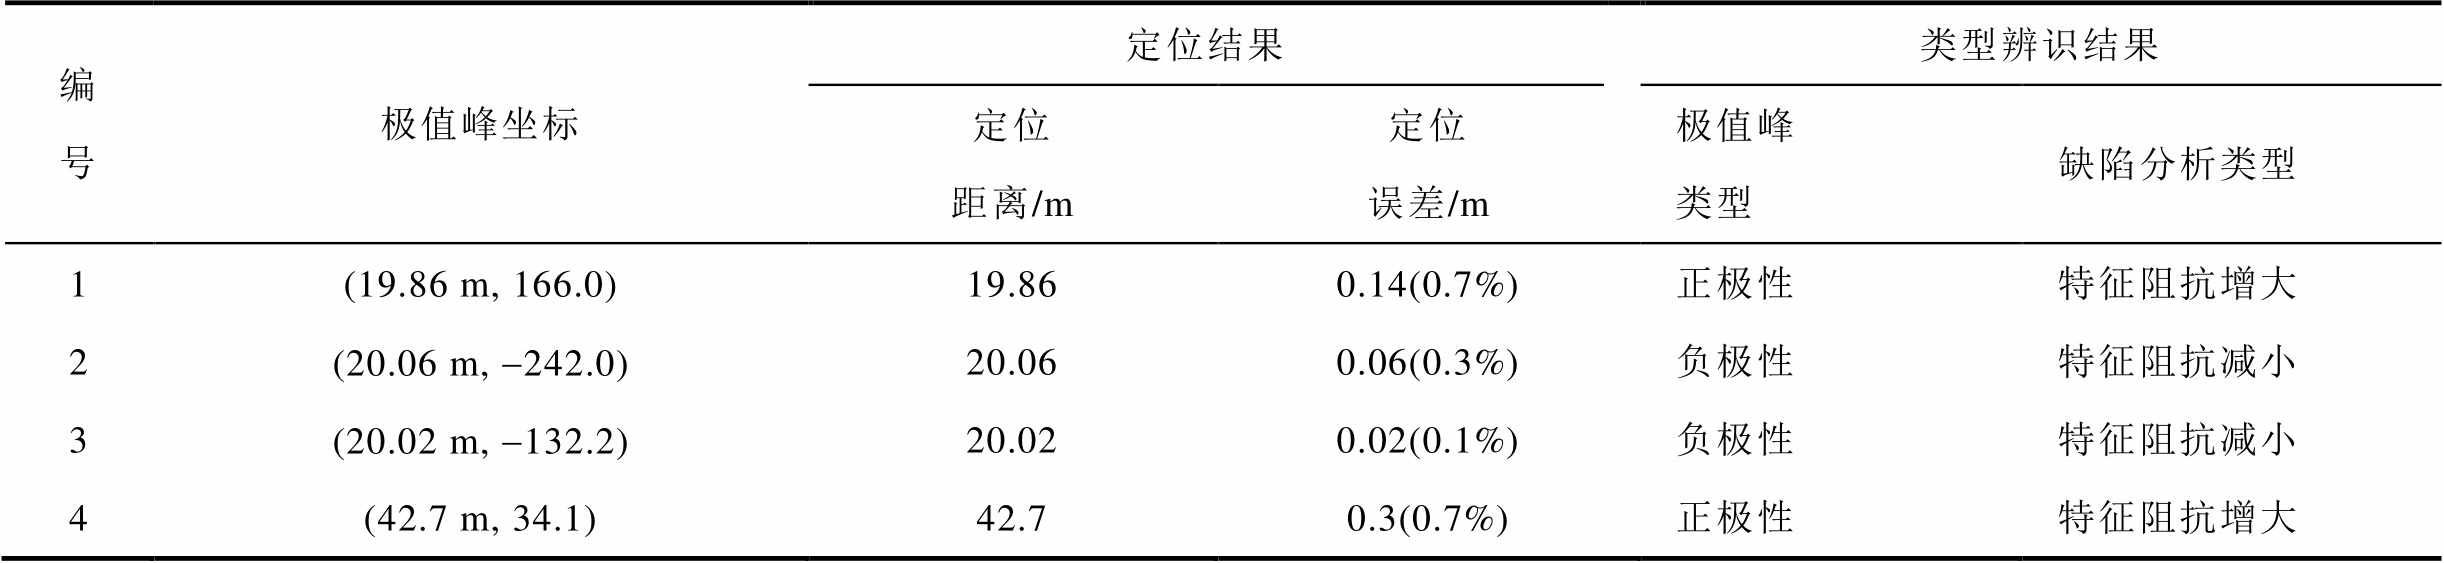
编号极值峰坐标定位结果类型辨识结果 定位距离/m定位误差/m极值峰类型缺陷分析类型 1(19.86 m, 166.0)19.860.14(0.7%)正极性特征阻抗增大 2(20.06 m, -242.0)20.060.06(0.3%)负极性特征阻抗减小 3(20.02 m, -132.2)20.020.02(0.1%)负极性特征阻抗减小 4(42.7 m, 34.1)42.70.3(0.7%)正极性特征阻抗增大
2号、3号真实电缆样本均属于缺陷模型Ⅱ,对比2号真实电缆样本与3号真实电缆样本的极值峰坐标可以看出,2号真实电缆样本的极值峰F(mp)绝对值242.0大于3号真实电缆样本的极值峰F(mp)绝对值132.2。该结果说明2号真实电缆样本中缺陷的严重程度更高,与2号真实电缆样本中缺陷电阻值更小的真实情况一致,说明本文方法可对真实电缆中缺陷的严重程度进行判断。
对于XLPE电力电缆对应的4号真实电缆样本而言,在缺陷定位结果方面,本文方法的缺陷定位误差为0.3 m(0.7%),说明本文方法可有效地定位真实电力电缆中缺陷,并且缺陷的定位精度较高;在缺陷类型辨识结果方面,本文方法判断4号真实电缆样本存在特征阻抗增大类型的缺陷,该缺陷与屏蔽层受损的实际缺陷情况一致,说明本文方法可有效地检测真实电力电缆的缺陷类型。
针对现有的频域反射法在工程应用中存在定位结果可靠性低、无法定性分析缺陷类型等问题,本文提出一种基于RCS变换的新型缺陷诊断方法。通过对仿真电缆样本与真实电缆样本的缺陷诊断,证明了该方法的有效性,具体结论如下:
1)该方法中缺陷诊断函数的极值峰可用于推断电缆中缺陷的位置与类型,其中极值峰的横坐标x(mp)是电缆中缺陷距首端的距离,纵坐标F(mp)的符号决定缺陷的类型,当F(mp)为正时,确定该缺陷类型为特征阻抗增大;当F(mp)为负时,确定该缺陷类型为特征阻抗减小。
2)缆芯或屏蔽层的受损缺陷会导致该位置处电缆的特征阻抗值大于电缆的本体特征阻抗,本文中新型缺陷诊断函数会在该位置形成正极性的极值峰;绝缘层的受损缺陷会导致该位置处电缆的特征阻抗值小于电缆的本体特征阻抗,本文中新型缺陷诊断函数会在该位置形成负极性的极值峰。
3)在该方法的缺陷诊断函数中,缺陷对应极值峰的绝对值与缺陷的严重程度相关,当缺陷的严重程度更高时,极值峰对应的绝对值会更大。
4)仿真与实测结果表明,本文方法不仅能准确地定位电缆中的缺陷,而且能对电缆缺陷的类型、严重程度等特征进行识别。
参考文献
[1] 李国倡, 梁箫剑, 魏艳慧, 等. 配电电缆附件复合绝缘界面缺陷类型和位置对电场分布的影响研究[J]. 电工技术学报, 2022, 37(11): 2707-2715. Li Guochang, Liang Xiaojian, Wei Yanhui, et al. Influence of composite insulation interface defect types and position on electric field distribution of distribution cable accessories[J]. Transactions of China Electrotechnical Society, 2022, 37(11): 2707-2715.
[2] 饶显杰, 周凯, 谢敏, 等. 稳定图法在极化等效电路参数辨识中的应用[J]. 电工技术学报, 2020, 35(10): 2248-2256. Rao Xianjie, Zhou Kai, Xie Min, et al. Application of stabilization diagram method for solving polarization equivalent circuit parameters[J]. Transactions of China Electrotechnical Society, 2020, 35(10): 2248-2256.
[3] 王昊月, 李成榕, 王伟, 等. 高压频域介电谱诊断XLPE电缆局部绝缘老化缺陷的研究[J]. 电工技术学报, 2022, 37(6): 1542-1553. Wang Haoyue, Li Chengrong, Wang Wei, et al. Local aging diagnosis of XLPE cables using high voltage frequency domain dielectric spectroscopy[J]. Tran-sactions of China Electrotechnical Society, 2022, 37(6): 1542-1553.
[4] 饶显杰, 周凯, 黄永禄, 等. 考虑相速度频变特性的改进相位差算法局部放电定位[J]. 电工技术学报, 2021, 36(20): 4379-4388. Rao Xianjie, Zhou Kai, Huang Yonglu, et al. Partial discharge location using improved phase difference method considering frequency-dependent characteristic of phase velocity[J]. Transactions of China Electro-technical Society, 2021, 36(20): 4379-4388.
[5] 单秉亮, 李舒宁, 杨霄, 等. XLPE配电电缆缺陷诊断与定位技术面临的关键问题[J]. 电工技术学报, 2021, 36(22): 4809-4819. Shan Bingliang, Li Shuning, Yang Xiao, et al. Key problems faced by defect diagnosis and location technologies for XLPE distribution cables[J]. Transactions of China Electrotechnical Society, 2021, 36(22): 4809-4819.
[6] 梁栋, 徐丙垠, 谢伟, 等. 基于小波脉冲相关的电缆故障时域反射测距方法[J]. 中国电机工程学报, 2020, 40(24): 8050-8057, 8241. Liang Dong, Xu Bingyin, Xie Wei, et al. A time-domain-reflectometry cable fault location method using wavelet pulses and cross-correlation[J]. Proceedings of the CSEE, 2020, 40(24): 8050-8057, 8241.
[7] 任志刚, 赵雪骞, 郭卫, 等. 基于时域反射技术的电缆渗水缺陷检测方法[J]. 绝缘材料, 2022, 55(1): 80-86. Ren Zhigang, Zhao Xueqian, Guo Wei, et al. Detecting method of cable with water seepage defect based on time domain reflection technology[J]. Insulating Materials, 2022, 55(1): 80-86.
[8] Ohki Y, Yamada T, Hirai N. Precise location of the excessive temperature points in polymer insulated cables[J]. IEEE Transactions on Dielectrics and Electrical Insulation, 2013, 20(6): 2099-2106.
[9] Zhou Zhiqiang, Zhang Dandan, He Junjia, et al. Local degradation diagnosis for cable insulation based on broadband impedance spectroscopy[J]. IEEE Tran-sactions on Dielectrics and Electrical Insulation, 2015, 22(4): 2097-2107.
[10] 周志强. 基于宽频阻抗谱的电缆局部缺陷诊断方法研究[D]. 武汉: 华中科技大学, 2015. Zhou Zhiqiang. Local defects diagnosis of cable based on broadband impedance spectroscopy[D]. Wuhan: Huazhong University of Science and Technology, 2015.
[11] 赵洪山, 孙京杰, 许向东. 基于反射系数谱积分的电缆缺陷诊断方法[J]. 电网技术, 2022, 46(11): 4548-4556. Zhao Hongshan, Sun Jingjie, Xu Xiangdong. Diagnosis of local defects in cables based on integral reflection coefficient spectrum[J]. Power System Tech-nology, 2022, 46(11): 4548-4556.
[12] Shi Qinghai, Kanoun O. Wire fault diagnosis in the frequency domain by impedance spectroscopy[J]. IEEE Transactions on Instrumentation and Mea-surement, 2015, 64(8): 2179-2187.
[13] Ohki Y, Yamada T, Hirai N. Diagnosis of cable aging by broadband impedance spectroscopy[C]//2011 Annual Report Conference on Electrical Insulation and Dielectric Phenomena, Cancun, Mexico, 2011: 24-27.
[14] 谢敏, 周凯, 赵世林, 等. 新型基于反射系数谱的电力电缆局部缺陷定位方法[J]. 电网技术, 2017, 41(9): 3083-3089. Xie Min, Zhou Kai, Zhao Shilin, et al. A new location method of local defects in power cables based on reflection coefficient spectrum[J]. Power System Technology, 2017, 41(9): 3083-3089.
[15] 李蓉, 周凯, 万航, 等. 基于输入阻抗谱的电力电缆本体局部缺陷类型识别及定位[J]. 电工技术学报, 2021, 36(8): 1743-1751. Li Rong, Zhou Kai, Wan Hang, et al. Identification and location of local defects in power cable body based on input impedance spectroscopy[J]. Tran-sactions of China Electrotechnical Society, 2021, 36(8): 1743-1751.
[16] 饶显杰, 周凯, 谢敏, 等. 基于频域反射法的特征时域波形恢复技术[J]. 高电压技术, 2021, 47(4): 1420-1427. Rao Xianjie, Zhou Kai, Xie Min, et al. Recovery technique of characteristic time domain waveform based on frequency domain reflection method[J]. High Voltage Engineering, 2021, 47(4): 1420-1427.
[17] Zhu Guangya, Liu Zhaogui, Zhou Kai, et al. A novel dampness diagnosis method for distribution power cables based on time-frequency domain conversion[J]. IEEE Transactions on Instrumentation and Measurement, 2022, 71: 1-9.
[18] 周凯, 黄靖涛, 孟鹏飞, 等. 基于FDR和时频脉冲转换的长电缆缺陷极性识别研究[J]. 中国电机工程学报, 2023, 43(13): 5271-5281. Zhou Kai, Huang Jingtao, Meng Pengfei, et al. Research on defect polarity identification of long cable based on FDR and time-frequency pulse conversion[J]. Proceedings of the CSEE, 2023, 43(13): 5271-5281.
[19] 金鑫, 肖勇, 曾勇刚, 等. 低压电力线宽带载波通信信道建模及误差补偿[J]. 中国电机工程学报, 2020, 40(9): 2800-2809. Jin Xin, Xiao Yong, Zeng Yonggang, et al. Modeling and error compensation for low-voltage broadband power line communications[J]. Proceedings of the CSEE, 2020, 40(9): 2800-2809.
[20] Kwon G Y, Lee C K, Lee G S, et al. Offline fault localization technique on HVDC submarine cable via time-frequency domain reflectometry[J]. IEEE Transactions on Power Delivery, 2017, 32(3): 1626-1635.
[21] 饶显杰, 徐忠林, 陈勃, 等. 基于频域反射的电缆缺陷定位优化方法[J]. 电网技术, 2022, 46(9): 3681-3689. Rao Xianjie, Xu Zhonglin, Chen Bo, et al. Cable defect location optimization based on frequency domain reflection[J]. Power System Technology, 2022, 46(9): 3681-3689.
[22] 尹振东, 王莉, 陈洪圳, 等. 增广时频域反射法在电缆复合故障检测中的应用[J]. 中国电机工程学报, 2020, 40(23): 7760-7773. Yin Zhendong, Wang Li, Chen Hongzhen, et al. Application of augmented time frequency domain reflectometry in detection of complex cable faults[J]. Proceedings of the CSEE, 2020, 40(23): 7760-7773.
Abstract In recent years, as its excellent mechanical and electrical properties, cross-linked polyethylene (XLPE) power cable is widely used in the construction of the urban power system. With the increase in service time, various cable local defects often occur due to the hostile operating environment and poor product quality. The long-term development of the defect may cause a cable insulation failure, which seriously threatens the stability of the urban power transmission and distribution system. Therefore, it is of great significance to accurately diagnose cable local defects as early as possible. Recently, by using the broadband impedance spectrum (BIS) and reflection coefficient spectrum (RCS), a series of cable defect location methods based on frequency domain reflectometry has been proposed. However, the existing methods have some problems in engineering applications, such as low reliability of the positioning result and the inability to determine defect type. To solve the above problems, this paper presents a new cable defect diagnosis method based on RCS. By establishing the defect diagnosis function based on RCS and kernel function construction, it can accurately obtain the characteristics of the defect, such as location, type and severity.
Firstly, based on distributed parameter model of the cable line, the RCS mathematical model of the cable line with the local defect is established. The RCS is closely related to the position and characteristic impedance of the local defect, so it can be used to determine the characteristics of the local defect. Then, according to the mathematical model of RCS, a reasonable kernel function is designed in this paper, and a new defect diagnosis function based on RCS is obtained. By the periodicity of the trigonometric function, the proposed defect diagnosis function can form a peak at the position of the defect. Finally, the peak can be used to determine the characteristics of the defect, such as location, type and severity. When the characteristic impedance of the defect is greater than that of normal cable, the corresponding peak is positive polarity. On the contrary, when the characteristic impedance of the defect is smaller than that of normal cable, the corresponding peak is negative polarity.
In this paper, two classic cable defect models are established. In the defect model Ⅰ, there is series defect-resistance in the cable core or shielding layer to simulate the damage defect of the cable core or shielding layer, leading to the increase of characteristic impedance. In addition, the higher the defect-resistance value, the more serious the defect. In the defect model Ⅱ, there is parallel defect-resistance between the cable core and shielding layer to simulate the damage defect of cable insulation, leading to the decrease of characteristic impedance. At the same time, the lower the defect-resistance value, the more serious the defect. In the simulation process, four simulated 250 m 10 kV XLPE power cable samples are built, and all the defects are located at 200m. The types of No.1~4 simulated cable samples are the defect model Ⅰ, Ⅰ, Ⅱ and Ⅱ, respectively. While the defect-resistance values are 60 Ω, 120 Ω, 60 Ω and 120 Ω, respectively. Simulation results show: (1) The defect positioning errors in all simulated cable samples are 0.2m (0.1%), which proves that the proposed method can accurately locate the defect. (2) In the defect diagnosis functions of No.1, No.2 simulated cable samples, the peaks at the defect are positive polarity. However, for No.3, No.4 simulated cable samples, the peaks at the defect are negative polarity. As a result, the polarity of the peak can be used to determine the type of defect. (3) As the peak absolute values of No.1~No.4 simulated cable samples are 799.1, 1 112.8, 446.7 and 254.7, respectively. The peak absolute value of the No.2 simulated cable sample is greater than that of the 1# simulated cable sample. On the other hand, the peak absolute value of the No.4 simulated cable sample is smaller than that of the No.3 simulated cable sample. So the peak absolute value can be employed to assess the severity of the defect.
In the measurement process, the experimental subjects are 40 m SYV50-5-1 communication coaxial cable and 105 m 10 kV XLPE power cable. The No.1~No.3 measured cable samples are the communication coaxial cable, while the No.4 measured cable sample is the XLPE power cable. As same as the simulation results, the proposed defect diagnosis function can accurately locate the defect, in which the maximum positioning error is only 0.7%. At the same time, the type and severity of the defect can be determined from the defect diagnosis function.
The conclusions of this article are summarized as follows: (1) The peak of the defect diagnosis function can be used to obtain the location and type of the defect. For the peak of the defect diagnosis function, the abscissa value is the position of the defect, and the sign (positive or negative) of ordinate value is used to determine the type of defect, in which the positive sign and negative sign correspond to defects with increase and decrease of characteristic impedance, respectively. (2) The damage to the cable core or shielding layer causes the increase of the characteristic impedance at the defect, and the proposed defect diagnosis function forms a positive peak. The damage to the cable insulation causes the decrease of the characteristic impedance at the defect, and the proposed defect diagnosis function forms a negative peak. (3) In the proposed defect diagnosis function, the peak absolute value is related to the severity of the defect. The higher the absolute value, the more serious the defect. (4) The simulation and measurement results show that the proposed method can not only accurately locate the defect in the cable, but also determines the type and severity of the defect.
keywords: Cable line, local defect, reflection coefficient spectrum, defect location, defect analysis
DOI:10.19595/j.cnki.1000-6753.tces.230085
中图分类号:TM41
国家自然科学基金资助项目(51877142)。
收稿日期 2023-01-18
改稿日期 2023-03-01
饶显杰 男,1996年生,硕士,研究方向为电力设备绝缘状态监测。 E-mail:1953520244@qq.com
周 凯 男,1975年生,教授,博士生导师,研究方向为电缆绝缘状态检测与修复等。E-mail:zhoukai_scu@163.com(通信作者)
(编辑 李 冰)