 (1)
(1)
摘要 随着新能源的大规模广泛并网,其对感应电动机动态等值建模的影响值得关注。该文提出了新能源电力系统中感应电动机动态分群新方法。分析了感应电动机与电网的交互作用,提出在现有基于感应电动机动态相似性分群的基础上,同时考虑机端电压动态相似性的分群可提高感应电动机动态等值精度。针对高比例新能源电力系统,研究发现感应电动机附近有新能源机组,且部分新能源机组在故障期间进入低电压穿越(LVRT)时,这些感应电动机动态特性具有显著差异。为此提出新能源电力系统中考虑感应电动机端口电压跌落深度的动态分群方法。算例分析表明,该文提出的兼顾感应电动机端口电压动态相似性以及端口电压跌落深度的分群方法具有较高的等值精度,且适应性强。
关键词:感应电动机 动态等值 新能源电力系统 动态相似性 低电压穿越
负荷是影响电力系统动态特性的关键设备之一,准确的负荷模型是电力系统仿真分析的基础[1-2]。电力负荷中感应电动机负荷用电量占比60%以上,工业负荷中感应电动机占比甚至达到了90%以上[3-6],因此感应电动机动态等值是配电网综合负荷等值建模的重要内容。
目前在进行电力系统动态等值时,常用做法是将负荷合并到等值母线上,不考虑负荷动态特性的差异性。为提高电力系统动态等值精度,在进行同步发电机动态等值时,也有研究对感应电动机负荷进行等值建模。等值方法包括单机等值[7-8]和多机等值[9]两类,还有研究涉及综合负荷等值建模时感应电动机的等值建模[10-11]。被等值对象既包括相同母线上多类型感应电动机,也包括电网中分布于不同位置的感应电动机。
多机等值是目前感应电动机动态等值的常用方法,而分群是感应电动机多机等值的前提。常用的分群指标包括感应电动机的电气参数[12-13]、感应电动机状态方程的特征值[14],以及感应电动机的关键特征量[15-16]等。如文献[12]提出将转动惯量和转子电阻的乘积作为分群指标;文献[13]提出以感应电动机的电气参数及其电气距离作为分群指标。特征根能够反映感应电动机在运行点附近的动态特性,常根据特征根距离进行感应电动机分群。如文献[14]以感应电动机3阶实用线性化模型为基础,将特征值距离作为分群指标。在特征量的分群方面,文献[15]提出由感应电动机机电方程中的时间常数等系数与初始转差组成特征向量,采用模糊聚类方法进行感应电动机的分群;文献[16]提出以临界电压和临界转差率构造分群指标。
从上述文献可以看出,目前感应电动机的分群方法基本上基于转子运动方程,根据关键参数或者特征根来分群。由于电力系统本身是非线性系统,基于特征参数或特征根的分群不能反映大扰动下的动态行为,同时未能完全计及系统侧动态的影响。由于电力系统通过感应电动机的并网电压影响其动态行为,为此本文提出同时计及端口电压动态相似性的感应电动机分群方法。
随着新能源并网比例和规模的不断增加,高比例新能源是现代大电网的主要特征。由于新能源机组的控制存在限幅、切换等本质非线性环节[17-18],其运行状态的切换将影响近区感应电动机的动态特性,因此当感应电动机近区有大量新能源机组时,需考虑新能源与感应电动机的动态交互作用。目前新能源对感应电动机等值建模的影响研究还鲜见报道。为此,本文以含高比例光伏电源的电力系统(文中方法同样适用于含高比例风电电源的电力系统)为研究对象,首先分析了感应电动机动态分群时计及机端电压动态特性的必要性;然后分析了光伏电源对感应电动机动态等值的影响,指出高比例新能源电力系统中,计及端口电压跌落深度的影响将有助于提高感应电动机等值建模的精度;最后通过仿真算例验证了本文分群方法的可行性和先进性。
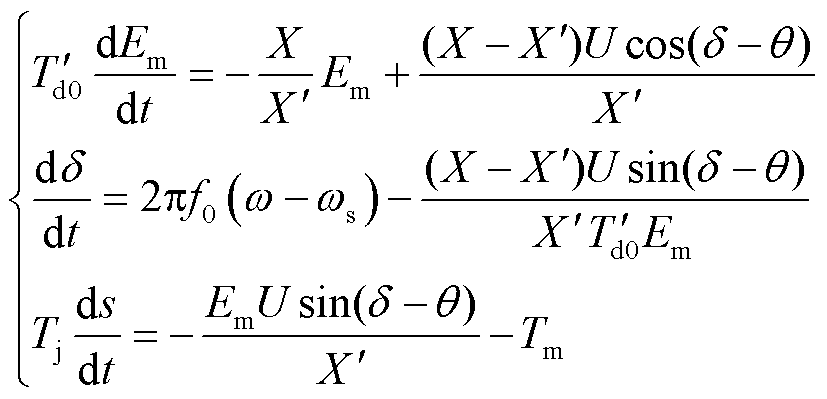
感应电动机常采用三阶实用模型[12]表示为
(1)
 (2)
(2)
式中,Em和δ分别为感应电动机内电动势的幅值和角度;U和θ分别为端口电压的幅值和角度;s为转差; 为额定频率;ω为转子角速度;X为定子电抗;
 为暂态电抗;
 为转子绕组时间常数;Tm0为初始机械转矩;
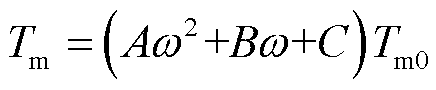
 为初始机械角频率;A、B和C为机械转矩各系数;Tj为转动惯量;Tm为机械功率。
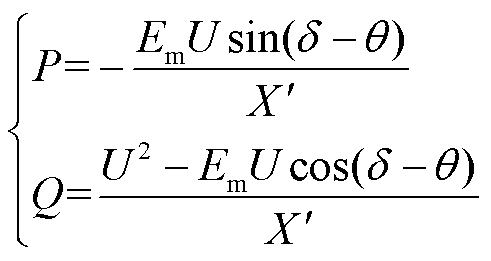
感应电动机的功率表示为
 (3)
(3)
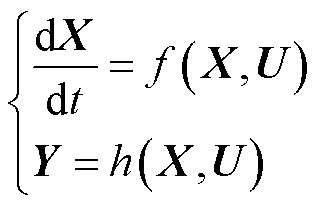
令X=[Em δ s]T,U=[U θ]T,Y=[P Q] T,则感应电动机的状态方程和输出方程可简写为
 (4)
(4)
式中,X为感应电动机状态变量列向量;U为感应电动机端口电压列向量;f和h为函数运算符号。
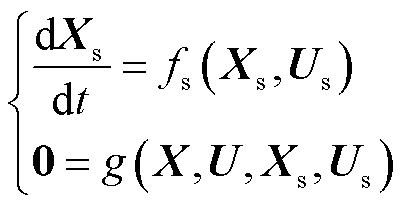
电力系统动态可描述为
 (5)
(5)
式中,Xs和Us分别为电力系统的状态变量和电压列向量;fs和g为函数运算符号。
根据式(5)中的代数方程0=g(X,U, Xs,Us),可知感应电动机的响应Y不仅与自身状态量X和机端电压U相关,还受系统侧状态量Xs和代数量Us影响。如果感应电动机端口电压U可以测量,由式(4)可知,此时感应电动机模型与系统模型实现解耦。因此,电力系统通过机端电压U与感应电动机进行动态交互。
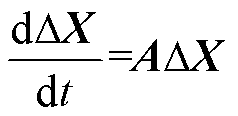
现有方法[12-14]对感应电动机进行动态分群时,常基于感应电动机的自身动态,根据其线性化模型计算特征根,并根据特征根的距离进行分群。感应电动机线性化模型为
 (6)
(6)
式中,A为系数矩阵。对式(1)的三阶模型线性化,可求出感应电动机的三个特征值,通常为一对共轭特征值和1个实特征值。
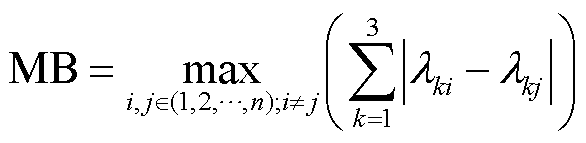
感应电动机之间的特征值距离dE定义为
 (8)
(8)
式中,i和j分别为第i台和第j台感应电动机;λki为第i台感应电动机的第k个特征值;n为待等值感应电动机的台数。
感应电动机群采用最短距离法度量特征根距离,具体为
 (9)
(9)
式中,DL(Ceqm, Ceqn)为感应电动机群Ceqm和Ceqn之间的距离。
上述基于特征根距离的感应电动机分群方法,适用于小扰动,同时仅关注了感应电动机的自身动态。由于感应电动机与电网间的动态交互取决于感应电动机的端口电压,因此为计及电网侧动态的影响,还需同时考虑端口电压动态相似性进行感应电动机的动态分群。
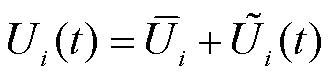
设受扰后感应电动机i的端口电压表示为
 (10)
(10)
式中, 和
和 分别为电压稳定值和电压波动值。
电压波动相似性的距离定义为
式中,K为仿真时长内的总点数。
根据式(11)的距离值,采用类平均法进行电压波动性分群,即
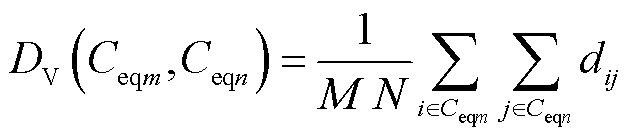 (12)
(12)
式中,DV为感应电动机群Ceqm和Ceqn间电压波动性距离;M和N分别为感应电动机群Ceqm和Ceqn中感应电动机的台数。
新能源机组的动态特性由变流器及其控制策略主导。当新能源机组端口电压低于某一阈值时将切换至低电压穿越(Low Voltage Ride Through, LVRT)控制,此时新能源机组的动态特性与正常控制策略下的动态特性差异较大。
高比例新能源电力系统中,根据上述的小扰动动态相似性及机端电压动态相似性进行感应电动机分群时,有可能使近区新能源机组的运行状态在感应电动机等值前后发生切换,即等值前新能源机组未进入LVRT状态,但等值后却进入LVRT运行状态,或反之。此时对外网将产生较大的等值误差。
为说明该问题,以图1所示的10机39节点新英格兰改进系统为例。
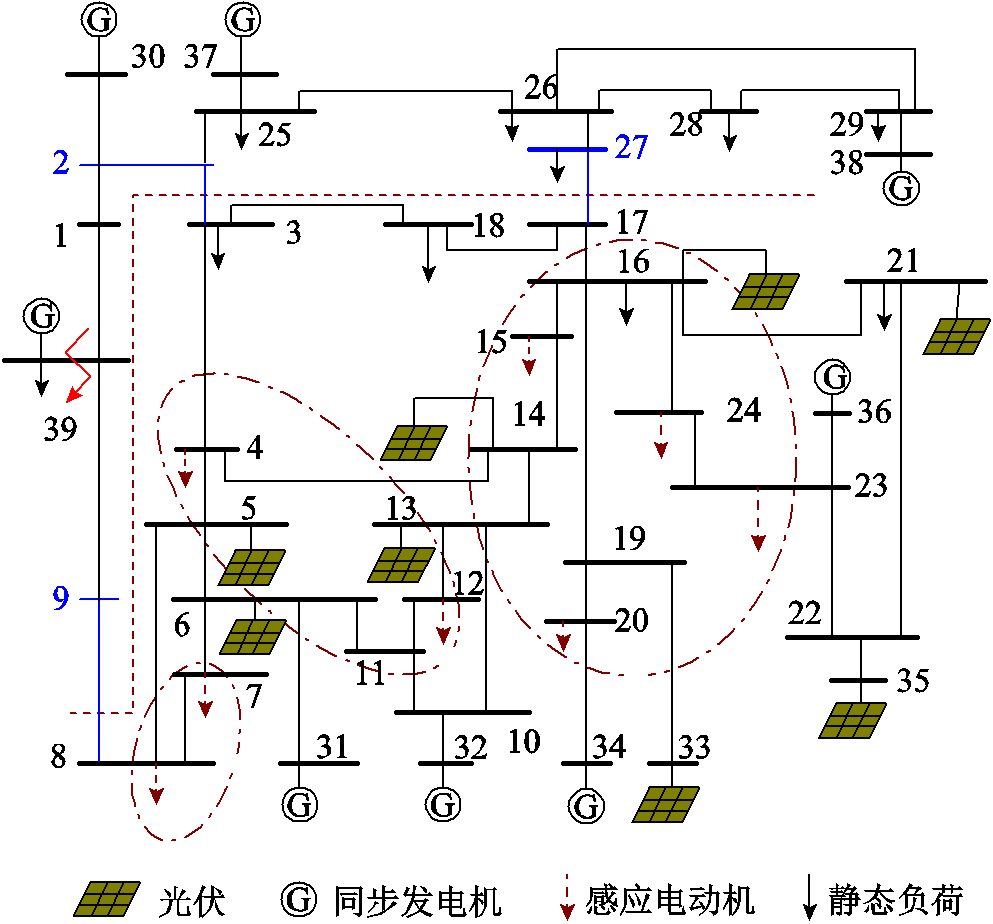
图1 10机39节点系统
Fig.1 10-generator 39-bus simulation system
在原系统的负荷节点{5,6,13,14,16,21}增设光伏电源,为保持原节点的功率平衡,在相应节点上增加了功率相同的恒阻抗负荷;将同步发电机节点{33,35}改为有功出力相同的光伏电源,通过并联电容保证原节点的无功出力不变。仿真平台为电力系统分析综合程序(Power System Analysis Software Package, PSASP),其中虚线以上为研究区域,虚线以下为待等值区域。为了研究的需要,将原系统中的静态负荷节点{4,7,8,12,15,20,23,24}设置为含感应电动机的综合负荷,其中静态负荷采用恒阻抗模型,其他保持不变。附表1给出了各感应电动机的参数,其中Pmp表示感应电动机初始负荷比重,KL表示负载率。
扰动1设置为t=1s时节点39发生接地电抗为0.025(pu)的三相短路,故障持续0.1 s后消失,各感应电动机出口电压的受扰轨迹如图2所示,此时所有光伏电源都未进入LVRT状态。
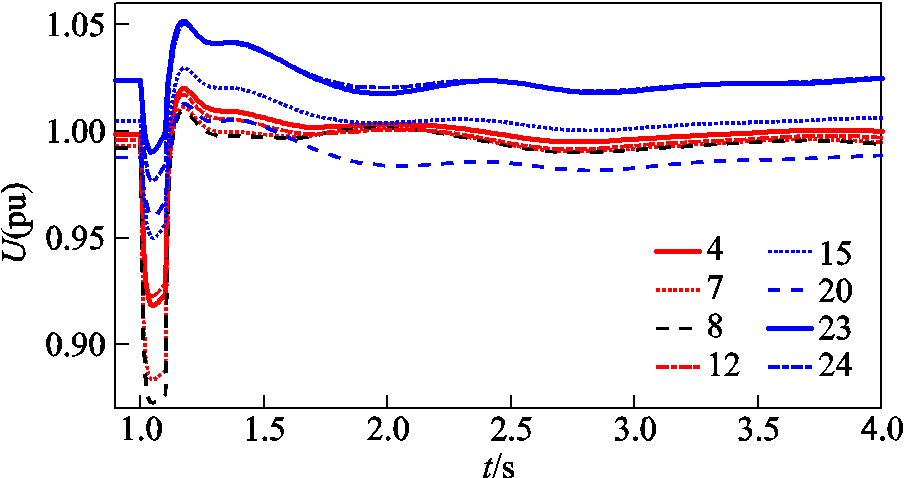
图2 感应电动机端口电压响应轨线
Fig.2 Terminal voltage responses of induction motor
扰动2设置为t=1 s时节点39发生接地电抗为0.004(pu)的三相短路,故障持续0.1 s后消失。图3给出了该扰动下各光伏电源端口电压的受扰轨迹,可以看出,故障期间光伏电源{5,6,13,14}的电压小于0.9Un(光伏电源进入LVRT的阈值),因此光伏电源{5,6,13,14}进入LVRT,其余光伏电源{16,21, 33,35}则未进入LVRT。
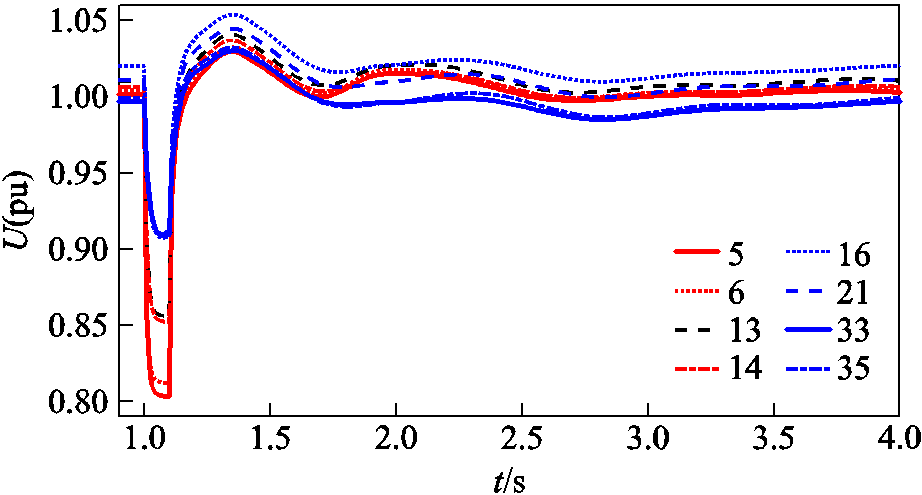
图3 光伏母线电压波形
Fig.3 Voltage waveforms of photovoltaic bus
根据故障1下系统受扰期间各母线电压的最低值,将小于0.9Un的区域标示为深灰,大于0.9Un的区域标示为浅灰,如图4a所示。同样方法将故障2下系统受扰期间节点电压小于0.9Un的区域标示为深灰,大于0.9Un的区域标为浅灰,如图4b所示。从图4b可以发现:当感应电动机{15,20,23,24}分在同群时,该群内的节点{20,23,24}的电压高于0.9Un,但节点15的电压低于0.9Un。
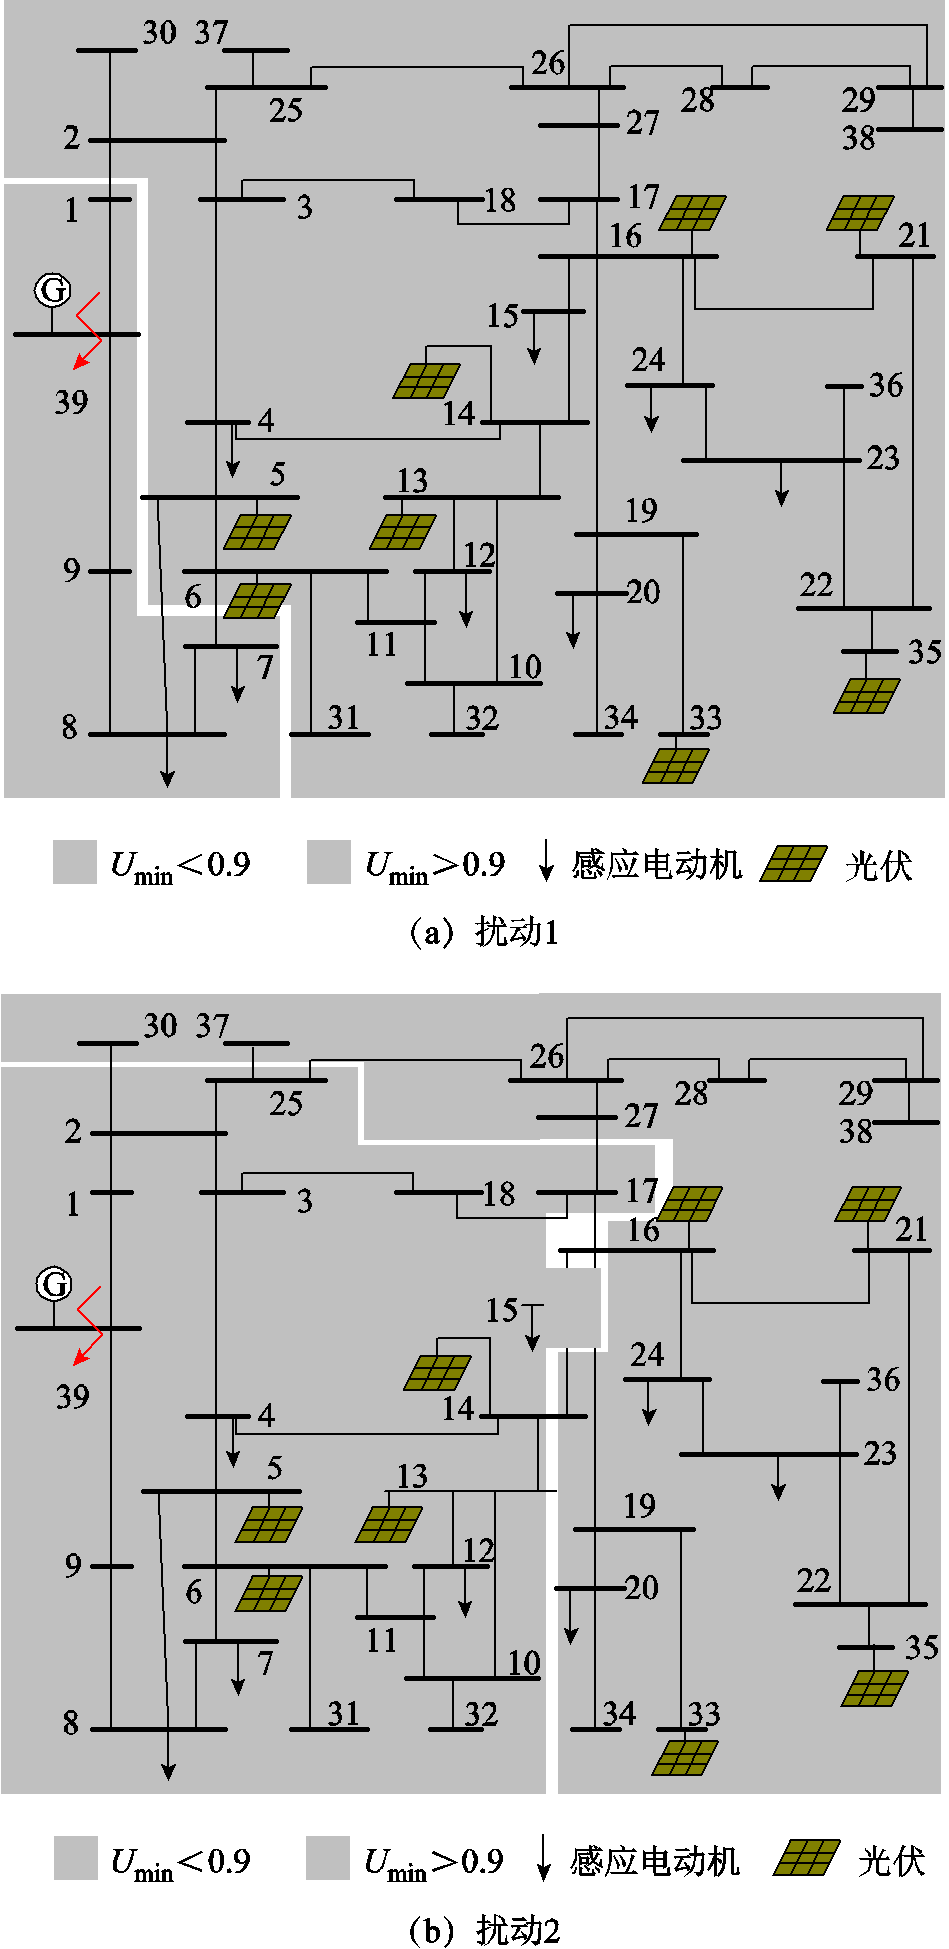
图4 故障期间按各节点电压最低值分区
Fig.4 Partition results by bus voltage during the fault
由于感应电动机{15, 20, 23, 24}故障期间的电压跌落相差较大,图5给出了将这些机组分在同群时,等值前后该区域内光伏电源33的响应特性。可以发现,等值前光伏电源33未进入LVRT,但等值后光伏电源33却进入了LVRT,导致其有功功率和无功功率在等值前后相差较大。因此感应电动机等值前后导致光伏电源的运行状态发生改变是等值误差的关键因素。
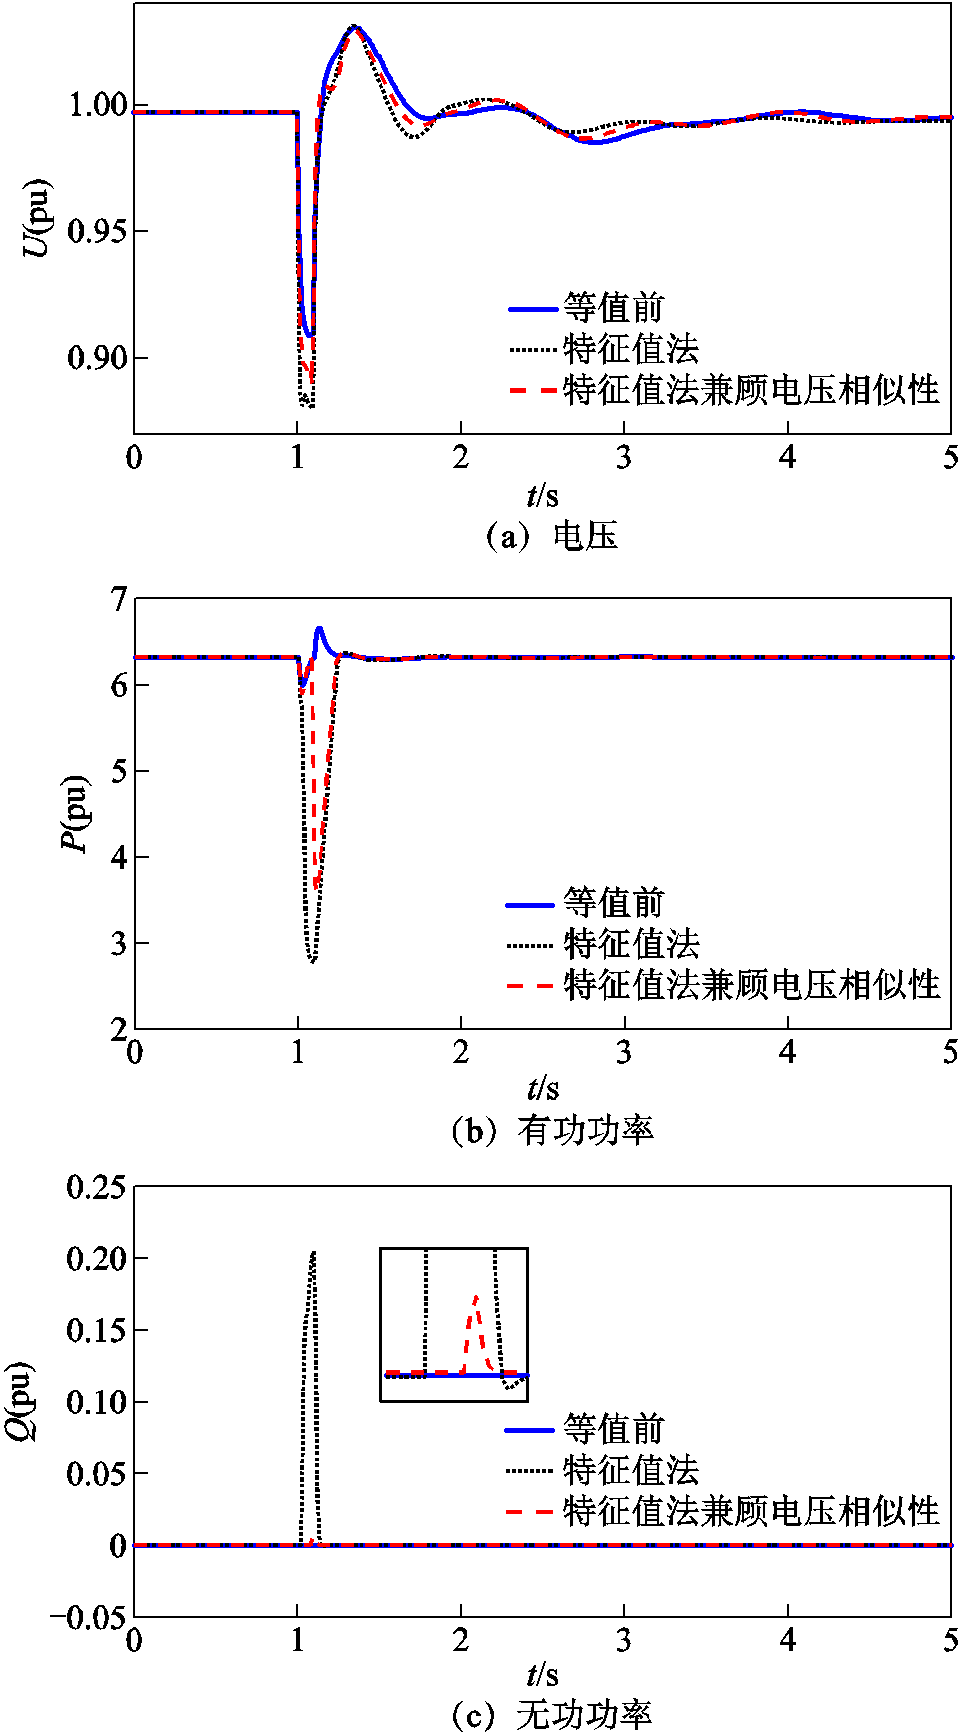
图5 光伏节点33等值前后电压和功率波形
Fig.5 Voltage and power trajectories of node 33 before and after the equivalence
为此,本文针对高比例新能源电力系统,提出了进一步考虑端口电压跌落深度的感应电动机分群方法。即将故障期间端口电压低于某一阈值(一般取新能源机组进入LVRT的电压门槛值)的感应电动机分为一群,其余电机分在另一群。
综合上述三种分群方法,即根据感应电动机小扰动动态相似性、机端电压动态相似性及机端电压跌落深度的分群结果,将三种方法得到的分群结果的交集分在新的一群,其余各自分在新群中,获得最终的分群结果。
得到感应电动机分群结果后,按照同步发电机同调等值法[19]对网络进行化简。采用容量加权法对感应电动机各参数进行聚合,以参数q为例,等值感应电动机的参数qeq聚合为
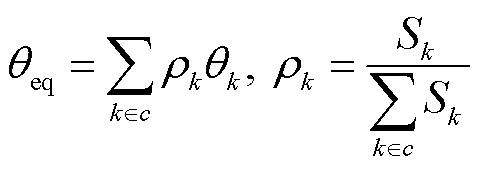 (13)
(13)
式中,c为某一感应电动机群;Sk为机群c内第k个感应电动机的额定功率。
为衡量等值模型的精度,本文采用方均根(Root Mean Square, RMS)误差E1和绝对误差E2两个指标,定义为
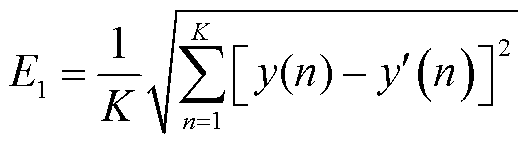 (14)
(14)
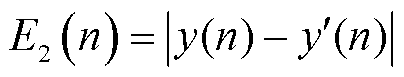 (15)
(15)
式中,y和 分别为等值前和等值后的受扰轨迹。
综合上述机组分群、参数聚合及网络化简各步骤,感应电动机的动态等值流程如图6所示。
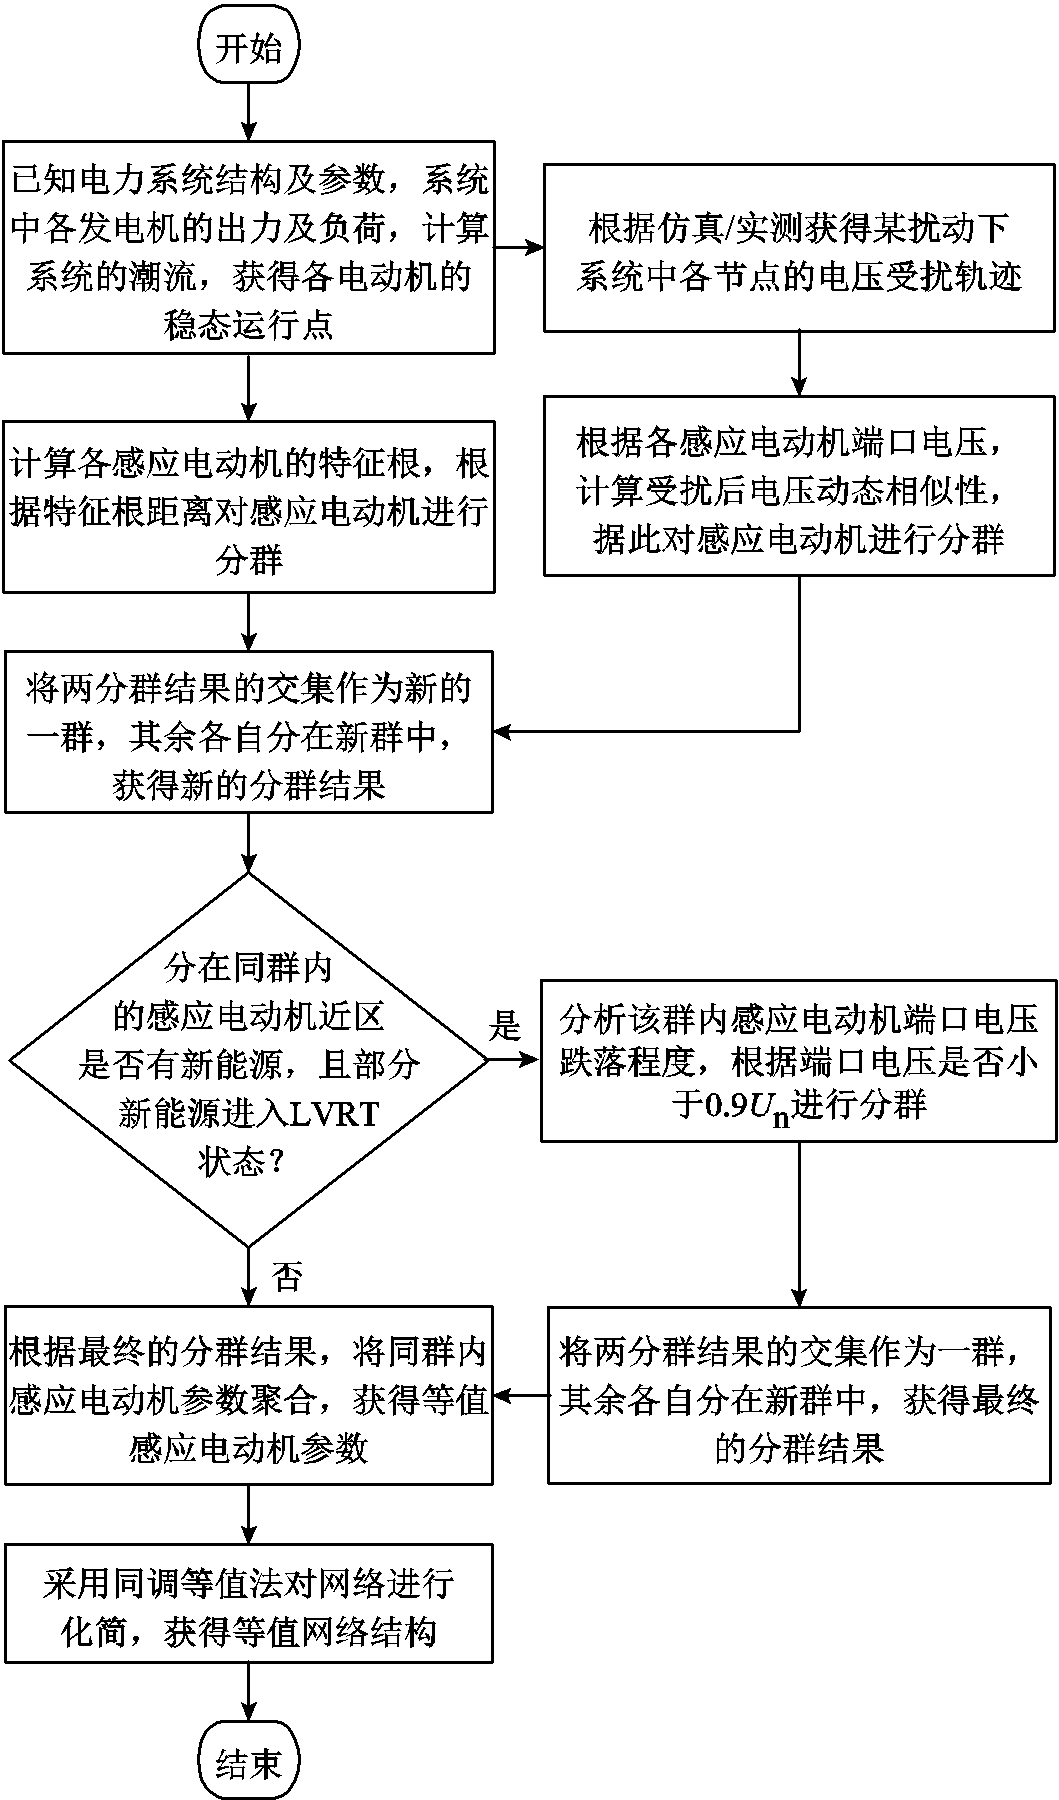
图6 感应电动机动态等值流程
Fig.6 Flow chart of induction motor equivalent modelling
以图1所示的10机39节点新英格兰改进系统为例进行分析。
3.1.1 基于特征根距离的分群结果
首先计算系统的潮流,根据潮流结果计算各感应电动机的初始参数,在此基础上计算得到各感应电动机的特征根结果,见附表2。根据式(7),得到各感应电动机的特征根距离,见附表3。根据附表3,获得基于特征根相似性的感应电动机分群结果,根据特征值距离的分群聚类如图7所示。
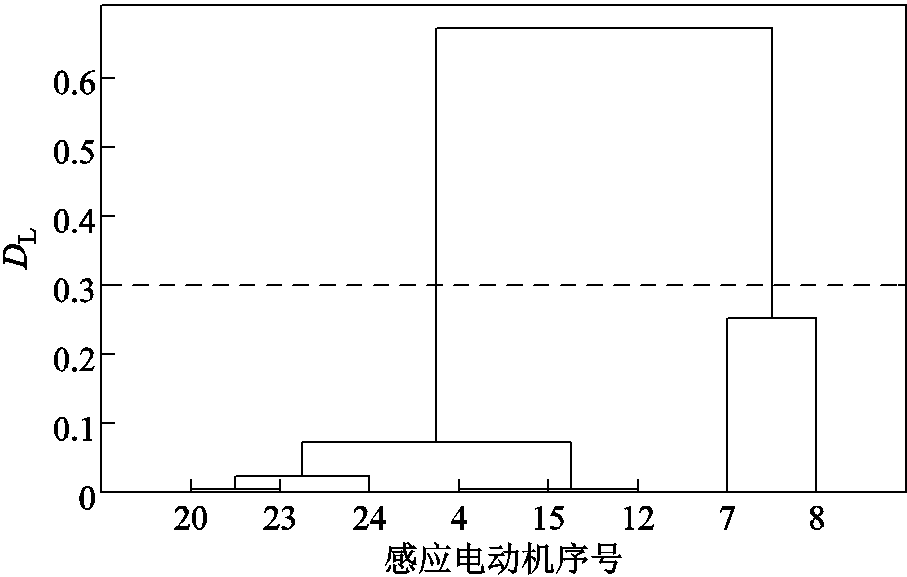
图7 根据特征值距离的分群聚类
Fig.7 Clustering diagram by eigenvalue distance
根据图7,选取DL=0.3为分群阈值,得到感应电动机分群结果为:机组{7,8}分为同群,其余机组{4, 12, 15, 20, 23, 24}分为同群。
3.1.2 所有光伏电源未进入LVRT状态的分群结果
根据前述扰动1,获得图2所示各感应电动机出口电压的受扰轨迹,此时所有光伏电源都未进入LVRT状态。
1)基于端口电压动态相似性的分群结果
根据式(10)和式(11),计算图2中各感应电动机端口电压的相似性距离,结果见附表4。根据电压波动的相似性距离,可得感应电动机分群结果,基于动态电压相似性的分群聚类如图8所示。选取DV=0.002为分群阈值,可将感应电动机{4, 7, 8, 12}分为同群,其余机组{15, 20, 23, 24}分为同群。
综合感应电动机小扰动动态相似性分群和基于机端电压动态相似性的分群结果,可将感应电动机最终分为三群,具体为:群1{7, 8},群2{4, 12}以及群3{15, 20, 23, 24}。根据该分群结果,将同群内感应电动机参数进行聚合,等值电动机的模型参数见附表5。
2)等值模型的精度分析
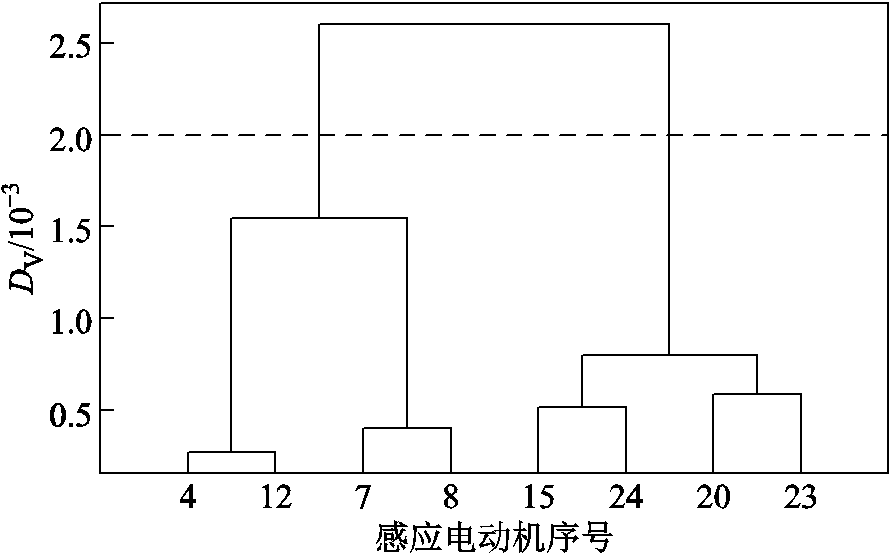
图8 基于动态电压相似性的分群聚类
Fig.8 Clustering results by voltage fluctuation similarity
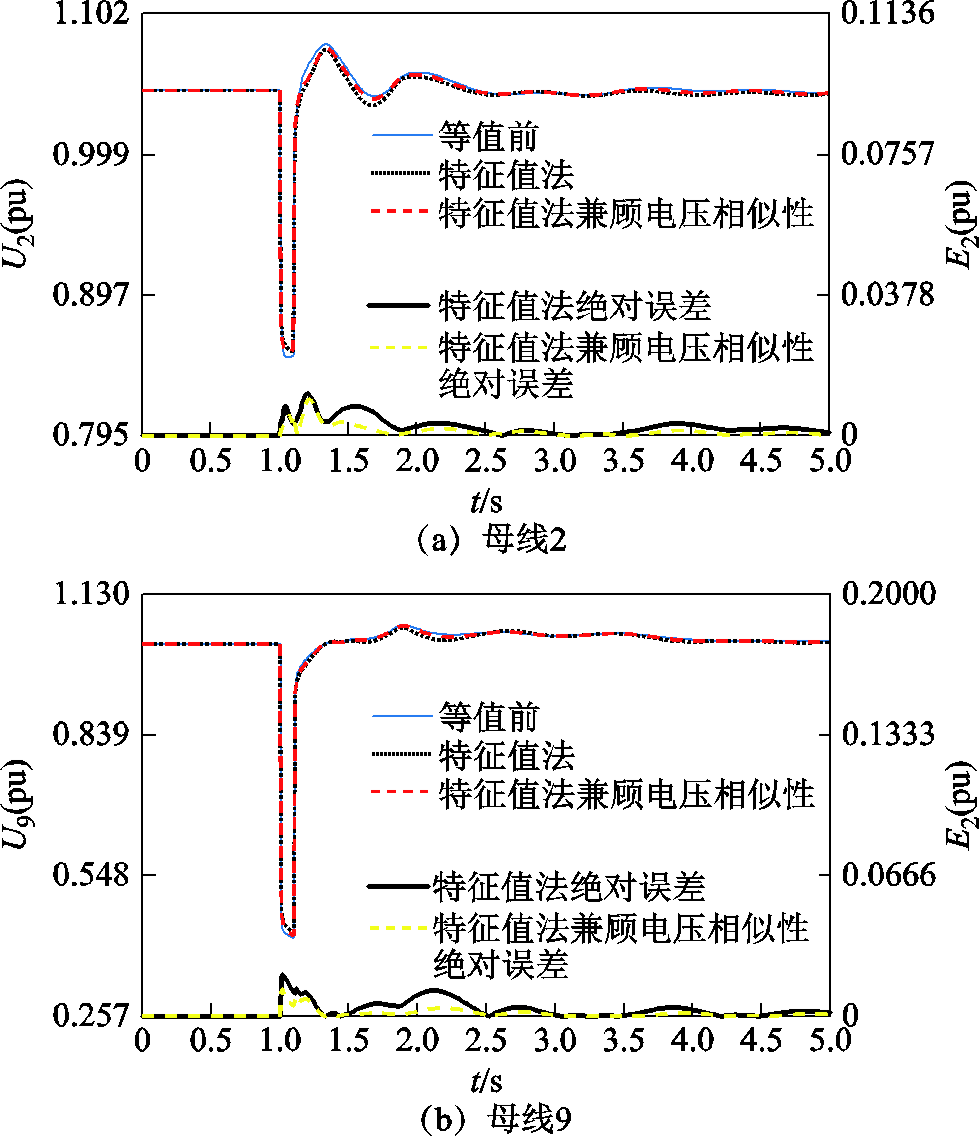
为验证所提分群方法的可行性,在上述相同扰动下,仿真获得感应电动机等值前后系统中边界节点{2, 9, 27}的电压受扰轨迹,以及边界线路{3-2, 8-9, 17-27}的功率受扰轨迹,等值前后边界节点电压和边界线路功率的误差如图9所示。限于篇幅,图9仅给出了节点27的电压以及线路17-27的功率受扰轨迹,其余如附图1~附图3所示。表1给出了仅根据特征根距离分群以及采用本文方法分群时,等值前后边界节点和边界线路的方均根误差。
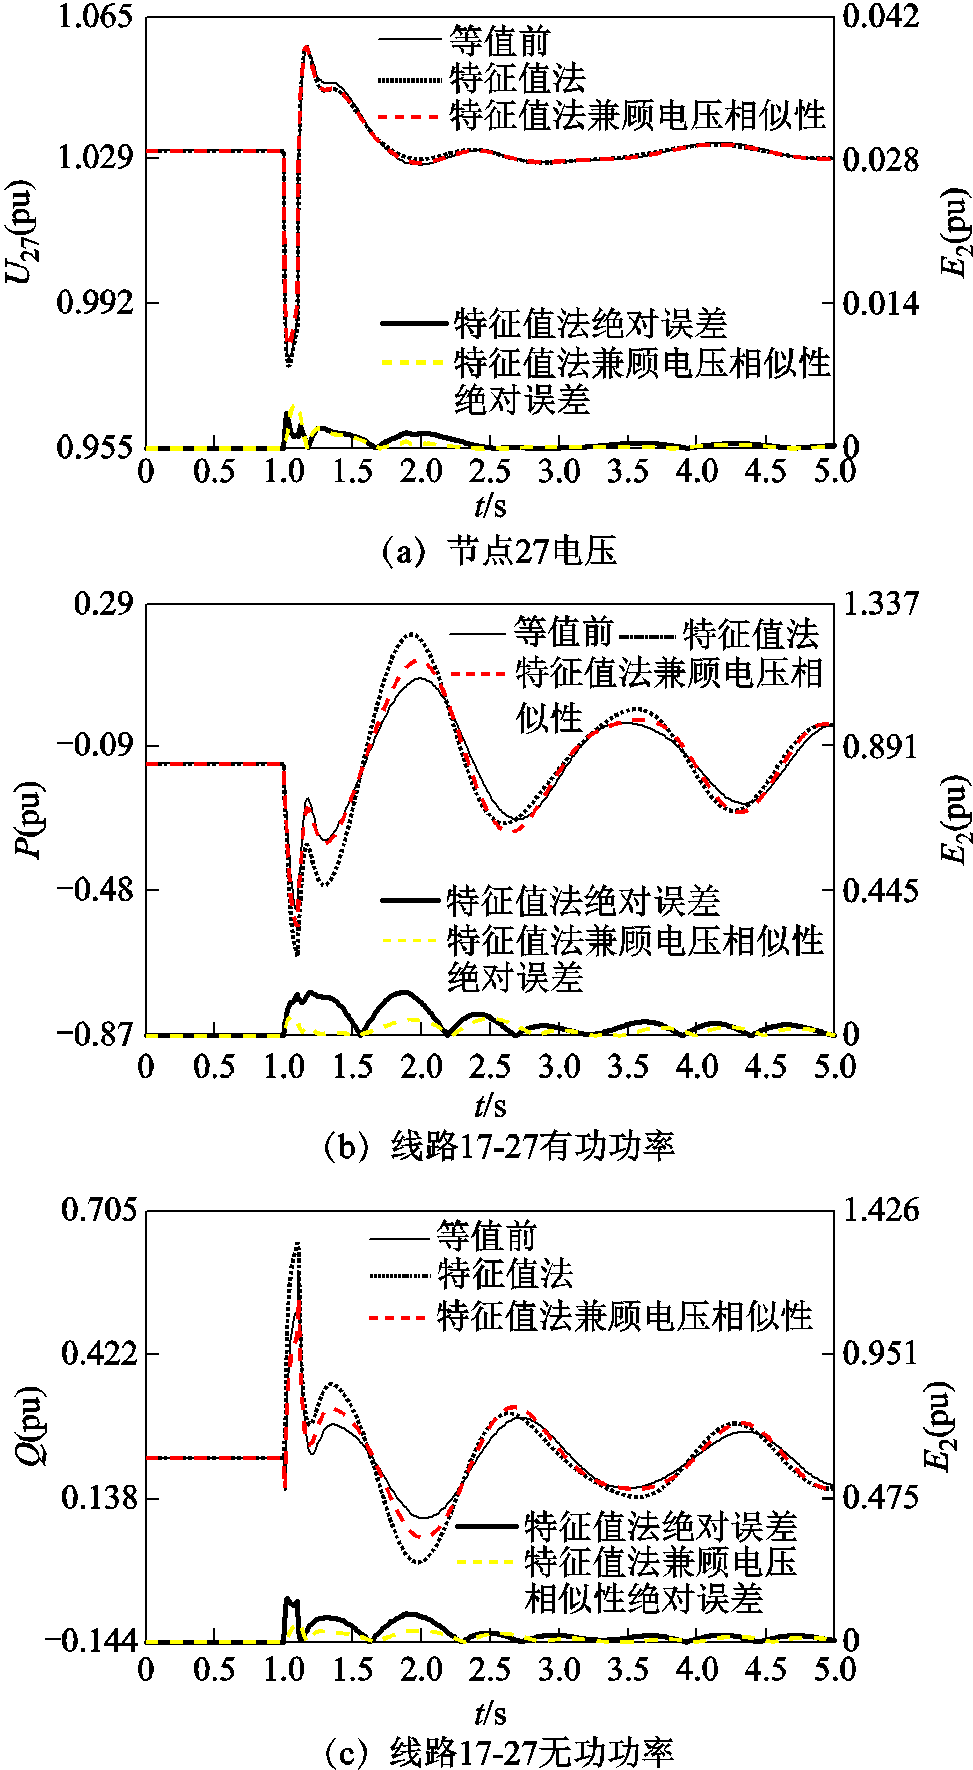
图9 等值前后边界节点电压和边界线路功率的误差
Fig.9 Equivalent model error of boundary node voltage and tie-line power
表1 两种分群方法下的方均根误差
Tab.1 The RMS error of the two clustering methods

轨迹特征值距离法兼顾动态电压相似性法准确度提高(%) U2 /kV0.009 70.007 027.835 1 U9 /kV0.026 80.013 549.626 9 U27 /kV0.010 60.010 41.866 8 P3-2 (pu)0.038 60.025 833.160 6 P8-9 (pu)0.613 70.391 536.206 6 P17-27 (pu)1.688 40.708 358.049 0 Q 3-2 (pu)0.135 40.075 444.313 1 Q8-9 (pu)0.221 10.117 446.901 9 Q17-27 (pu)0.761 10.351 653.803 7
从图9和表1可以看出,综合特征根距离及电压波动相似性的分群方法,其等值模型误差小于现有仅根据特征根距离方法的误差,说明了本方法的可行性。
由于扰动1导致的电压跌落程度较低,下面进一步分析较大电压跌落扰动下的等值效果。
3.1.3 部分光伏电源进入LVRT状态下的动态分群
前述扰动2下,光伏电源{5, 6, 13, 14}进入LVRT,其余则未进入LVRT。
1)综合特征根距离和端口电压动态相似性的分群结果
综合特征根距离和端口电压动态相似性的分群结果,得知该故障下感应电动机的分群结果同故障1,即群1{7, 8},群2{4, 12}及群3{15, 20, 23, 24}。图10给出了等值前后边界节点27的电压和边界线路17-27的功率受扰轨线。限于篇幅,其余节点和线路的受扰轨迹如附图4~附图6。从图10可以看出:①相比于仅采用特征根距离的分群结果,本文兼顾电压波动相似性分群方法的等值模型精度更高;②与图9结果相比,此时等模型的误差都较大。尤其是线路3-2有功功率、线路17-27有功功率和无功功率。下面将进一步分析导致该误差的原因。
2)进一步考虑电压跌落深度的感应电动机分群
扰动2下,综合特征根距离和端口电压动态相似性的分群结果为:群1{7,8},群2{4,12},群3{15, 20, 23, 24}。由于故障期间群3中感应电动机{20, 23, 24}端口电压高于0.9Un,但感应电动机15电压却低于0.9Un,同时群3感应电动机近区有大量的光伏电源,因此进一步考虑电压跌落深度后,感应电动机最终分群结果为:群1{7,8},群2{4,12},群3{15},群4{20,23,24}。
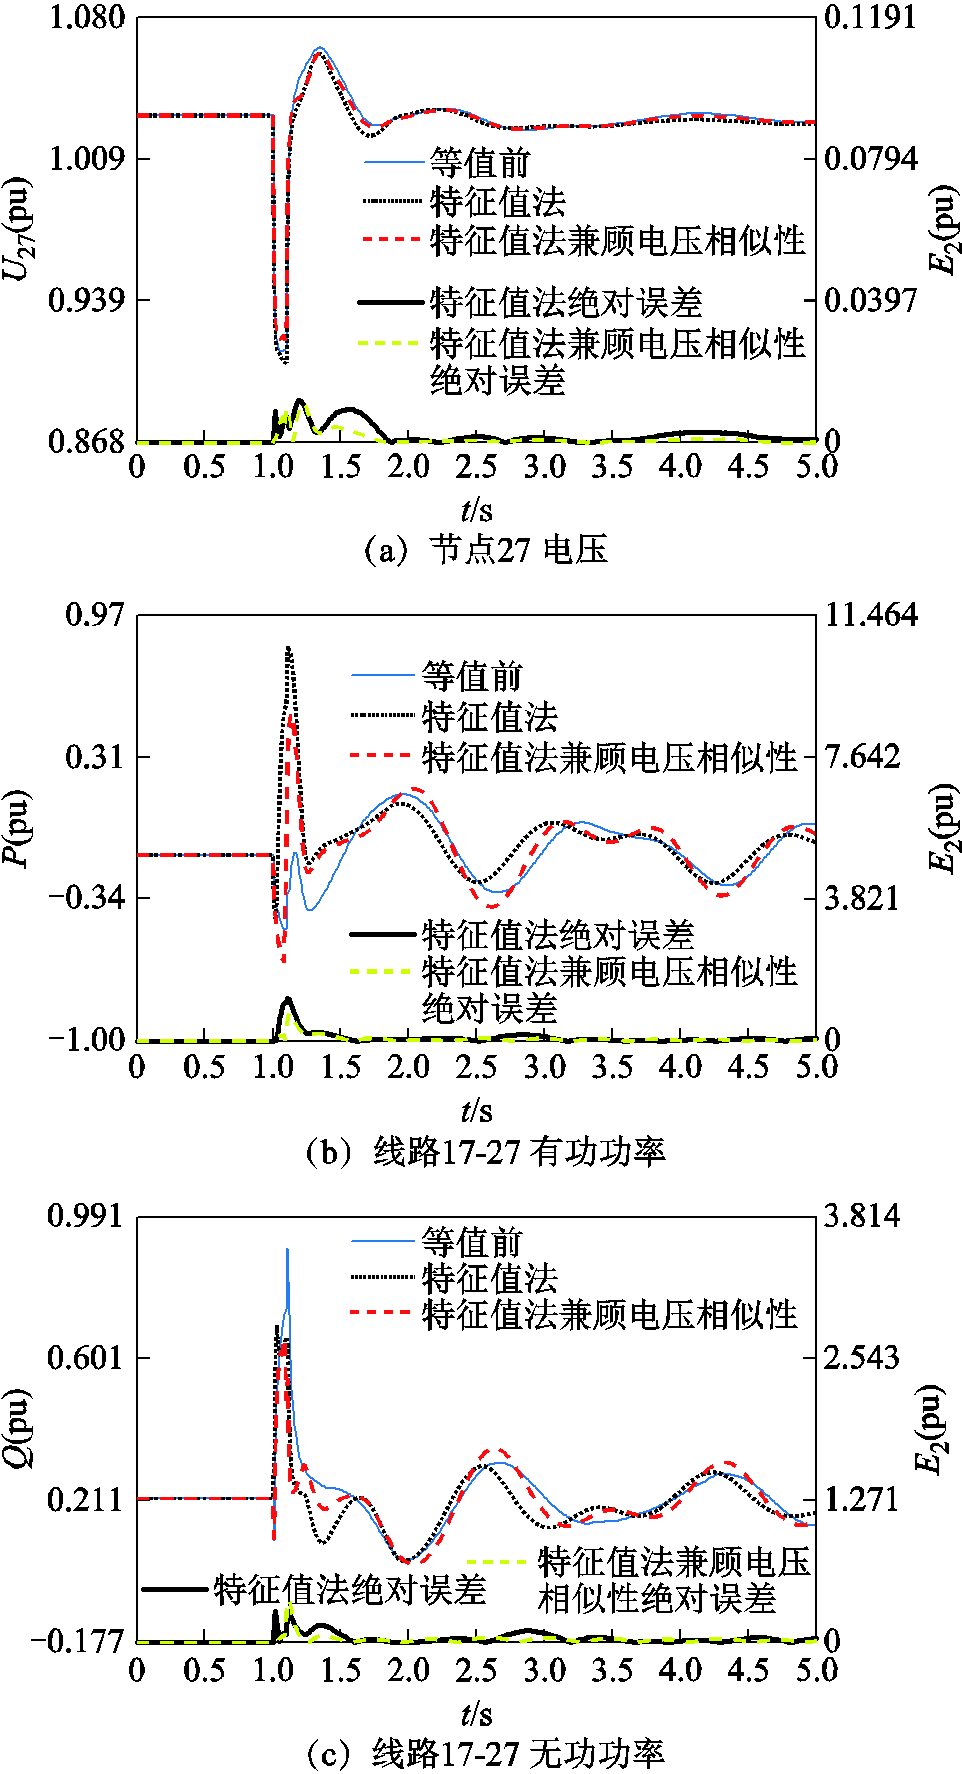
图10 等值前后边界节点电压和边界线路功率的误差
Fig.10 Equivalent model error of boundary node voltage and tie-line power
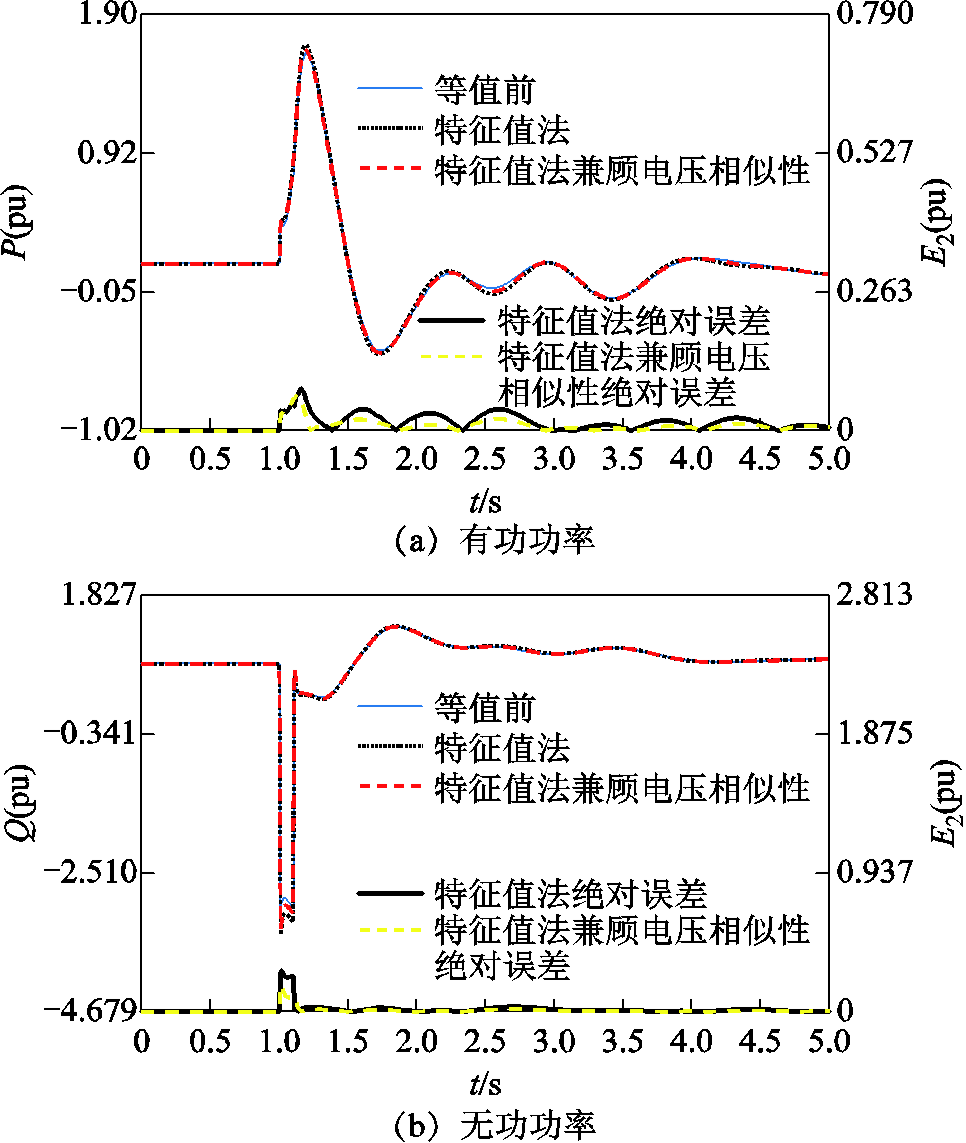
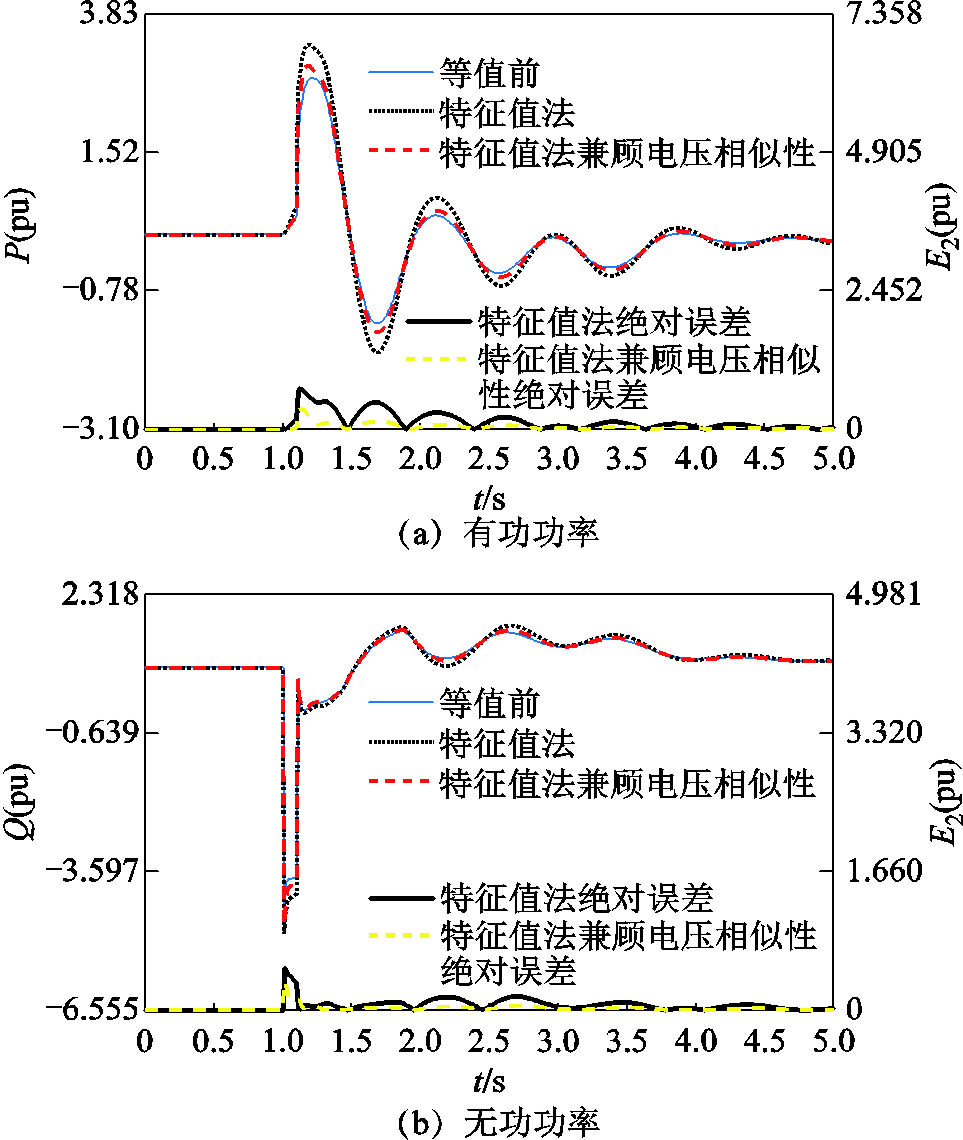
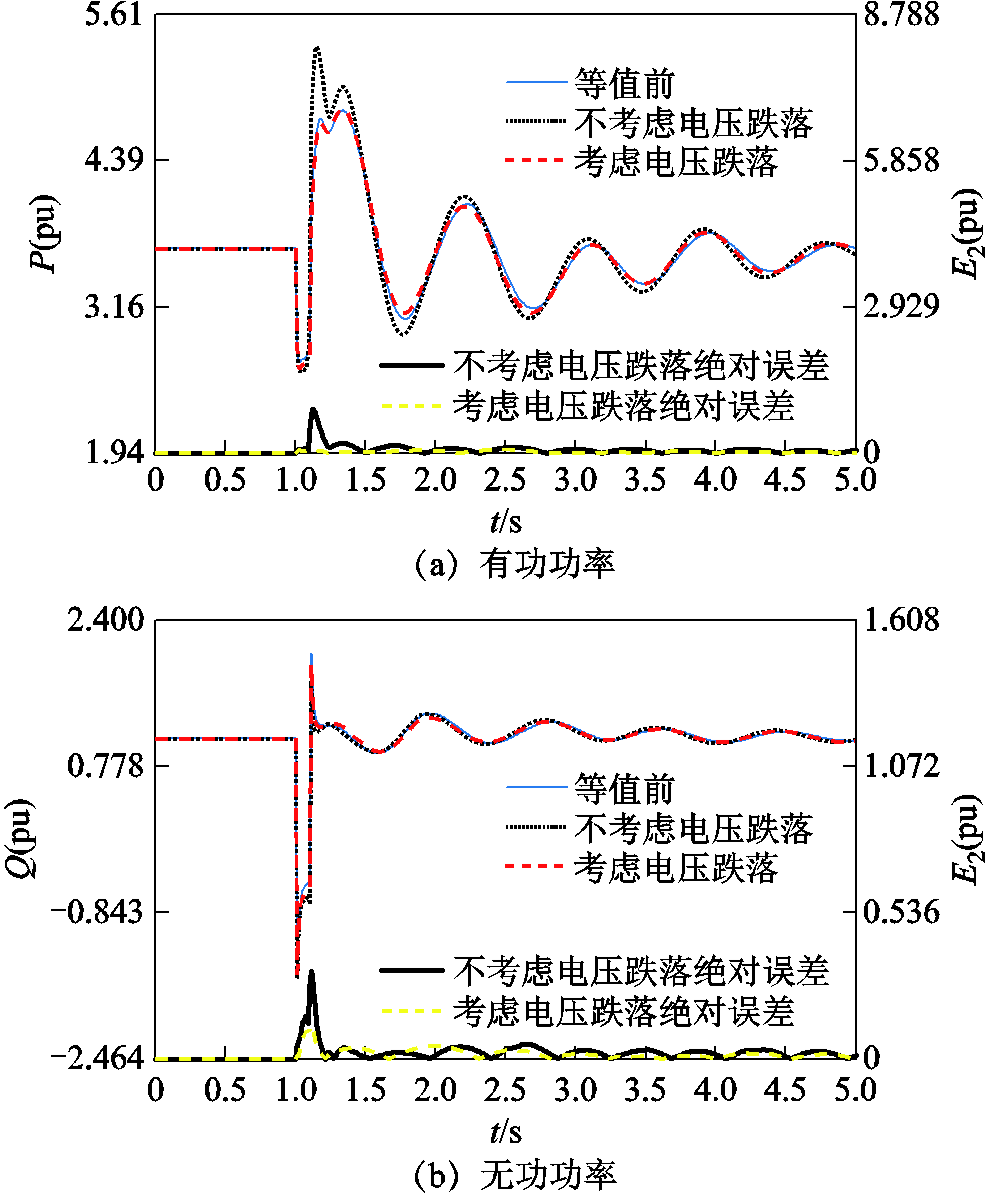
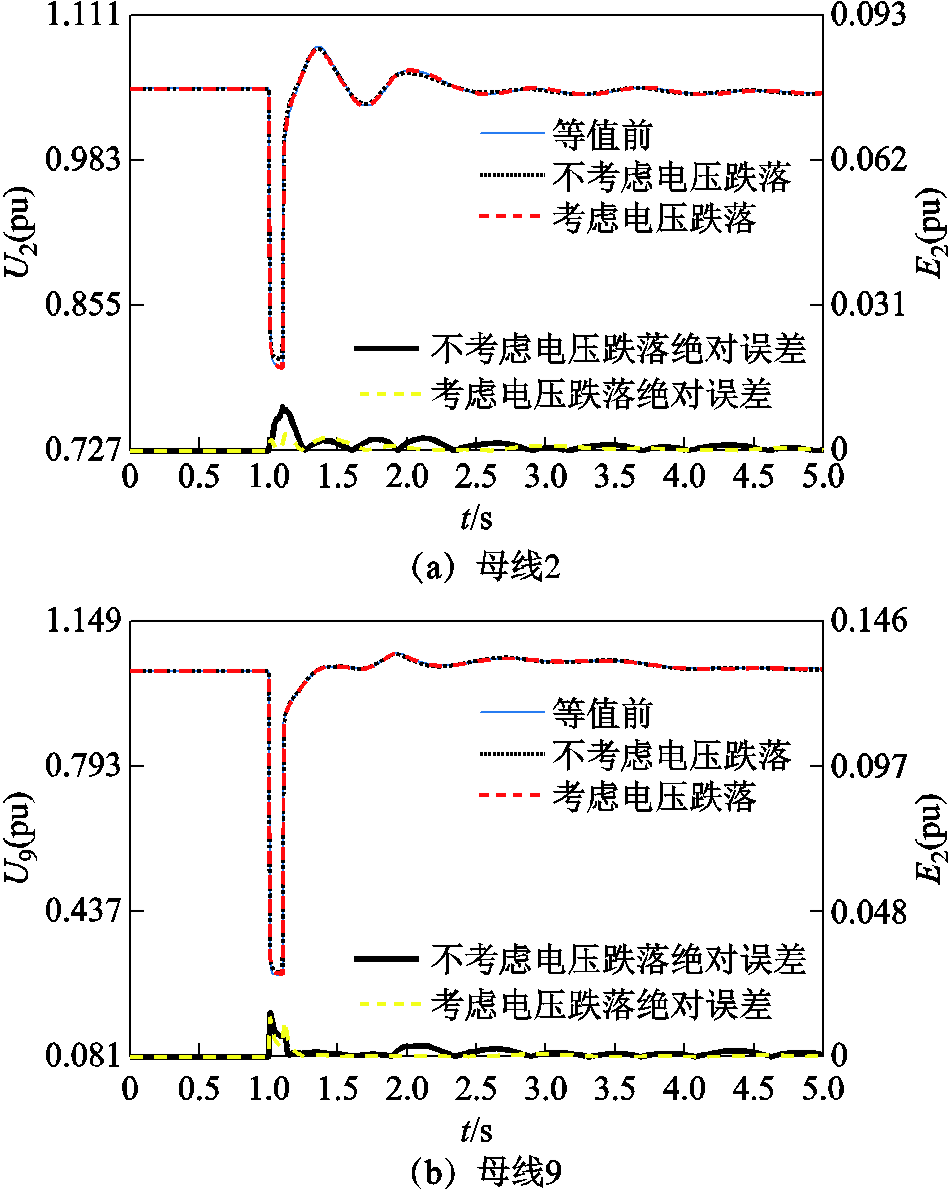
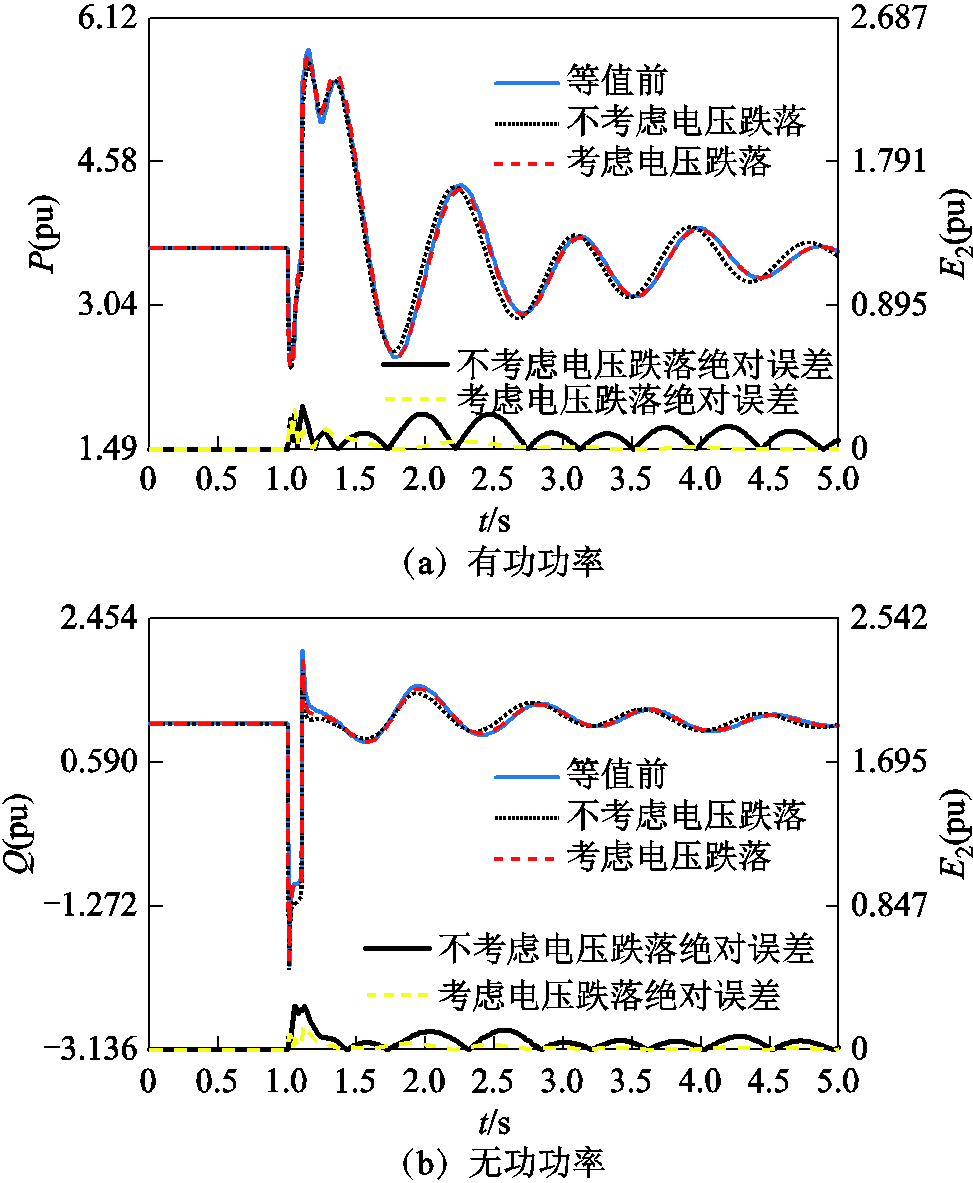
根据该分群结果,采用按容量加权获得等值机参数。为分析该分群方法下感应电动机等值建模的精度,图11给出了等值前后边界节点27的电压及线路17-27的功率受扰轨迹,其余轨线如附图7~附图9所示。表2为考虑电压跌落深度前后感应电动机等值误差。图12还给出了光伏节点33的电压和功率受扰轨迹。
从图11、图12和表2可以看出:
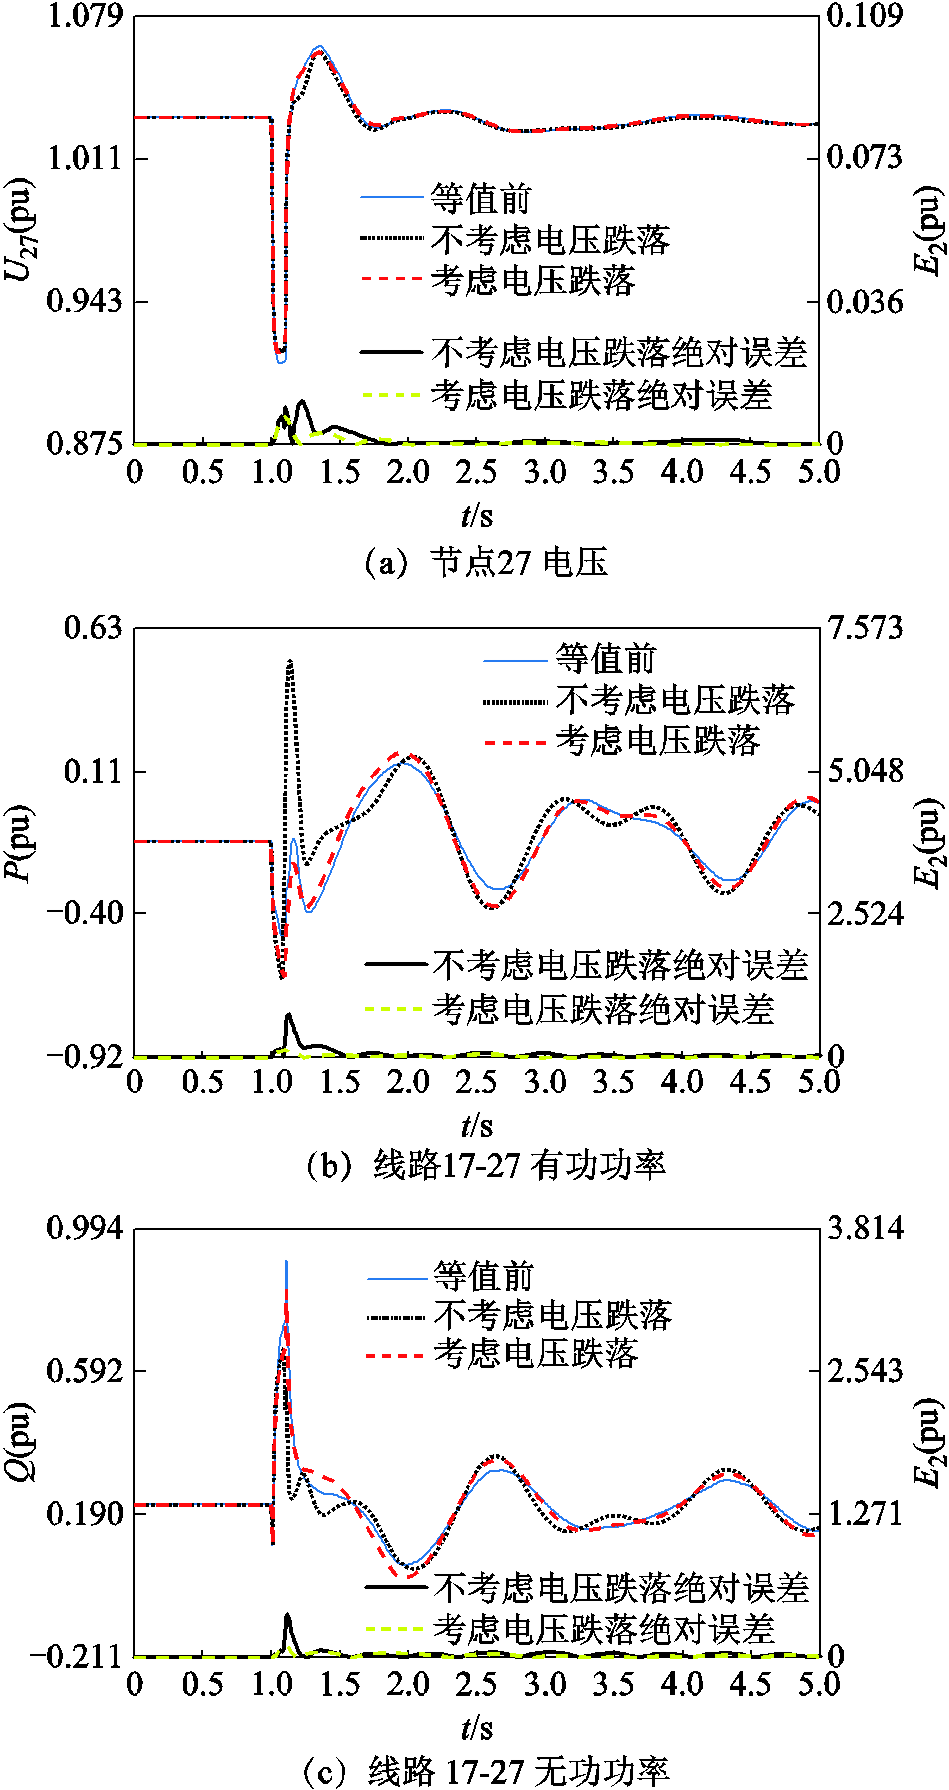
图11 考虑电压跌落深度后边界节点和线路的等值误差
Fig.11 Equivalent error of boundary node and transmission line after considering voltage dip depth
表2 扰动2下考虑电压跌落深度下的等值模型方均根误差
Tab.2 The RMS error of the two clustering methods after considering voltage dip depth under disturbance 2
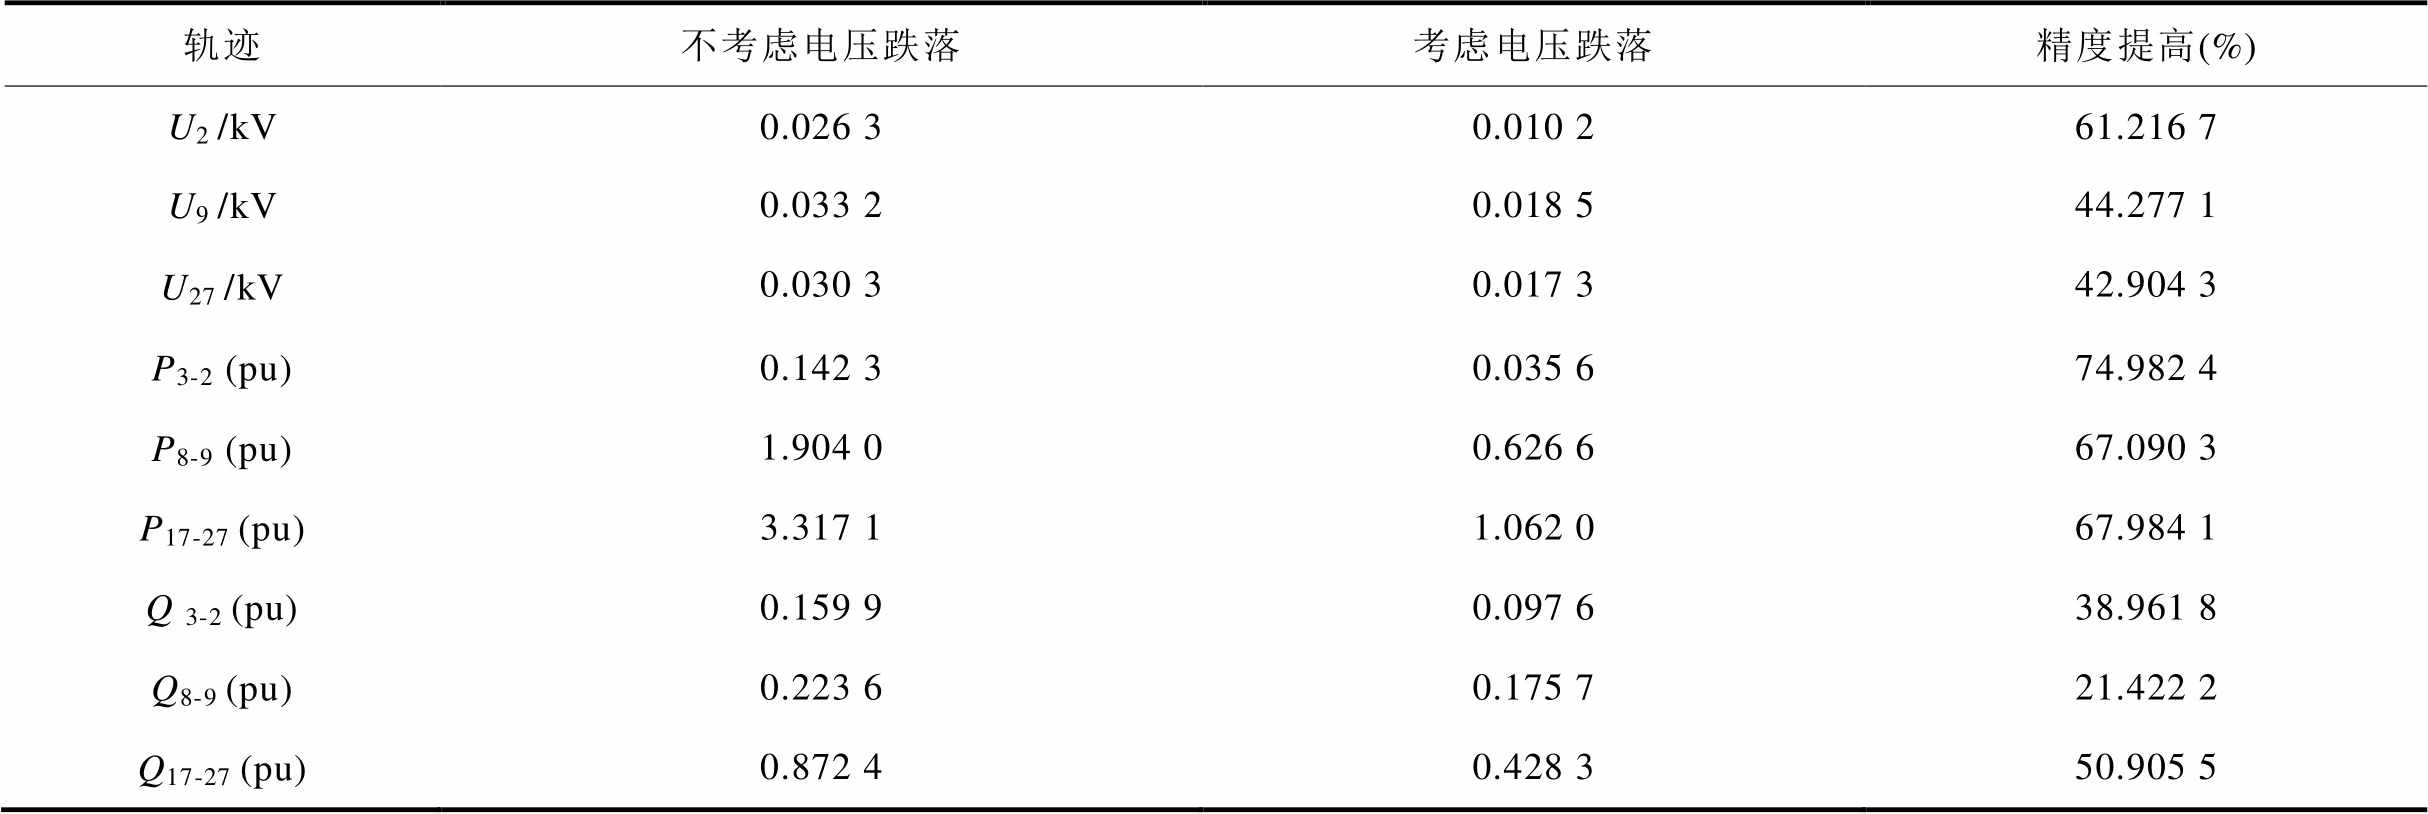
轨迹不考虑电压跌落考虑电压跌落精度提高(%) U2 /kV0.026 30.010 261.216 7 U9 /kV0.033 20.018 544.277 1 U27 /kV0.030 30.017 342.904 3 P3-2 (pu)0.142 30.035 674.982 4 P8-9(pu)1.904 00.626 667.090 3 P17-27 (pu)3.317 11.062 067.984 1 Q 3-2 (pu)0.159 90.097 638.961 8 Q8-9 (pu)0.223 60.175 721.422 2 Q17-27 (pu)0.872 40.428 350.905 5
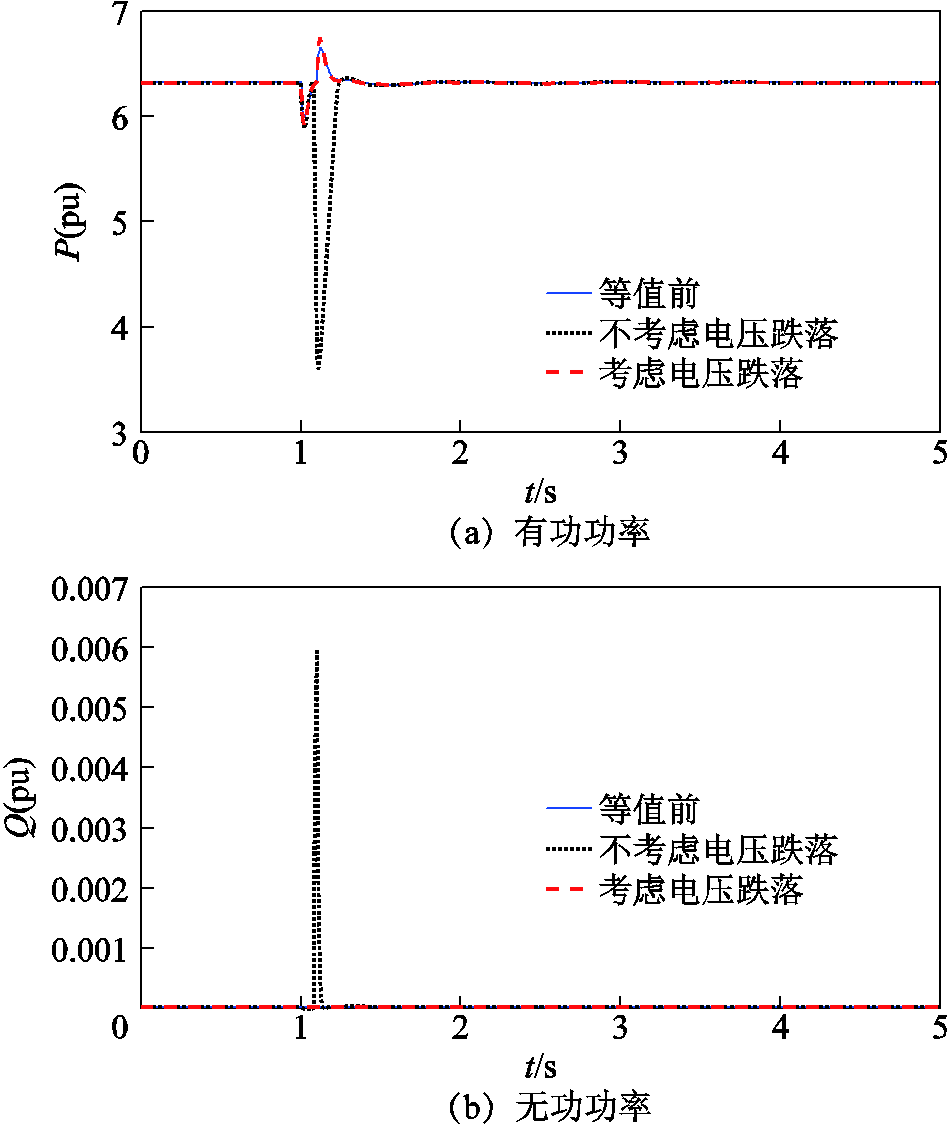
图12 考虑电压跌落深度后光伏节点33等值误差
Fig.12 Equivalent error of node 33 after considering voltage dip depth
(1)当扰动导致节点电压跌落深度较大,且群内感应电动机近区有光伏电源时,进一步考虑电压跌落深度的分群方法,可有效提高感应电动机的等值建模精度。
(2)由图12可以看到:进一步考虑电压跌落深度的分群方法,保证了等值前后区域内光伏进入LVRT的情况不变,这是感应电动机的等值建模精度得以提升的原因。
3.1.4 适应性分析
为分析所提建模方法的适应性,设置扰动3为t=1 s节点39发生三相金属性短路,故障持续0.1 s消失。考虑特征根距离和机端电压动态相似性的分群方法,分群结果为:{7,8}为群1,{4,12}为群2,{15,20,23,24}为群3。进一步根据各群内感应电动机端口电压在故障期间的跌落程度,可以发现群1和群2中感应电动机,以及群3中感应电动机{15, 24}的电压大于0.9Un,但{20, 23}的电压小于0.9Un。据此可得最终的分群结果为:群1{7,8},群2{4, 12},群3{15, 24},群4{20, 23}。
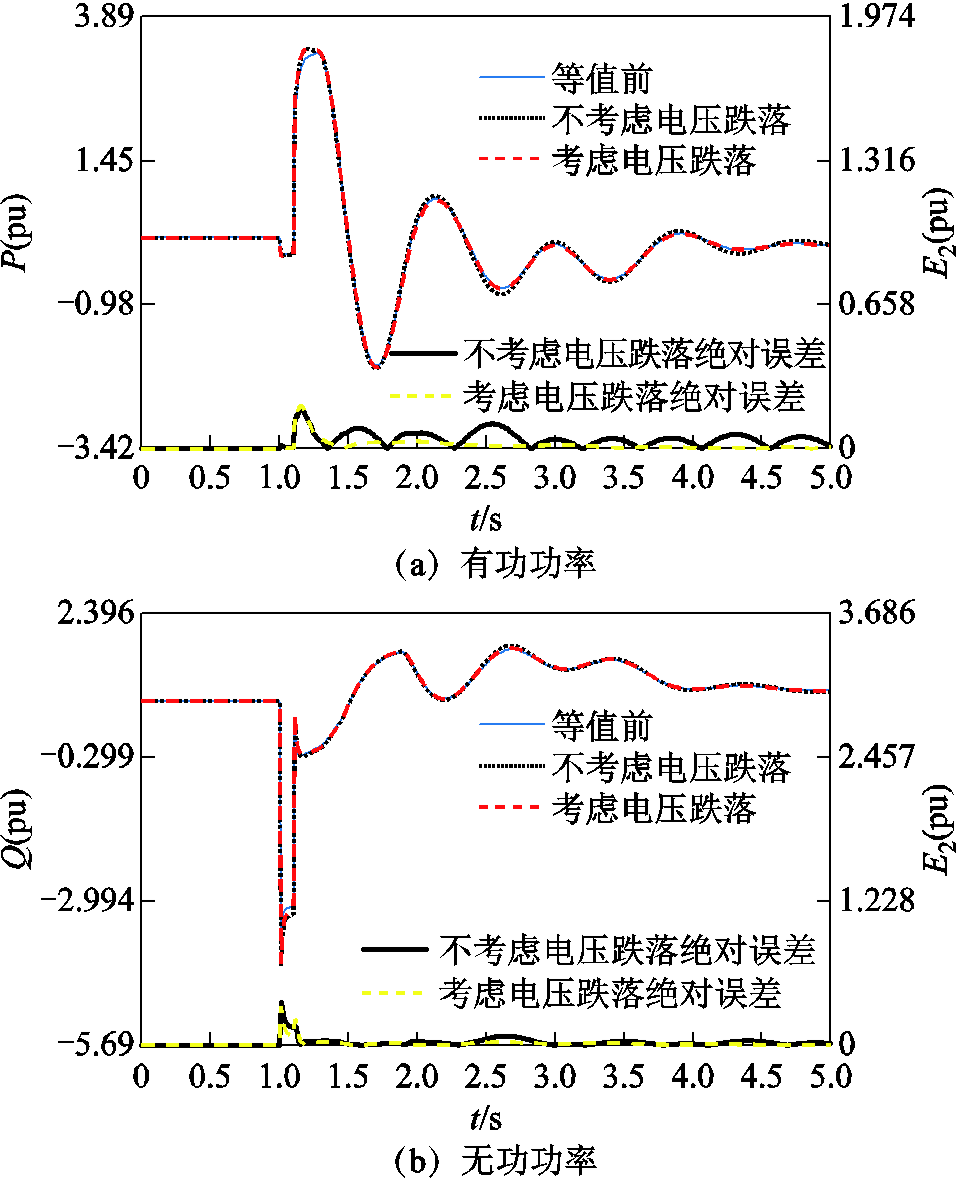
为分析该分群方法下感应电动机等值建模的精度,图13给出了等值前后边界节点27的电压及线路17-27的功率受扰轨迹,以及光伏节点33的电压和功率受扰轨迹,其余受扰轨线如附图10~附图12。表3给出了进一步考虑电压跌落深度后两种分群方法的建模误差。
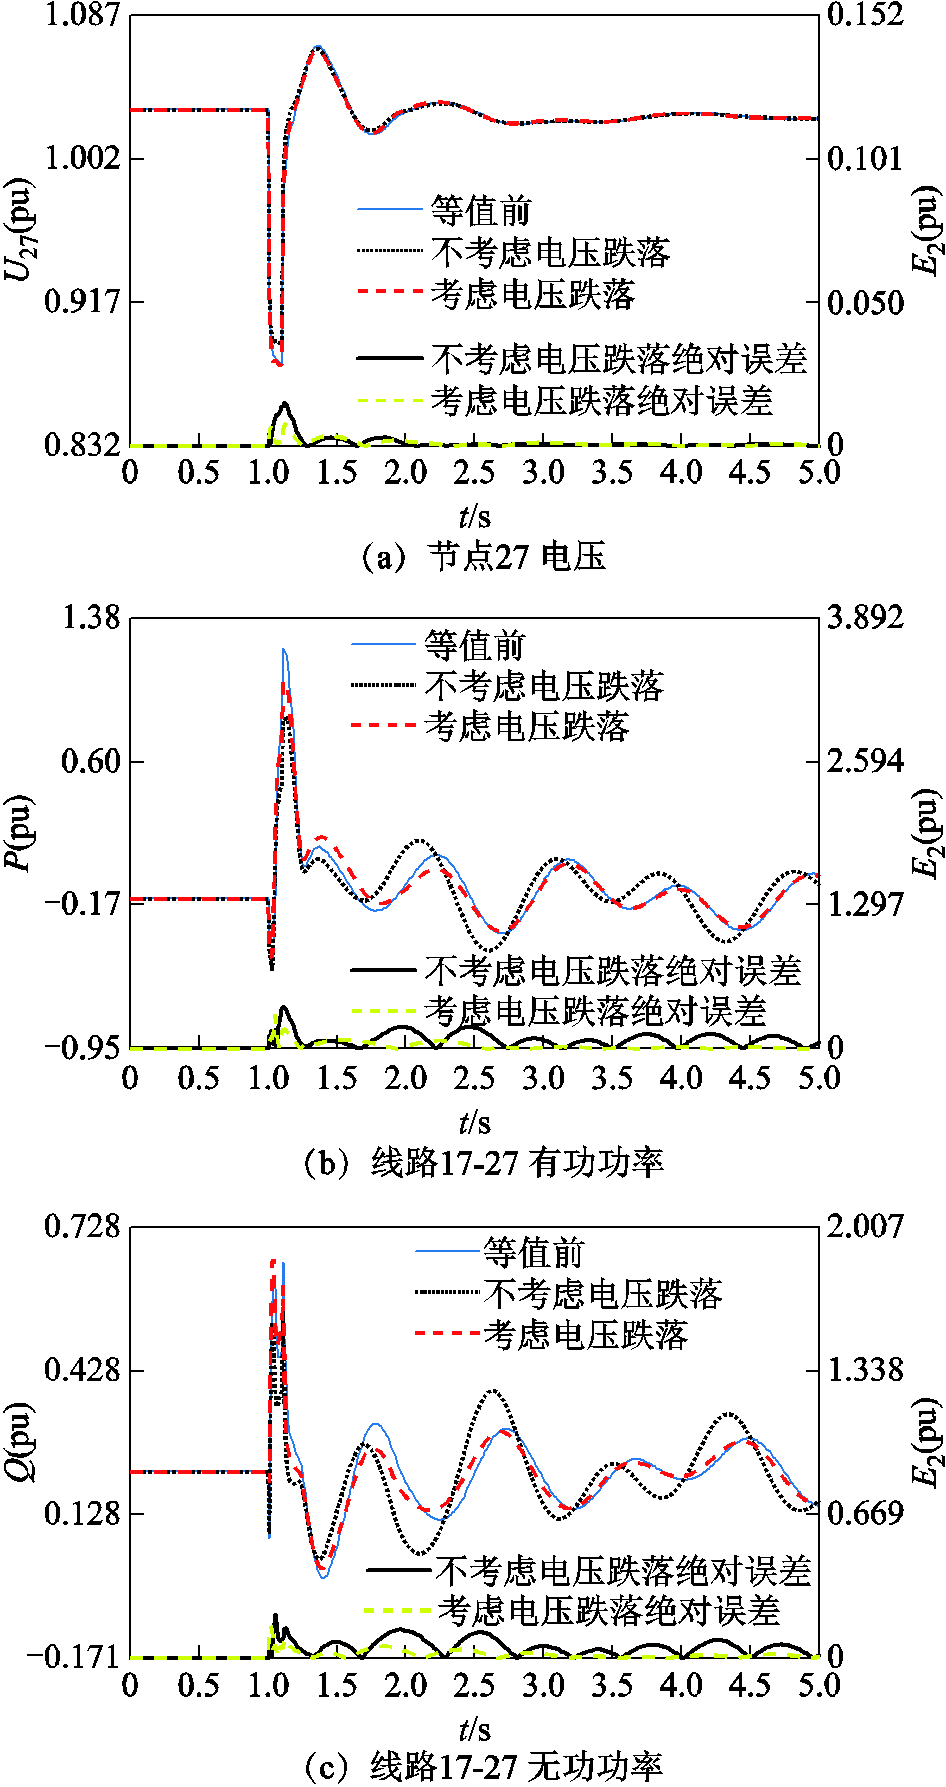
图13 扰动3下边界节点电压和线路功率等值前后误差
Fig.13 Equivalent model error of boundary node voltage and tie-line power under new fault
表3 扰动3下考虑电压跌落深度分群前后等值模型方均根误差
Tab.3 The RMS error of the two clustering methods under disturbance 3
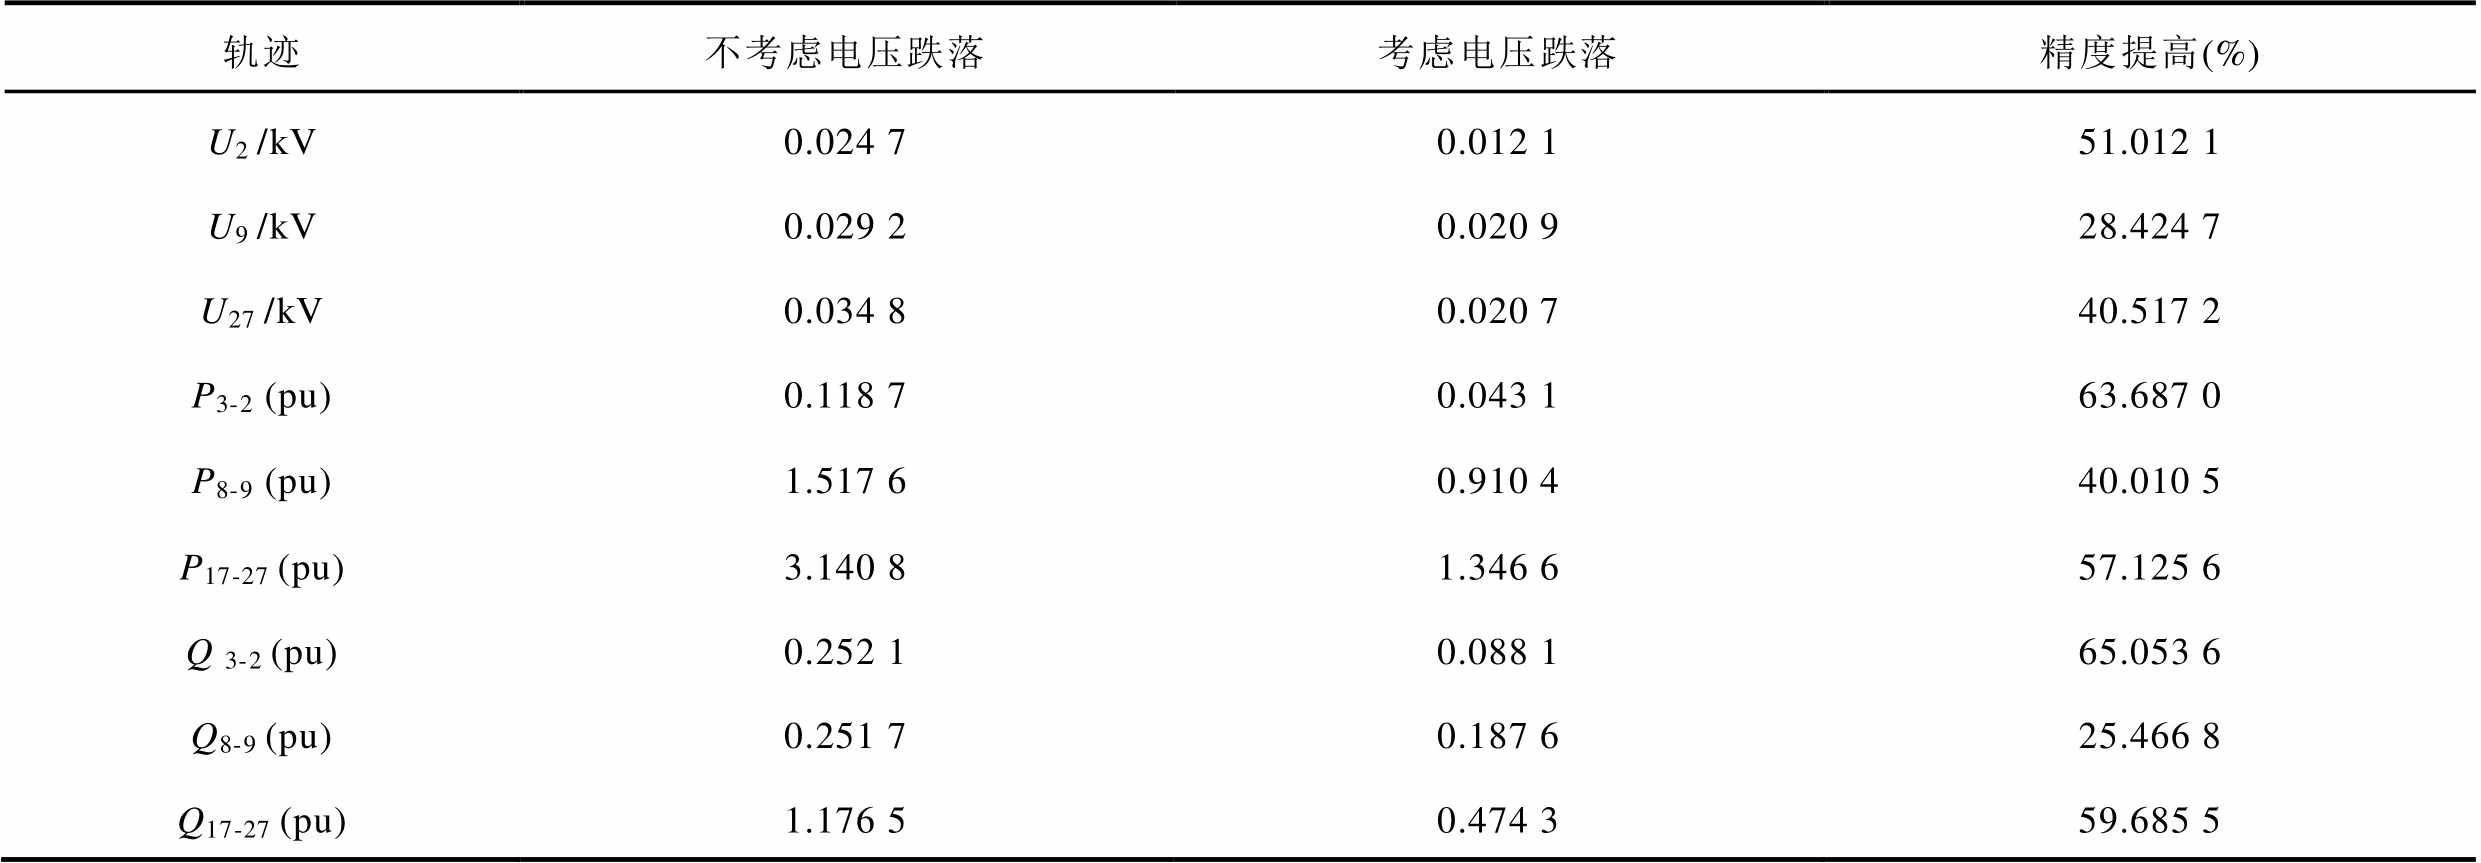
轨迹不考虑电压跌落考虑电压跌落精度提高(%) U2 /kV0.024 70.012 151.012 1 U9 /kV0.029 20.020 928.424 7 U27 /kV0.034 80.020 740.517 2 P3-2 (pu)0.118 70.043 163.687 0 P8-9 (pu)1.517 60.910 440.010 5 P17-27 (pu)3.140 81.346 657.125 6 Q 3-2 (pu)0.252 10.088 165.053 6 Q8-9 (pu)0.251 70.187 625.466 8 Q17-27 (pu)1.176 50.474 359.685 5
从图13和表3可以看出:扰动3下,由于电压跌落较深,且同群内感应电动机近区的部分光伏电源{20, 23}进入LVRT状态,此时进一步考虑电压跌落程度的分群方法,其等值模型误差最小,说明所提分群方法具有较高的适应性。
上述分群方法不仅适用于含光伏电源的电力系统,当感应电动机近区有大量的风电时,可得到上述相同的结论。限于篇幅,这里不再详细展开。
西藏中部电网通过1回±400 kV直流线路与西北电网相连,同时与四川电网交流互联。西藏中部电网常规电源占比较小,而“十三五”新增工业负荷占比又较大。本文针对含高比例光伏电源的藏中电网,进行了感应电动机的动态等值。图14为西藏中部电网待等值部分及外部电网,仿真平台为PSASP,其中节点白朗、城区、岗巴、江孜、康马、浪卡子、洛扎、日喀则、亚东、宇拓为含感应电机的综合负荷,静态负荷采用恒阻抗负荷;节点大有、岗开、国策、华电、江华、江江、康力为光伏电源;节点塘河、强旺、满拉、拉郊为同步发电机。
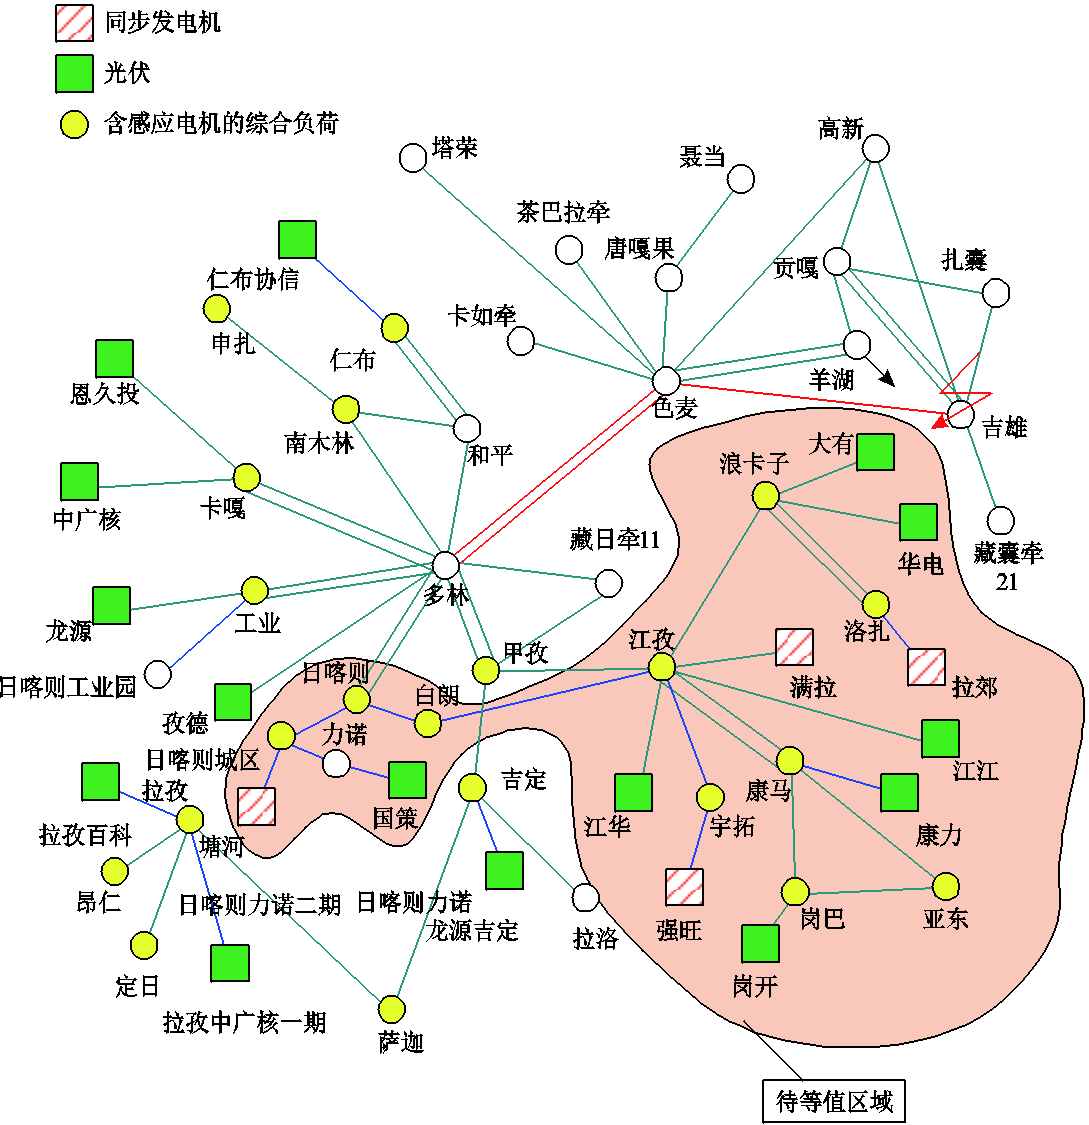
图14 西藏中部电网待等值区域
Fig.14 The equivalent part of Xizang power grid
故障设置为t=1 s节点吉雄发生接地电抗为0.71(pu)的三相短路,故障持续0.1 s后消失,各感应电动机母线电压的受扰轨迹如图15所示,此时光伏电源国策进入LVRT,其余光伏电源都没有进入LVRT状态。
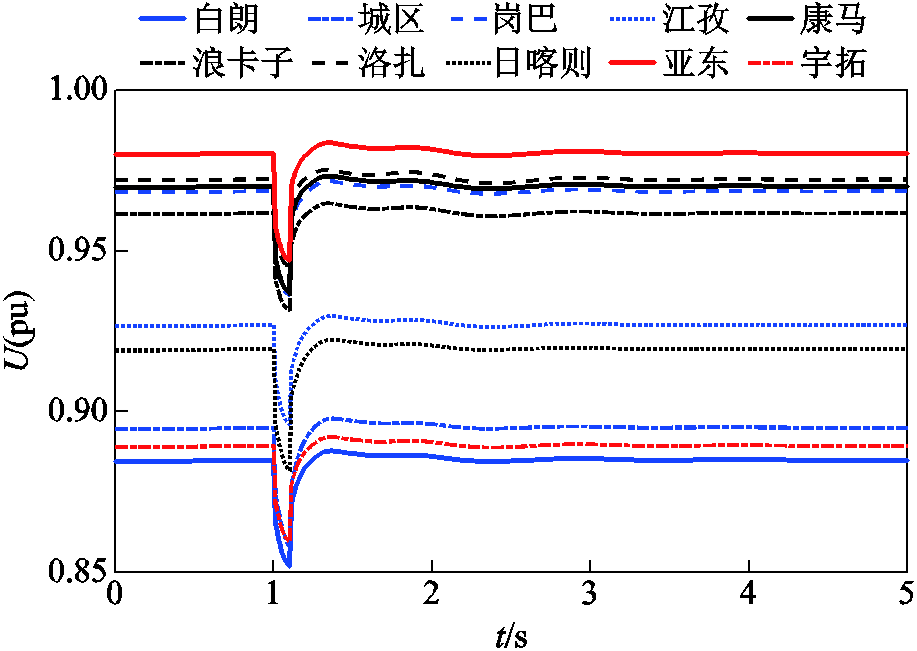
图15 感应电动机端口电压响应轨线
Fig.15 The voltage respnonses of induction motors
计算各感应电动机的特征根距离及受扰后感应电动机端口电压波动的相似性距离,可以得出特征根距离接近,且电压波动相似性距离较小,因此待等值区域内感应电动机先分为1群。
进一步分析故障期间各感应电动机的电压跌落深度,可知节点{白朗,城区,江孜,日喀则,宇拓}的电压故障期间低于0.9Un,因此可将机组分为两群,分别为:群1{岗巴,康马,浪卡子,洛扎,亚东},群2{白朗,城区,江孜,日喀则,宇拓}。
图16、图17分别给出了考虑电压跌落深度分群方法下,边界节点多林和甲孜的电压,边界线路日喀则-多林和江孜-甲孜的有功功率和无功功率受扰轨迹。
考虑电压跌落深度后光伏节点国策等值误差如图18所示。考虑电压跌落深度分群前后等值模型方均根误差见表4。
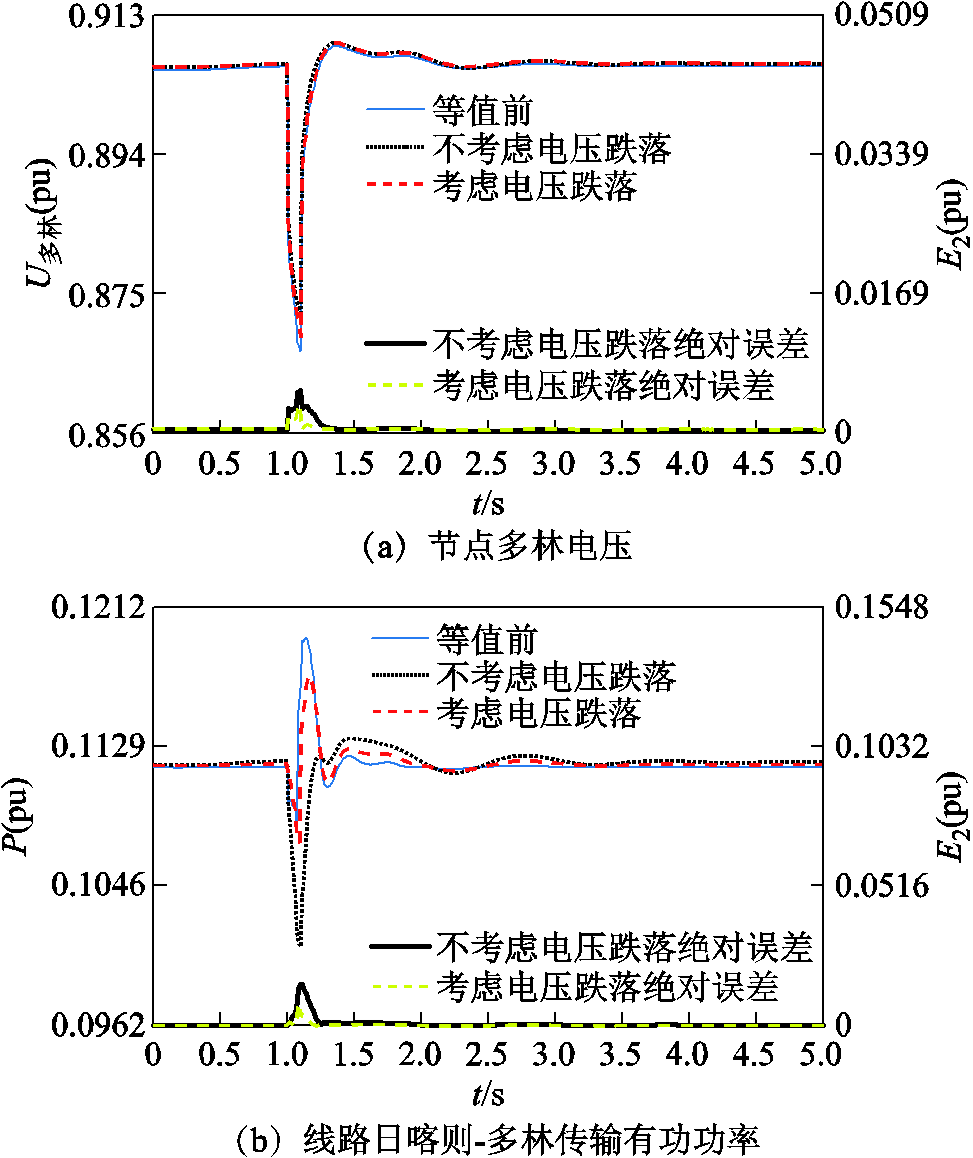
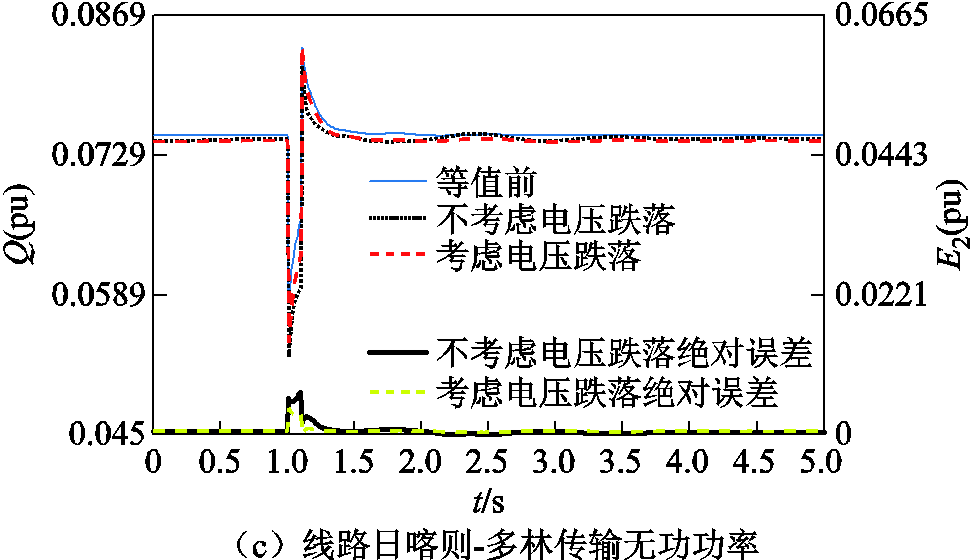
图16 边界节点多林和线路日喀则-多林的等值误差
Fig.16 Equivalent error of boundary node duolin and line rikaze-duolin after considering voltage dip depth
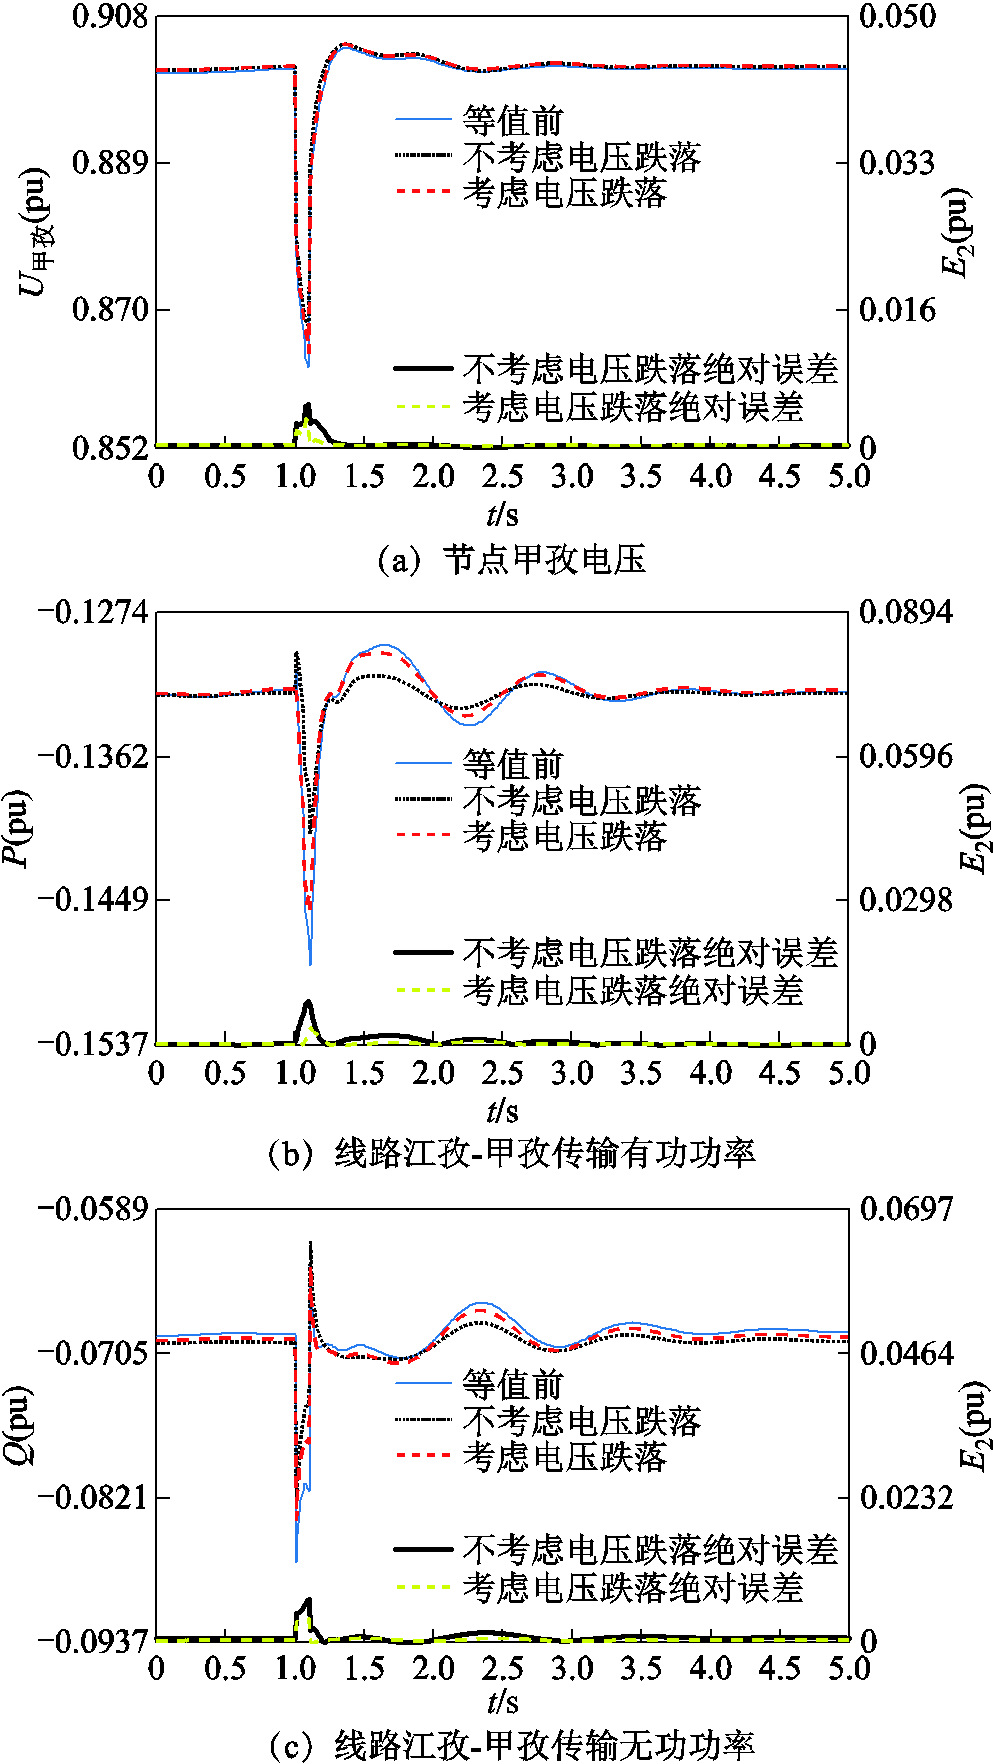
图17 边界节点甲孜和线路江孜-甲孜的等值误差
Fig.17 Equivalent error of node jiazi and line jiangzi-jiazi after considering voltage dip depth
由此可见,在实际电网中,本文所提进一步考虑电压跌落程度的分群方法,其等值模型误差最小,说明所提分群方法具有较高的适应性。
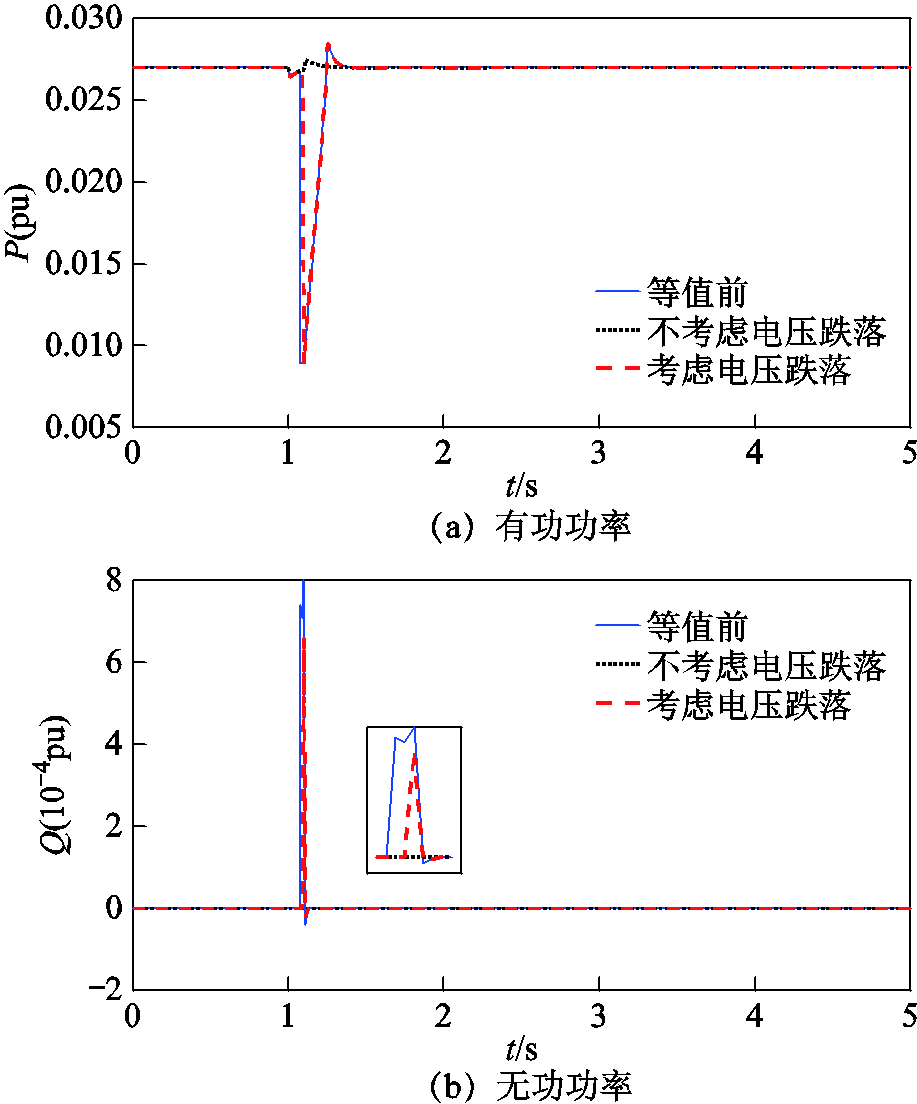
图18 考虑电压跌落深度后光伏节点国策等值误差
Fig.18 Equivalent error of node GuoCe after considering voltage dip depth
表4 考虑电压跌落深度分群前后等值模型方均根误差
Tab.4 The RMS error of the two clustering methods before and after considering voltage dip depth of an actual system

轨迹不考虑电压跌落考虑电压跌落精度提高(%) 0.003 90.002 729.612 6 0.003 90.002 729.421 7 0.080 70.028 564.689 8 0.042 00.014 864.815 3 0.059 20.043 626.362 8 0.072 90.041 443.244 2
本文针对含高比例新能源电力系统中感应电动机动态分群问题,提出了综合感应电动机小扰动动态特性、受扰后机端电压动态相似性和受扰期间机端电压跌落程度的感应电动机动态分群方法。
首先,分析了感应电动机与电网的动态交互作用,指出在对感应电动机动态分群时,同时考虑机网动态交互作用的分群方法有利于提高等值建模的精度。
针对含高比例光伏电源的电力系统,发现当同群内感应电动机近区有光伏电源,且有部分光伏电源进入LVRT状态时,如果分群时兼顾考虑故障期间感应电动机端口电压的跌落深度,可进一步提升感应电动机的等值建模精度。通过分析不同扰动等值模型的误差说明了本文所提建模方法的可行性和适应性。
附 录
表1 感应电动机参数
App.Tab.1 Induction motor parameters
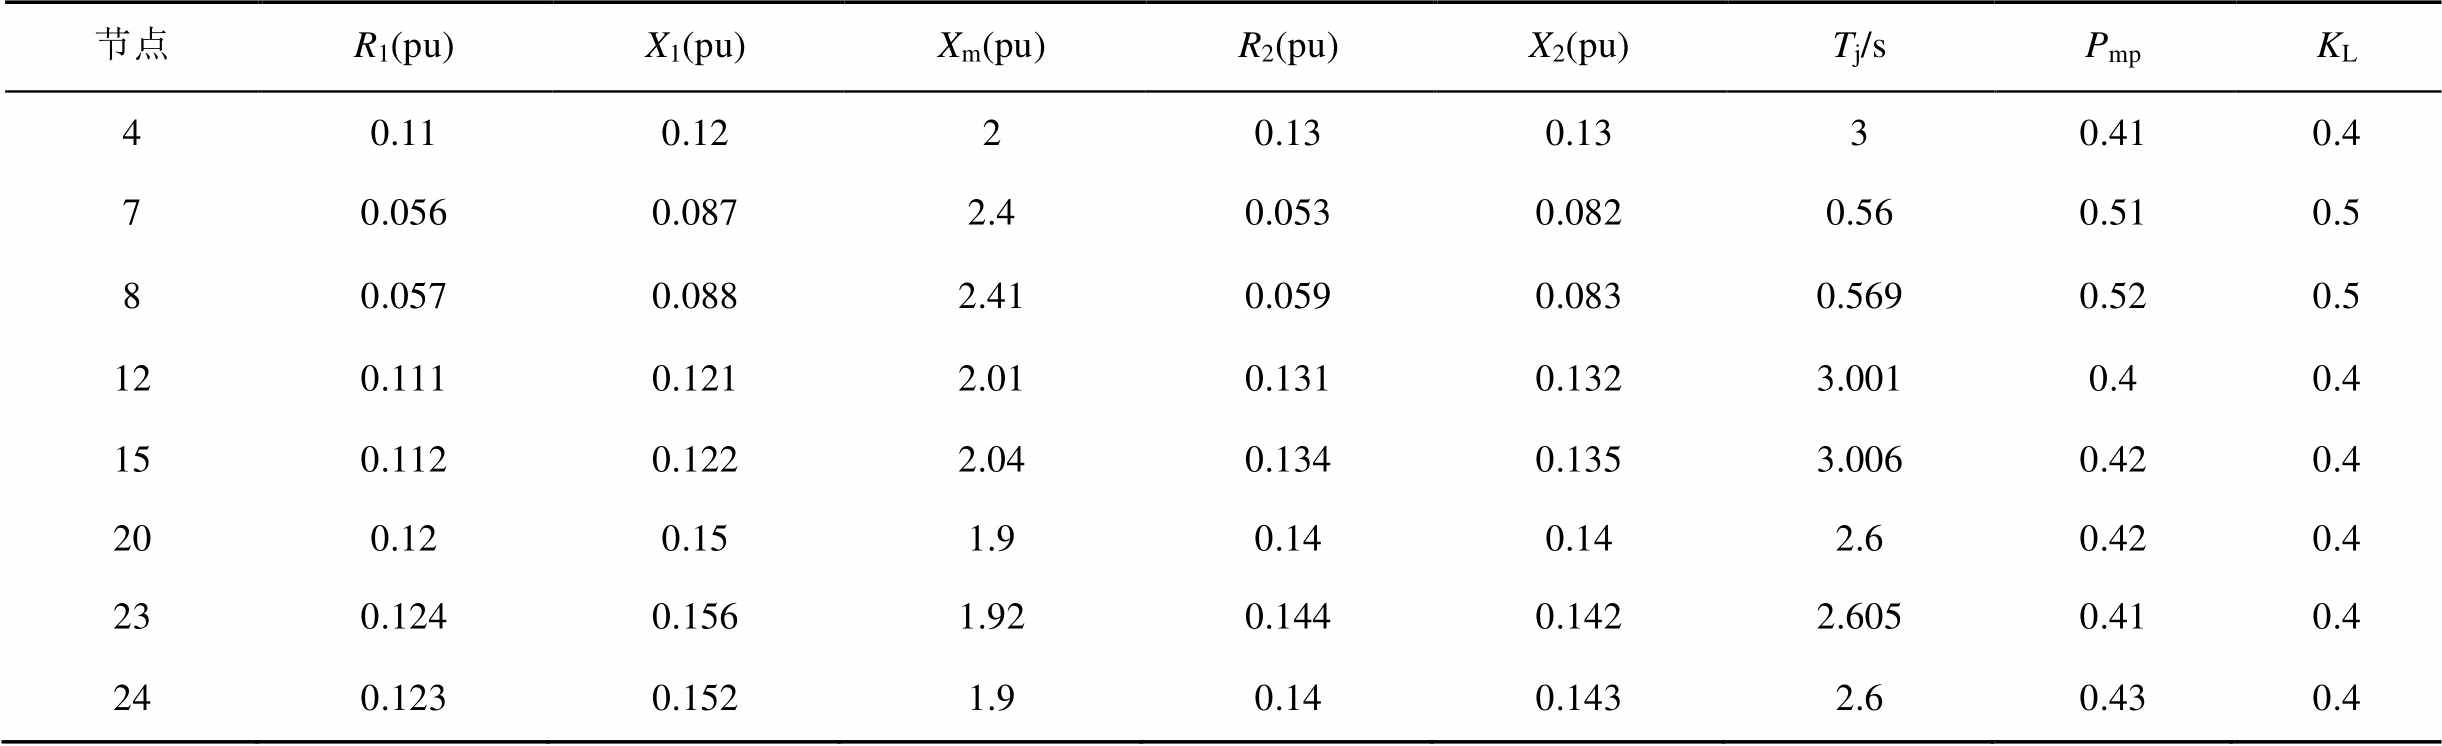
节点R1(pu)X1(pu)Xm(pu)R2(pu)X2(pu)Tj/sPmpKL 40.110.1220.130.1330.410.4 70.0560.0872.40.0530.0820.560.510.5 80.0570.0882.410.0590.0830.5690.520.5 120.1110.1212.010.1310.1323.0010.40.4 150.1120.1222.040.1340.1353.0060.420.4 200.120.151.90.140.142.60.420.4 230.1240.1561.920.1440.1422.6050.410.4 240.1230.1521.90.140.1432.60.430.4
附表2 感应电动机的特征根
App.Tab.2 Eigenvalues of induction motors
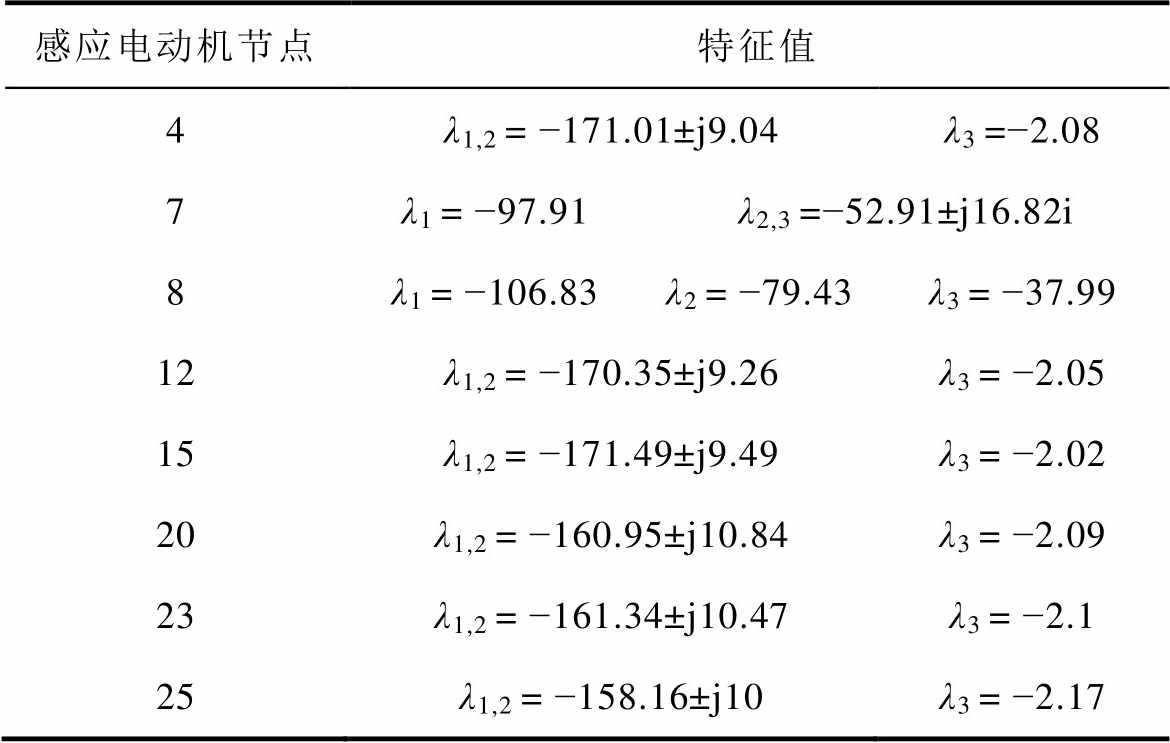
感应电动机节点特征值 4λ1,2 = −171.01±j9.04λ3 =−2.08 7λ1 = −97.91λ2,3 =−52.91±j16.82i 8λ1 = −106.83λ2 = −79.43λ3 = −37.99 12λ1,2 = −170.35±j9.26λ3 = −2.05 15λ1,2 = −171.49±j9.49λ3 = −2.02 20λ1,2 = −160.95±j10.84λ3 = −2.09 23λ1,2 = −161.34±j10.47λ3 = −2.1 25λ1,2 = −158.16±j10λ3 = −2.17
附表3 感应电动机的特征根距离
App.Tab.3 Distance of eigenvalue between induction motors
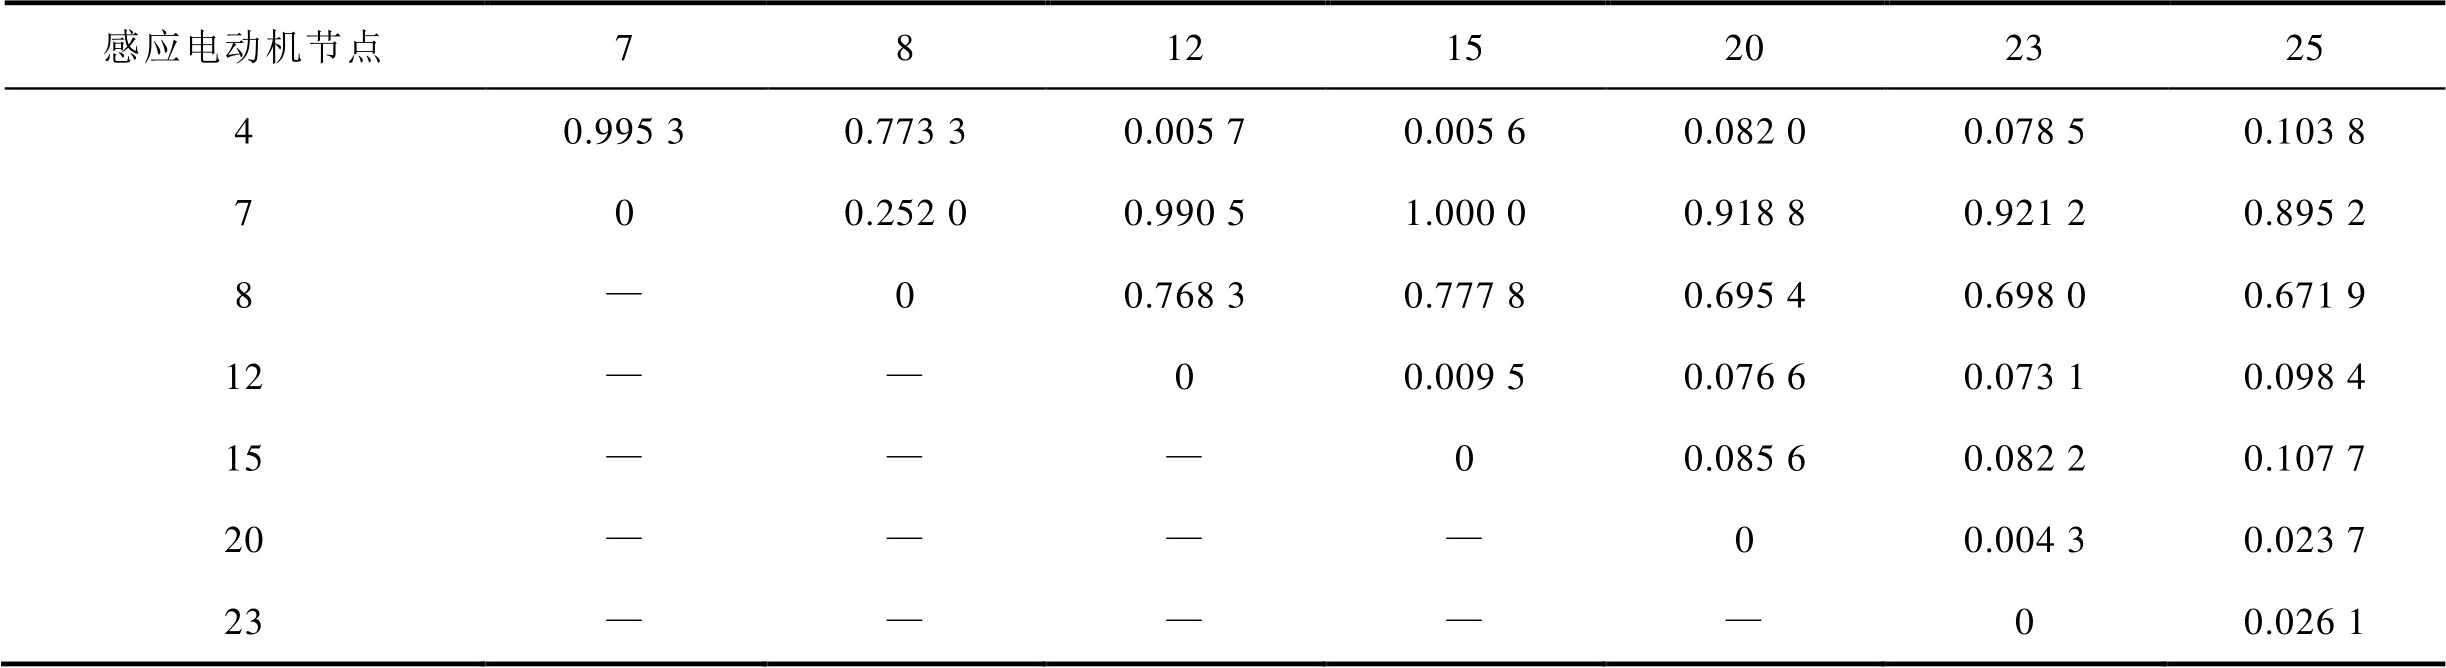
感应电动机节点781215202325 40.995 30.773 30.005 70.005 60.082 00.078 50.103 8 700.252 00.990 51.000 00.918 80.921 20.895 2 8—00.768 30.777 80.695 40.698 00.671 9 12——00.009 50.076 60.073 10.098 4 15———00.085 60.082 20.107 7 20————00.004 30.023 7 23—————00.026 1
附表4 电压波动相似性距离
App.Tab.4 Distance of voltage fluctuation similarity

感应电动机节点781215202325 40.001 30.001 70.000 30.001 30.002 20.002 30.001 8 700.000 40.001 40.002 60.003 40.003 60.003 1 8—00.001 80.002 90.003 80.003 90.003 4 12——00.001 20.002 10.002 30.001 7 15———00.001 00.001 00.000 5 20————00.000 60.000 7 23—————00.000 5
附表5 等值感应电动机的模型参数
App.Tab.5 Model parameters of equivalent induction motors
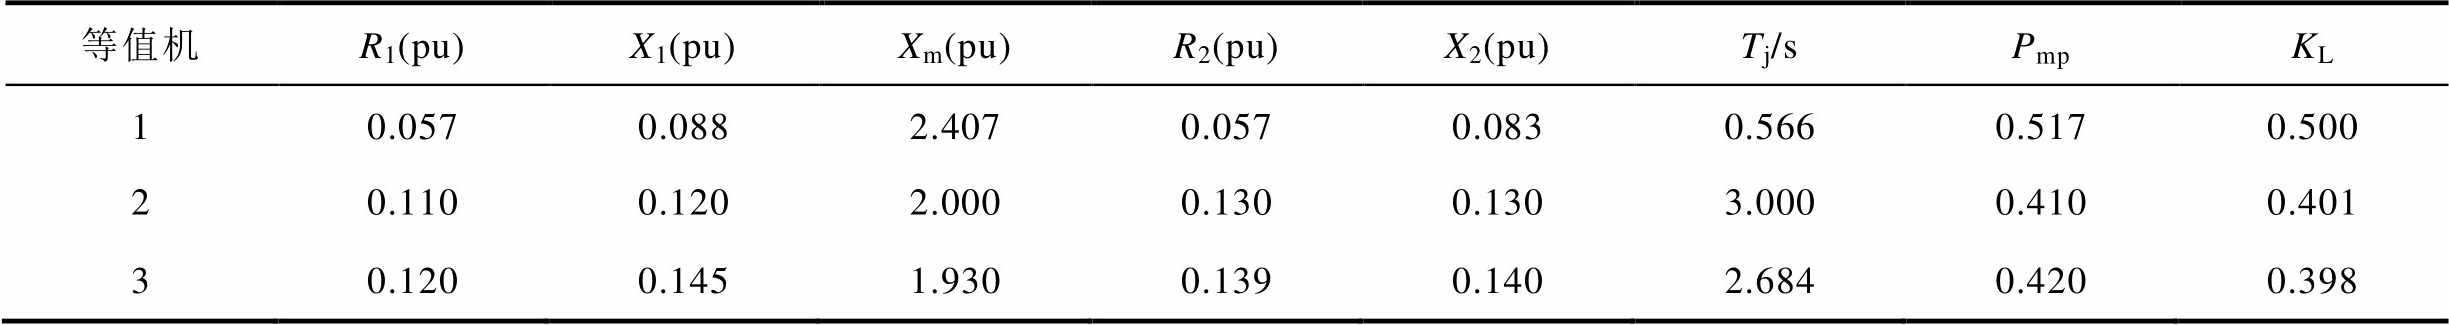
等值机R1(pu)X1(pu)Xm(pu)R2(pu)X2(pu)Tj/sPmpKL 10.0570.0882.4070.0570.0830.5660.5170.500 20.1100.1202.0000.1300.1303.0000.4100.401 30.1200.1451.9300.1390.1402.6840.4200.398
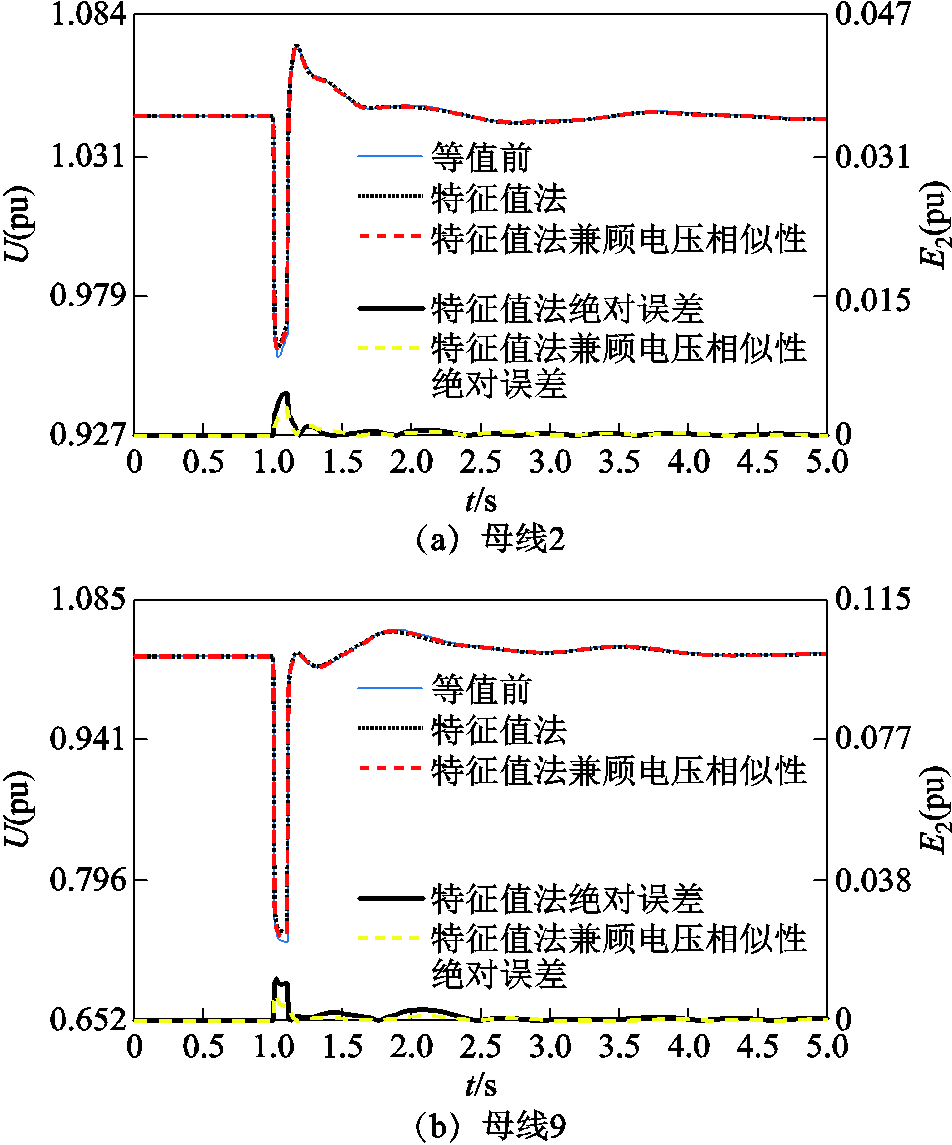
附图1 扰动1下综合特征根距离和端口电压动态相似性分群时等值前后母线2和母线9的电压波形
App.Fig.1 Voltage of bus-2 and bus-9 before and after equivalence under disturbance 1 based on the clustering method by combining the eigenvalue distance and the terminal voltage’s dynamic similarity
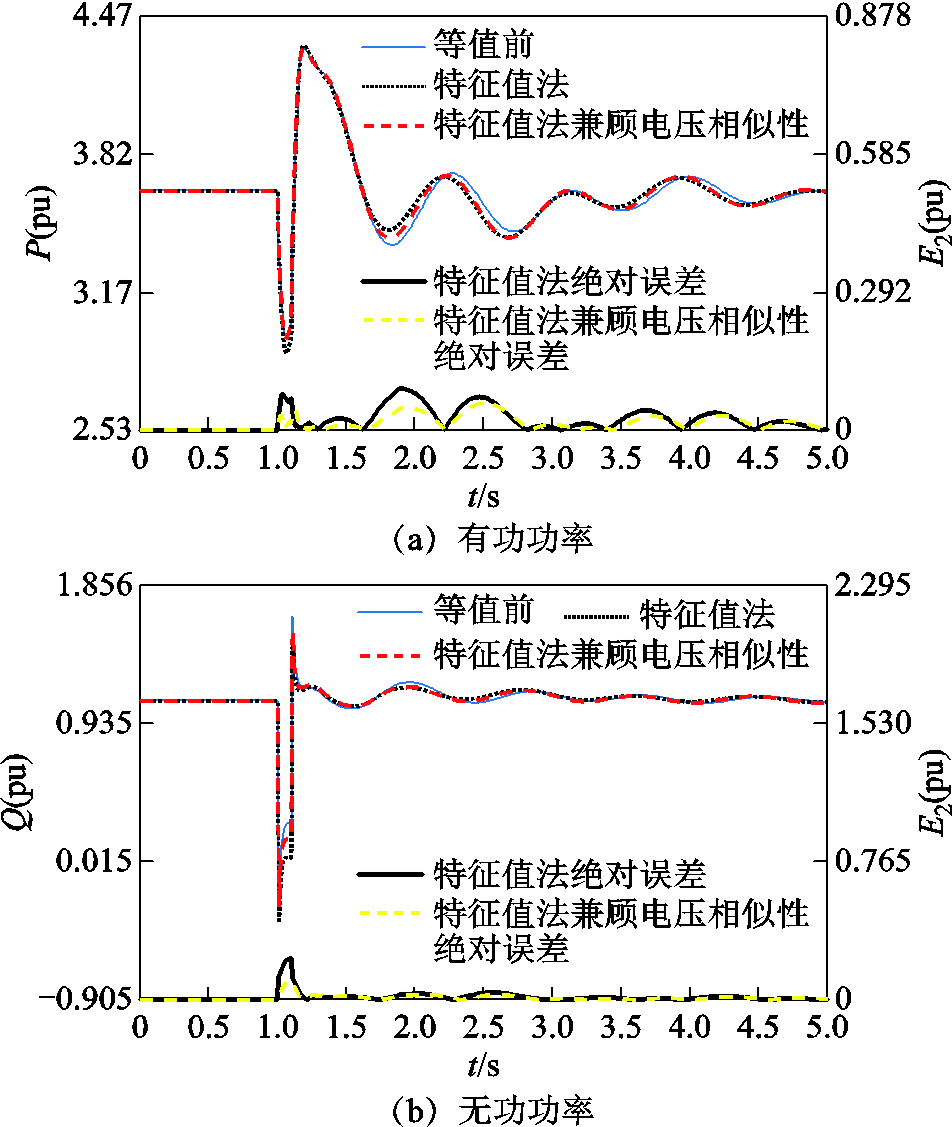
附图2 扰动1下综合特征根距离和端口电压动态相似性分群时等值前后线路3-2功率波形
App.Fig.2 Power responses of transmission line 3-2 before and after equivalence under disturbance 1 based on the clustering method by combining the eigenvalue distance and the terminal voltage’s dynamic similarity
附图3 扰动1下综合特征根距离和端口电压动态相似性分群时等值前后线路8-9功率波形
App.Fig.3 Power responses of transmission line 8-9 before and after equivalence under disturbance 1 based on the clustering method by combining the eigenvalue distance and the terminal voltage’s dynamic similarity
附图4 扰动2下综合特征根距离和端口电压动态相似性分群时等值前后母线2和母线9的电压波形
App.Fig.4 Voltage of bus-2 and bus-9 before and after equivalence under disturbance 2 based on the clustering method by combining the eigenvalue distance and the terminal voltage’s dynamic similarity

附图5 扰动2下综合特征根距离和端口电压动态相似性分群时等值前后线路3-2功率波形
App.Fig.5 Power responses of transmission line 3-2 before and after equivalence under disturbance 1 based on the clustering method by combining the eigenvalue distance and the terminal voltage’s dynamic similarity
附图6 扰动2下综合特征根距离和端口电压动态相似性分群时等值前后线路8-9功率波形
App.Fig.6 Power responses of transmission line 8-9 before and after equivalence under disturbance 2 based on the clustering method by combining the eigenvalue distance and the terminal voltage’s dynamic similarity
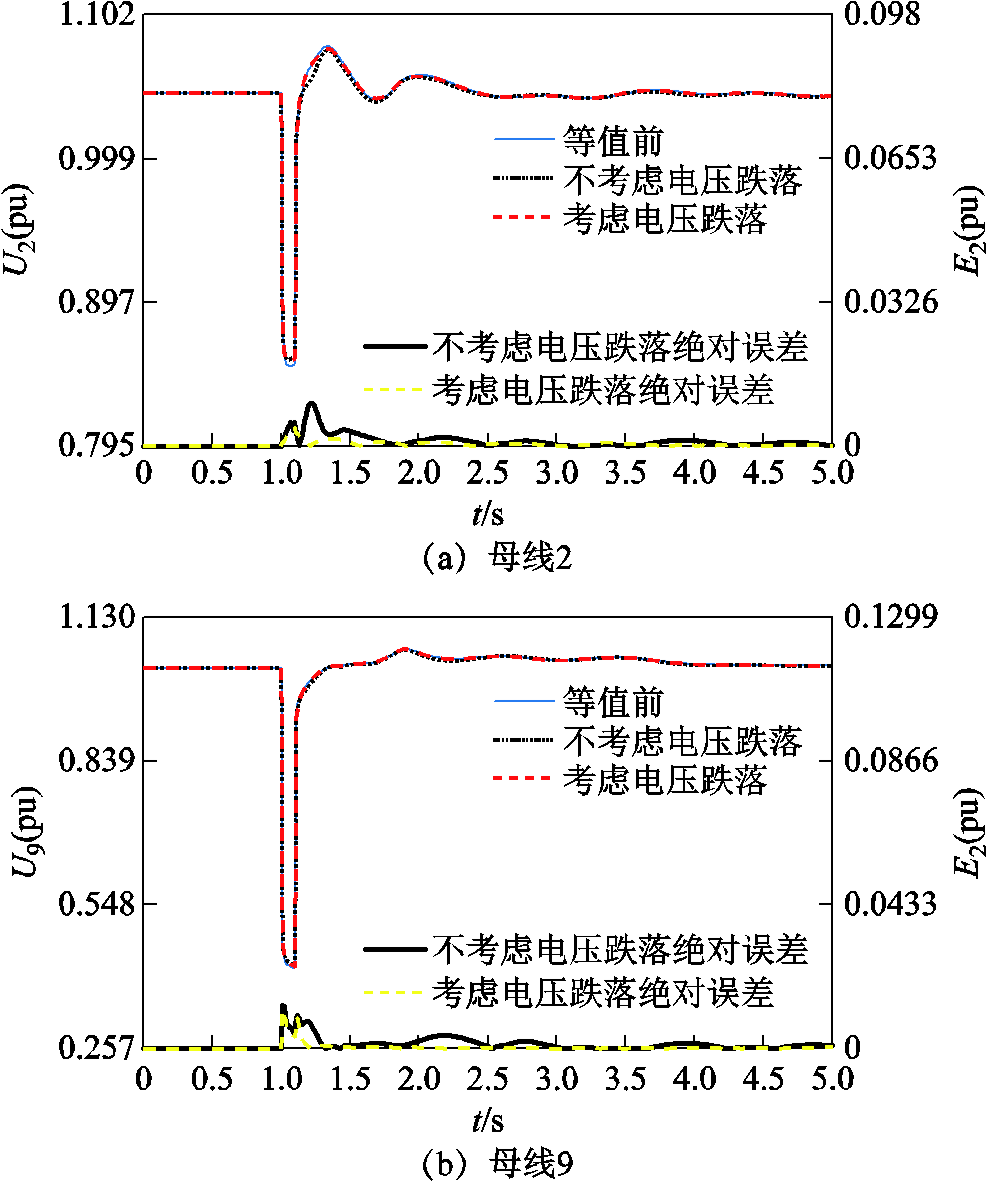
附图7 扰动2下本文分群方法时等值前后母线2和母线9的电压波形
App.Fig.7 Voltage of bus-2 and bus-9 before and after equivalence under disturbance 2 based on the proposed clustering method
附图8 扰动2下本文分群方法时等值前后线路3-2 功率波形
App.Fig.8 Power responses of transmission line 3-2 before and after equivalence under disturbance 2 based on the proposed clustering method

附图9 扰动2下本文分群方法时等值前后线路8-9功率波形
App.Fig.9 Power responses of transmission line 8-9 before and after equivalence under disturbance 2 based on the proposed clustering method
附图10 扰动3下本文分群方法时等值前后母线2和母线9的电压波形
App.Fig.10 Voltage of bus-2 and bus-9 before and after equivalence under disturbance 3 based on the proposed clustering method
附图11 扰动3下本文分群方法时等值前后线路3-2功率波形
App.Fig.11 Power responses of transmission line 3-2 before and after equivalence under disturbance 3 based on the proposed clustering method
附图12 扰动3下本文分群方法时等值前后线路8-9功率波形
App.Fig.12 Power responses of transmission line 8-9 before and after equivalence under disturbance 3 based on the proposed clustering method
参考文献
[1] Kosterev D N, Taylor C W, Mittelstadt W A. Model validation for the August 10, 1996 WSCC system outage[J]. IEEE Transactions on Power Systems, 1999, 14(3): 967-979.
[2] 刘一锋, 周小平, 洪乐荣, 等. 虚拟惯性控制的负荷变换器接入弱电网的序阻抗建模与稳定性分析[J]. 电工技术学报, 2021, 36(4): 843-856. Liu Yifeng, Zhou Xiaoping, Hong Lerong, et al. Sequence impedance modeling and stability analysis of load converter with virtual inertia control connected to weak grid[J]. Transactions of China Electrotechnical Society, 2021, 36(4): 843-856.
[3] 张明远, 史黎明, 郭科宇, 等. 分段长初级双边直线感应电动机建模分析[J]. 电工技术学报, 2021, 36(11): 2344-2354. Zhang Mingyuan, Shi Liming, Guo Keyu, et al. Modeling and analysis of segmented long primary double-sided linear induction motor[J]. Transactions of China Electrotechnical Society, 2021, 36(11): 2344-2354.
[4] 梁涛, 周宁, 卢天琪, 等. 感应电动机负荷暂态模型的参数填补方法及典型参数分析[J]. 电力系统自动化, 2020, 44(1): 74-82. Liang Tao, Zhou Ning, Lu Tianqi, et al. Parameter imputation methods and typical parameter analysis of load transient model of induction motor[J]. Automation of Electric Power Systems, 2020, 44(1): 74-82.
[5] 廖卫平, 张艳, 冯佳伟, 等. 考虑不对称故障影响的感应电动机负荷动态特性快速解析算法[J]. 电工技术学报, 2020, 35(19): 4183-4193. Liao Weiping, Zhang Yan, Feng Jiawei, et al. Fast analytical method for calculating the dynamic performance of induction-motor loads considering the effect of asymmetrical fault[J]. Transactions of China Electrotechnical Society, 2020, 35(19): 4183-4193.
[6] 夏云彦, 周洲, 邵远亮, 等. 基于动态磁网络法大型感应电动机阻抗参数及起动特性计算[J/OL]. 电工技术学报, 2023. https://doi.org/10.19595/j.cnki. 1000-6753.tces.230717. Xia Yunyan, Zhou Zhou, Shao Yuanliang, et al. Calculation of impedance parameters and starting characteristics of large induction motor based on dynamic magnetic network[J/OL]. Transactions of China Electro technical Society, 2023. https://doi.org/ 10.19595/j.cnki. 1000-6753.tces.230717.
[7] 赵兵, 汤涌, 张文朝. 感应电动机群单机等值算法研究[J]. 中国电机工程学报, 2009, 29(19): 43-49. Zhao Bing, Tang Yong, Zhang Wenchao. Study on single-unit equivalent algorithm of induction motor group[J]. Proceedings of the CSEE, 2009, 29(19): 43-49.
[8] Pedra J, Sainz L, Corcoles F. Study of aggregate models for squirrel-cage induction motors[J]. IEEE Transactions on Power Systems, 2005, 20(3): 1519-1527.
[9] 张景超, 张承学, 鄢安河, 等. 基于自组织神经网络和稳态模型的多台感应电动机聚合方法[J]. 电力系统自动化, 2007, 31(11): 44-48, 86. Zhang Jingchao, Zhang Chengxue, Yan Anhe, et al. Aggregation of multi induction motors based on the self-organized neural network and steady state model[J]. Automation of Electric Power Systems, 2007, 31(11): 44-48, 86.
[10] Mat Zali S, Milanović J V. Generic model of active distribution network for large power system stability studies[J]. IEEE Transactions on Power Systems, 2013, 28(3): 3126-3133.
[11] Liu Yuan, Vittal V, Undrill J. Performance-based linearization approach for modeling induction motor drive loads in dynamic simulation[J]. IEEE Transactions on Power Systems, 2017, 32(6): 4636-4643.
[12] 周海强, 鞠平, 杨辉, 等. 计及电动机负荷的互联电网动态等值方法[J]. 中国科学: 技术科学, 2010, 40(6): 704-710. Zhou Haiqiang, Ju Ping, Yang Hui, et al. Dynamic equivalence method of interconnected power grid considering motor load[J]. Scientia Sinica (Technologica), 2010, 40(6): 704-710.
[13] 廖庭坚, 刘光晔, 雷强, 等. 计及电动机负荷的电力系统动态等值分析[J]. 电网技术, 2016, 40(5): 1442-1446. Liao Tingjian, Liu Guangye, Lei Qiang, et al. Analysis of dynamic equivalence with consideration of motor loads in power systems[J]. Power System Technology, 2016, 40(5): 1442-1446.
[14] 周海强, 鞠平, 宋忠鹏, 等. 基于动态相似度与等值缓冲区的电动机动态等值方法[J]. 电力系统自动化, 2010, 34(13): 24-27, 54. Zhou Haiqiang, Ju Ping, Song Zhongpeng, et al. A dynamic equivalent method for induction motors based on dynamic similarity and buffer zone[J]. Automation of Electric Power Systems, 2010, 34(13): 24-27, 54.
[15] 张剑, 孙元章, 徐箭, 等. 基于同调性的电动机动态聚合方法[J]. 电力系统自动化, 2010, 34(5): 48-52. Zhang Jian, Sun Yuanzhang, Xu Jian, et al. A dynamic aggregation method for induction motors based on their coherent characteristics[J]. Automation of Electric Power Systems, 2010, 34(5): 48-52.
[16] 戴丽丽, 黄小庆, 曹一家, 等. 计及系统稳定性和电磁特性的电动机聚合方法[J]. 电力系统及其自动化学报, 2016, 28(2): 15-21. Dai Lili, Huang Xiaoqing, Cao Yijia, et al. Aggregation method of induction motors considering system stability and electromechanical transient characteristics[J]. Proceedings of the CSU-EPSA, 2016, 28(2): 15-21.
[17] 陈烨, 程祥, 吴浩, 等. 计及静态临界稳定特性的感应电动机群聚合等值方法[J]. 电网技术, 2017, 41(9): 2964-2973. Chen Ye, Cheng Xiang, Wu Hao, et al. Aggregation of induction motor group considering physical characteristics and static critical stable characteristics[J]. Power System Technology, 2017, 41(9): 2964-2973.
[18] 王增平, 李菁, 郑涛, 等. 考虑变流器限流与GSC电流的双馈风力发电机暂态全电流计算与分析[J]. 电工技术学报, 2018, 33(17): 4123-4135. Wang Zengping, Li Jing, Zheng Tao, et al. Calculation and analysis of transient short circuit current of doubly-fed induction generator considering convertor current limitation and GSC current[J]. Transactions of China Electrotechnical Society, 2018, 33(17): 4123-4135.
[19] 倪以信, 陈寿孙, 张宝霖. 动态电力系统的理论和分析[M]. 北京: 清华大学出版社, 2002.
Abstract With the continuous integration of large-scale of renewable energy, a high share of renewable energy is the main feature of the modern power systems. Since the converter controller of renewable generation has nonlinear modules such as current limiting and switching actions, the dynamic characteristics of the induction motor in the near area will be influenced by them. Therefore when there are a large number of renewable generation in the near area of the induction motor, the dynamic interaction between the renewable energy and the induction motor needs to be considered. However, there are few research on the impact of renewable generation on induction motor equivalent modeling presently. To address this issue, this paper presents a new dynamic clustering method of induction motors in power systems with a high share of renewable energy.
Firstly, the interaction between induction motor and power grid is analyzed, which shows that the power system interacts with the induction motor through its terminal voltage. Therefore, considering terminal voltage disturbed trajectories can improve the accuracy of equivalent model. The group-average method is used to quantify the similarity of terminal voltage fluctuation, and the similarity distance is applied to group the induction motors. Based on this, the clustering method that both considers the small disturbance dynamic similarity of induction motor and the dynamic similarity of the terminal voltage is proposed. The ultimate clustering result is obtained by dividing the intersection of the clustering results obtained by the two methods into a new group and the rest into a new group.
For the power systems with a high share of new energy, it is found that when there are renewable energy near the induction motors in the same cluster, and some of these renewable energy enters into the low voltage ride through (LVRT) during the fault, the dynamic characteristics of the induction motors in the same group will have significant differences. Therefore, a dynamic clustering method considering the voltage drop depth of induction motor is proposed. Therefore, the paper proposes the clustering method for induction motors, which combining of three factors of ① the small disturbance dynamic similarity of induction motor, ② the dynamic similarity of terminal voltage and ③ the clustering results of terminal voltage drop depth. Based on the clustering results obtained by these three methods, the intersection is divided into a new group, and the rest are divided into a new group respectively to obtain the final clustering results.
Based on the obtained clustering results of the induction motors, the power network is simplified according to the synchronous generator coherency-based equivalent method. The parameters of induction motor are aggregated by weighted average of each individual motor. Finally, the dynamic equivalence process of induction motors is elaborated by integrating the steps of motor clustering, parameter aggregation and power network simplification.
The following conclusions can be drawn from the 10-machine 39 node New England simulation system and the real power grid of Central Tibet: (1) Compared with classical clustering method based on the small disturbance dynamic similarity of induction motor, further considers the dynamic similarity of the terminal voltage can improve the dynamical equivalent accuracy of induction motors. (2)For the power system with high proportion of photovoltaic power, it is found that when there is photovoltaic power near the induction motor in the same group, and some of these photovoltaic power enters the LVRT state, the effects of the renewable energy on the dynamics of induction motors should be included. Therefore, the clustering method by further considers the terminal voltage drop depth can improve the equivalent accuracy of induction motors. (3) The feasibility and adaptability of the modeling method proposed in this paper are illustrated by analyzing the errors of the equivalent models under different disturbances.
keywords:Induction motor, dynamic equivalence, new energy power system, dynamic similarity, low voltage ride through (LVRT)
DOI:10.19595/j.cnki.1000-6753.tces.230054
中图分类号:TM614
国家自然科学基金资助项目(52077061)。
收稿日期 2023-01-13
改稿日期 2023-02-27
潘学萍 女,1972年生,教授,博士生导师,研究方向为新能源电力系统建模与分析。E-mail:xueping_pan @163.com(通信作者)
王卫康 男,1977年生,硕士研究生,研究方向为新能源发电系统建模。E-mail:1414168268@qq.com
(编辑 赫 蕾)