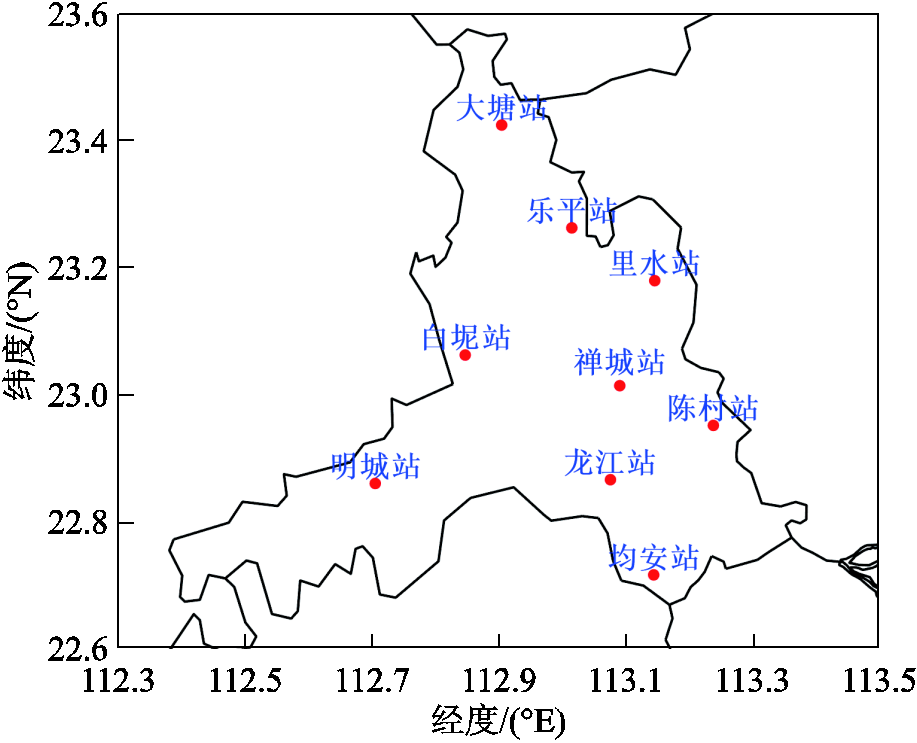
图1 全闪电定位系统
Fig.1 Total lightning location system
摘要 雷暴是威胁电力系统安全可靠运行的重要因素,监测雷暴活动可以为电力系统雷电防护提供雷暴活动路径及预警信息。该文提出一种组合八邻域雷暴跟踪算法及跟踪结果评估指标,并采用该算法对珠三角地区九次雷暴活动进行时空演变特征分析和定量评估。结果表明,九个雷暴活动共识别出大于18 min的轨迹1 490条,其中简单轨迹和含分裂合并过程的复杂轨迹各占一半。雷暴活动平均速度为51.4 km/h,速度中值为43.0 km/h,简单轨迹平均速度比复杂轨迹慢。评估指标命中率(POD)、虚假警报率(FAR)和临界成功指数(CSI)分别为64.3%、40.4%和42.7%,轨迹时长中值、平均轨迹偏差、非连贯性和平均合并分裂次数分别为24 min、2.80 km、0.032 7 s-1和2.51次。该方法可以很好地描述雷暴活动时空演变过程和评估跟踪结果,为雷电预警提供了有效手段。
关键词:雷暴活动 跟踪算法 评估指标 时空演变 组合八邻域
雷暴是严重威胁电力系统安全可靠运行的重要因素[1-4],超过60%的输电线路故障是由于雷击引起的[5-7]。目前电力系统输电走廊规划和线路防雷主要依据落雷密度和雷电日分布,通过降低杆塔接地电阻、安装避雷器等措施提高输电线路耐雷水平[8]。传统的雷电密度和雷暴日数量不能反映单个雷暴活动时空演变特征[9],雷电环境的精细化认识有助于优化防雷措施。精确地监测和跟踪雷暴活动轨迹与覆盖范围,研究雷暴活动规律,可以为电力系统提供雷电路径的实时雷电监测和预警服务[10],开拓以雷电预警技术为基础的输电线路差异化主动性雷电防护新思路,减少因雷击造成的经济损失。
雷电定位是雷暴活动监测的重要手段[11],可以实时测量观测区域内闪的电数量、地理坐标、时间及强度[12]。目前世界上有四十多个国家拥有雷电定位系统[13-16],监测雷击位置,统计年雷击密度。全闪电定位系统可以同时对雷暴活动中的云闪(Intra-Cloud, IC)和地闪(Cloud to Ground, CG)精确定位,为实时监测和跟踪雷暴活动提供技术支持。
在闪电跟踪算法中,闪电区域划分主要有两种方法,即聚类法和网格法。聚类法主要采用DBSCAN(density-based spatial clustering of applications with noise)算法及其改进算法将闪电事件聚类成簇。雷云趋势预测方法可以预测未来一段时间内云团覆盖区域及质心位置[17]。基于地闪数据,王羽等采用DBSCAN算法对比了引雷塔建设前后雷暴活动地闪轨迹的差异[18],这种方法将闪电数据作为散点处理,不易定量计算云团影响区域。
网格法将研究区域按照一定的网格尺寸和时间间隔划分,得到闪电密度网格图,该方法输入简洁,可以方便地统计分析雷电日、雷电小时、地闪密度等雷电参数[19],也可用于监测和跟踪雷暴活动,对雷暴活动的时空演变特征进行分析[20]。现有文献识别的闪电簇尺度约为几十甚至上百千米,网格细化程度不能完全适用输电线路尺度需求。
在跟踪结果评估方面,气象学中主要采用列联表法来评估雷达回波的跟踪结果,评估指标包括命中率(Probability of Detection, POD)、虚假警报率(False Alarm Rate, FAR)、临界成功指数(Critical Success Index, CSI)[21]。M. Dixon和G. Wiener应用列联表法评估美国科罗拉多地区夏季风暴6 min的预测结果,三个指标分别为83%、30%和61%[22]。M. Kohn采用k-mean聚类法对地中海地区全闪电轨迹进行跟踪,用列联表法评估30~120 min预测结果,研究表明预测时间越短,预测结果越准确[23]。这种评估方法关注相邻两个时间间隔的正确关联数量,缺乏闪电簇轨迹特征的量化评价指标,如轨迹时长、轨迹线性、轨迹连贯性及轨迹复杂性等。
为找到合适输电线路尺度的跟踪方法,本文基于珠三角全闪电定位系统的全闪电数据,结合全闪电数据离散特征和输电线路档距等尺寸,提出了一种组合八邻域的雷暴活动跟踪方法,分析了该地区九次雷暴活动时空演变特征,得到闪电簇面积、质心坐标、云地闪数量、移动方向、移动速度及时空演变轨迹。在列联表法的评估指标基础上,结合全闪电簇轨迹特征提出了轨迹特征评估指标,可以对不同跟踪方法的轨迹时长、轨迹线性、轨迹连贯性及轨迹复杂性进行量化评估。该跟踪方法可描述雷暴活动的时空演变过程及特征,为预测雷暴运动趋势,精细化雷电预警提供行之有效的方法。
广州位于珠三角腹地,是中国雷暴活动发生较为频繁的区域之一。全闪电定位系统采用甚低频/低频(Very Low Frequency/Low Frequency, VLF/LF)技术,对200 Hz~500 kHz频段电磁时域信号应用时差法(Time-of-Arrival, TOA)进行VLF/LF辐射源三维实时定位[24]。该系统由9个子站构成,每个子站探测范围为200 km,可区分云闪和地闪,并记录每个闪电事件的时间、位置、高度和极性等。9个子站地理分布如图1所示。

图1 全闪电定位系统
Fig.1 Total lightning location system
将全闪电雷电定位系统探测区域,即经度[112.5°E, 114.5°E]、纬度[22°N, 24°N]划分若干网格。网格尺寸为0.01°×0.01°[25],时间间隔长度设定为6 min。
对全闪电雷电定位数据进行网格化处理,得到全闪电密度图,在此基础上采用组合八邻域法对闪电簇进行识别、匹配,获得闪电簇运动轨迹和特征,跟踪算法流程如图2所示。
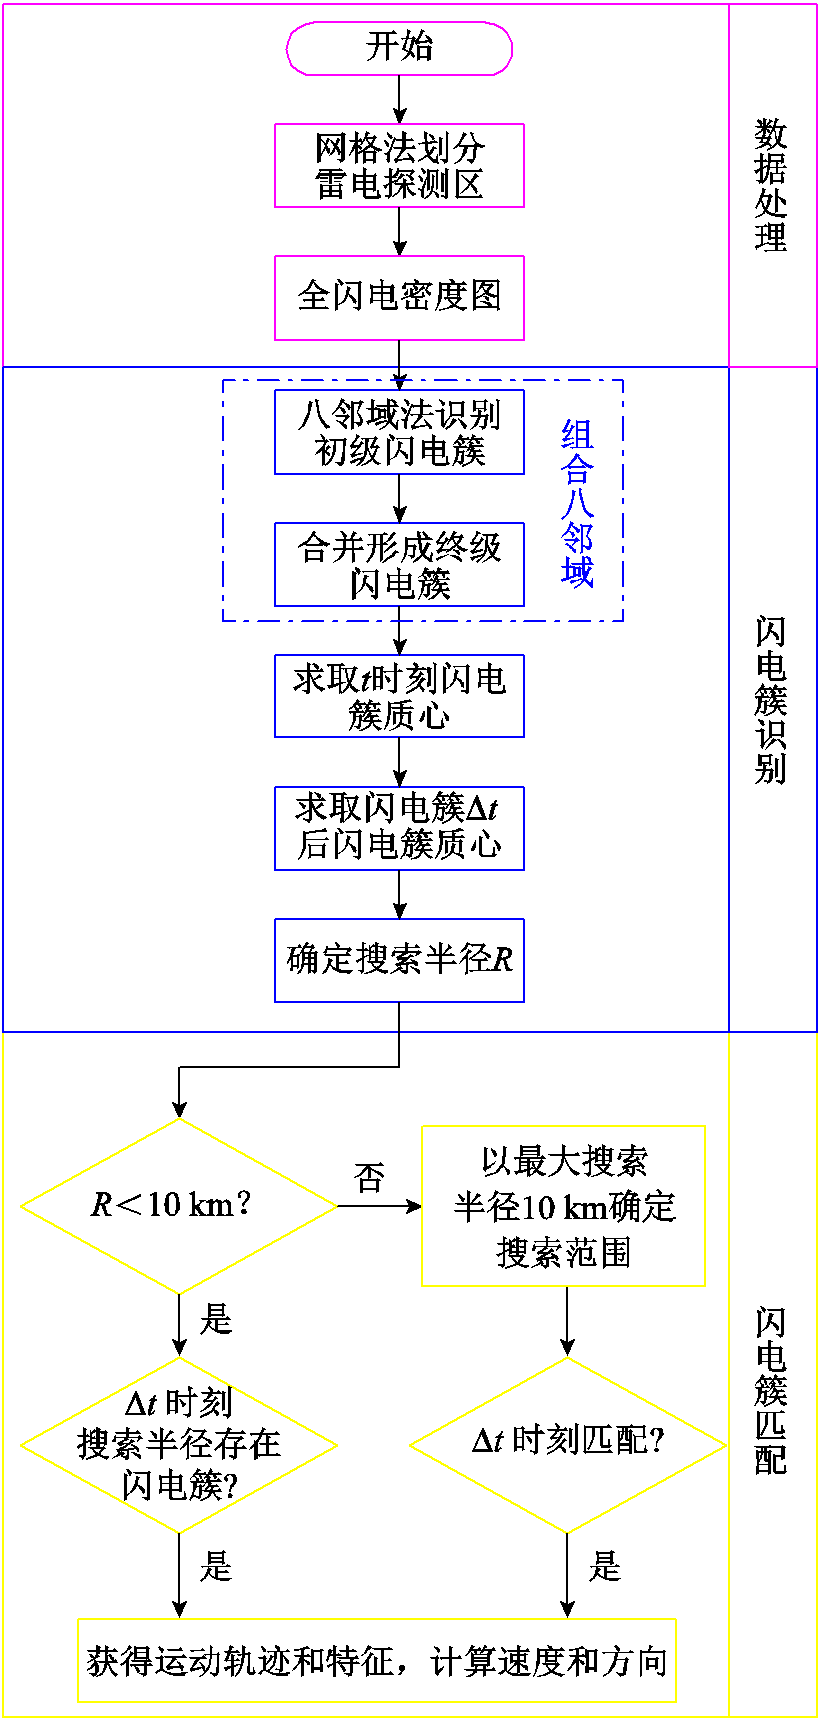
图2 闪电簇跟踪算法流程
Fig.2 Flow chart of lightning cluster tracking algorithm
选择一个网格作为中心网格,中心网格的上、下、左、右、左上、右上、左下、右下紧邻的位置和斜向相邻的位置有八个连通区域,称为八邻域,如图3a所示。采用八邻域法对全闪电密度图[26](见图3b)进行初始识别,形成初级闪电簇。
在全闪电密度图中,选择某个含有闪电事件的网格作为中心网格,然后查找该网格的八邻域。若八邻域网格内含有闪电事件,则将这些网格合并,并以新网格为中心继续寻找其八邻域网格是否存在闪电簇事件,直到再无网格含闪电事件为止。

图3 闪电簇识别算法
Fig. 3 Sketch of lightning cluster identification algorithm
用多边形拟合勾勒雷暴区域,形成初级闪电簇,设定闪电簇最小有效面积为3个网格。图3c中的闪电簇“3”“4”和“5”由于有效面积小于3被舍弃,不形成初级闪电簇。
由于输电线路的档距通常不大于500 m,5个档距的距离约为2.5 km,以2.5 km为半径的圆形面积约为19.63 km2。合并空间距离小于或等于2个网格的初级闪电簇得到终级闪电簇,面积中位数为16.94 km2,与输电线路5个档距覆盖面积相当。根据文献[25]对多邻域法(邻域数M=8, 24, 48, 80和120)和组合八邻域法(网格间距gap=0, 1, 2, 3和4)闪电簇的识别评估结果,组合八邻域法相对于邻域法闪电簇面积占比(闪电簇中含闪电事件的网格占闪电簇面积的百分比)显著提高。本文采用空间间距为2个网格距离的组合八邻域法,该方法得到的闪电簇面积虽与24邻域法闪电簇面积中值相当,但面积占比大约提高了19%,闪电簇更加紧密。此外24邻域法的闪电簇个数中值比组合八邻域法闪电簇个数中值大,组合八邻域法轨迹简单且计算量少。
图3d中的初级闪电簇“6”和“7”,以及初级闪电簇“8”和“9”,间距在2个或2个网格内,合并形成终级闪电簇,而初级闪电簇“1”和“2”之间距离为3个网格,则各自形成终级闪电簇。如图3e所示,对终级闪电簇进行椭圆拟合,得到终级闪电簇拟合椭圆的长半轴。在跟踪阶段,将此椭圆长半轴作为搜索半径。
闪电簇匹配包括预测闪电簇位置、确定搜索半径和闪电簇配对。将闪电簇拟合多边形质心坐标作为闪电簇的中心,采用上两个时间间隔的历史速度预测下一时间间隔闪电簇质心位置。在雷暴活动开始阶段,起始速度设为30 km/h[27]。
闪电簇的预测速度为上两个时间间隔速度的加权平均值。对于新生的闪电簇,预测速度则为上两个时间间隔平均速度的加权平均值。当闪电簇之间发生合并,时间间隔内的速度为参与合并的闪电簇面积的加权平均。定义时间间隔内所有配对成功的闪电簇平均速度和预测速度分别为
 (1)
(1)
 (2)
(2)
式中,v为配对闪电簇速度;SLC为闪电簇面积;vi,j为参与合并闪电簇的速度;Si,j为参与合并闪电簇的面积;k为历史速度权重。采用本文评估指标分析得到,历史速度权重k对跟踪结果几乎没有影响,本文设置k=0.8。
闪电簇匹配算法如图4所示。以t时刻闪电簇椭圆拟合的长半轴为搜索半径,当椭圆长半轴大于或等于10 km时,设置最大搜索半径阈值为10 km[28],在t+Δt时刻预测位置寻找是否存在闪电簇与t时刻闪电簇配对。若搜索半径范围内存在一个闪电簇,如图4a中的闪电簇i1和闪电簇j1,则称为简单配对;若在搜索半径范围内在t+Δt时刻有多个闪电簇存在,如图4b中的闪电簇i2分裂成闪电簇j21和闪电簇j22,可视为闪电簇i2发生分裂。当闪电簇搜索半径大于10 km时,超过10 km到搜索半径范围内的闪电簇不能配对,如图4b中的闪电簇i2和闪电簇j23。若t+Δt时刻的闪电簇在多个闪电簇的搜索半径范围内,且搜索半径都小于10 km,则闪电簇发生合并,如图4c中的闪电簇i3和闪电簇i4合并闪电簇j3。最后采用最短距离法对未配对成功的闪电簇进行配对。
根据配对的闪电簇质心坐标可以求得移动速度和移动方向角分别为

图4 闪电簇匹配算法
Fig.4 Matching method of lightning clusters
 (3)
(3)
 (4)
(4)
式中,p为闪电簇位置矢量;(xj, yj)为闪电簇“j”在t+Δt时刻的质心坐标;(xi, yi)为闪电簇“i”在t时刻的质心坐标。
用列联表法计算正确关联数量来评估跟踪结果,其定义见表1。表中X为命中次数,代表外推路径与实际路径一致个数;Y为漏报次数,代表外推不存在闪电簇而实际存在闪电簇的次数;Z为空报次数,指实际未发生闪电但是却外推存在闪电簇的个数;W指实际未发生闪电也未外推存在闪电簇。
表1 POD、FAR和CSI的定义
Tab.1 The definition of POD, FAR and CSI

探测闪电事件探测到未探测到 发生XY 未发生ZW
采用POD、FAR、CSI这三个指标对雷暴活动进行量化评估[29]。POD和CSI值越高,FAR值越低,算法越好。命中率POD、虚假警报率FAR和临界成功指数CSI的表达式分别为
 (5)
(5)
 (6)
(6)
 (7)
(7)
为了量化评估跟踪效果,本文提出了针对全闪电数据特征的评估指标,包括轨迹时长、轨迹线性、轨迹连贯性及轨迹复杂性。轨迹时长是指闪电簇轨迹从开始到结束的时间长度。轨迹线性采用闪电簇轨迹与相邻两个时刻线性插值所得到位置的均方差来描述,称为轨迹偏差,即
 (8)
(8)
式中,N为组成一条轨迹的闪电簇个数;Pt为t时刻闪电簇的质心; 为t+1和t-1时刻质心线性插值得到的t时刻的质心位置。
轨迹连贯性采用非连贯性Nc作为评估指标。Nc为沿轨迹的闪电簇最大闪电事件数(maximum number of lightning events, mln)的变化量,利用闪电轨迹时长对其进行归一化处理得到
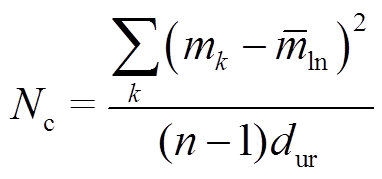 (9)
(9)
式中, 为闪电簇轨迹时长;
 为闪电簇轨迹第k时间间隔的最大闪电事件变化量;
 为闪电簇最大闪电事件变化量的均值。好的跟踪方法可以获得更长、更平坦、更连贯的闪电簇轨迹,这就意味着轨迹时长中值越大,轨迹偏差越小,非连贯性值越小。另外,一次完整的雷暴活动有适中数量的闪电轨迹。将闪电轨迹根据是否有分支分为简单轨迹和复杂轨迹,并计算复杂轨迹中分裂过程次数和合并过程次数。本文提出平均分裂合并次数(Average number of Splits and Merges, ASM)来定义轨迹的复杂性,即
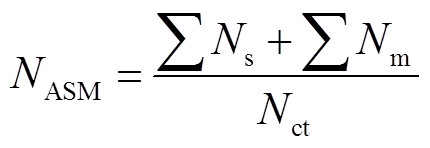 (10)
(10)
式中,Ns、Nm和Nct分别为分裂数量、合并数量和复杂轨迹的数量。
将某年5—9月全闪电数据按事件总数分为 5万~10万、10万~20万和20万以上三类,分别占51.9%、28.6%和19.5%。从每类中分别选择三个共九个案例,并按闪电事件个数由多到少排列,详情见表2,采用评估方法对跟踪结果进行评估。
表2 九个雷暴活动
Tab.2 List of lightning activities used in this analysis

雷暴过程全闪电个数开始时间(UTC)结束时间(UTC)持续时间/ min 案例1253 6075:0020:30930 案例2229 3612:0013:00660 案例3201 1302:0013:42702 案例4153 4714:0012:48528 案例5137 96918:003:00540 案例6134 8863:0013:00600 案例775 6185:0014:00540
(续)

雷暴过程全闪电个数开始时间(UTC)结束时间(UTC)持续时间/ min 案例866 1835:1213:12480 案例953 3695:0012:00420
雷暴过程案例1为5:00—20:30(UTC)广州及周边地区发生的一次雷暴活动。此过程15.5 h内共探测到253 607个全闪电事件。雷暴活动每6 h雷达反射率特征与全闪电分布情况如图5所示。
将时间间隔长度为6 min的全闪电数据按经纬度分布于0.01°的网格里,得到全闪电密度图。采用组合八邻域法对雷暴活动区域进行识别,得到闪电簇LC时空演变过程如图6所示,并勾勒出闪电簇轮廓,见图6中标注区域。

图5 案例1雷达反射率特征与全闪电分布
Fig.5 Radar reflectivity characteristics and full lightning distribution map of case 1
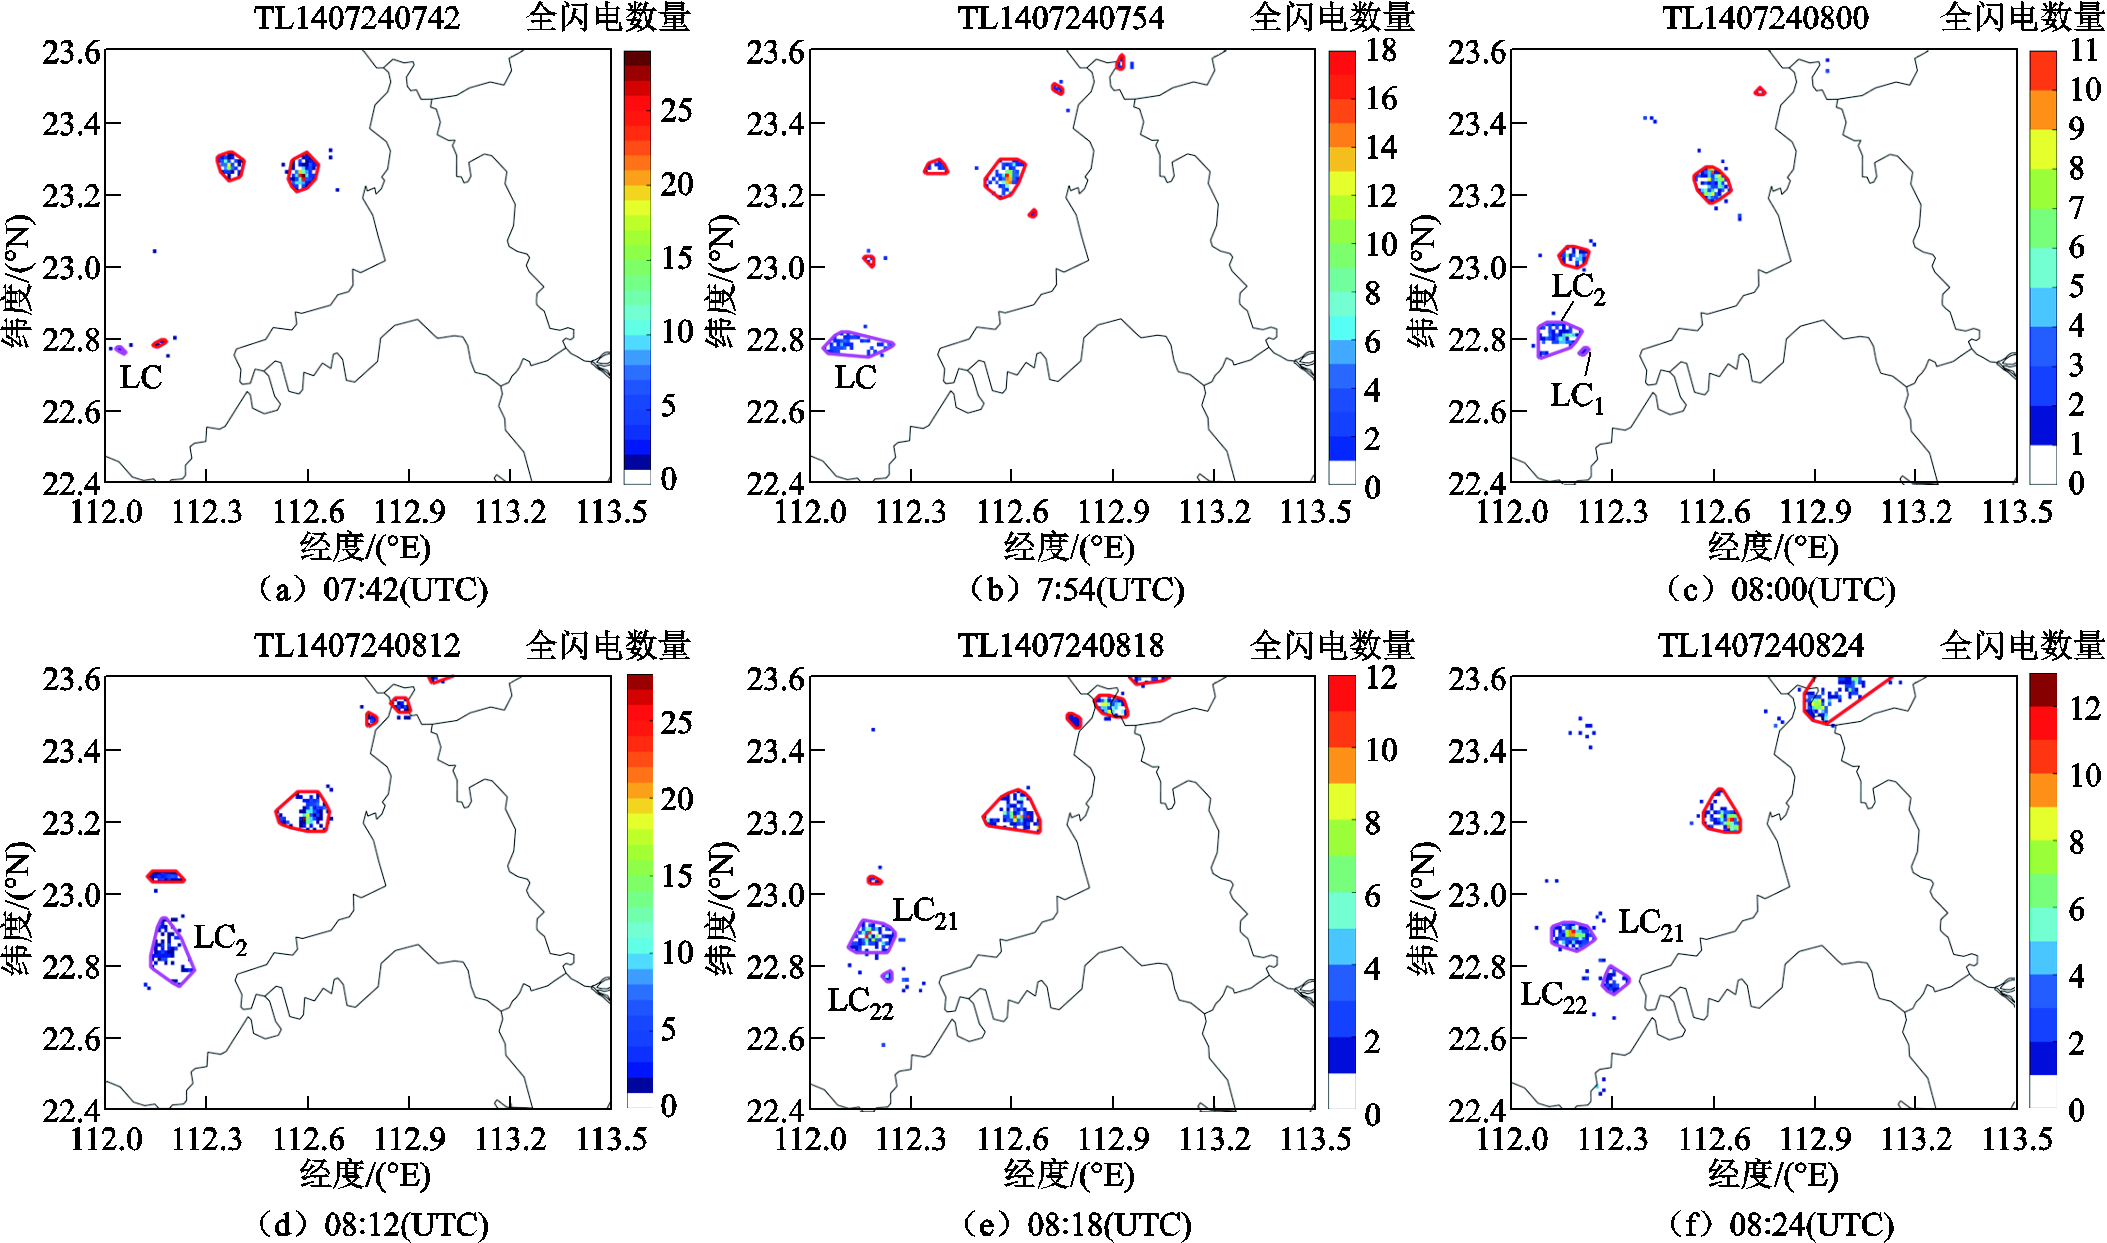

图6 闪电簇LC时空演变过程
Fig.6 Temporal and spatial evolution of lightning cluster LC
从图6a可以看出,7:36—7:42时间段,闪电簇LC生成,面积为3.6 km2,移动速度为35.7 km/h。7:42—7:54时间段,闪电簇LC由西向东移动,面积增加至115.0 km2,速度也增加至54.5 km/h,如图6b所示。图6c中,闪电簇LC在7:54—8:00分裂为两个闪电簇LC1和LC2,面积分别为4.8 km2和110.1 km2,此时闪电簇LC1移动速度为这条轨迹的最大值101.7 km/h,此后在8:00—8:06时间段内消失。在08:00—08:12时间段,闪电簇LC2由西南至东北移动,面积从110.1 km2增加到177.8 km2,如图6d所示。对于闪电簇LC2,8:12—8:18时间段内,再次分裂成质心坐标为(112.18°E, 22.80°N)和(112.23°E, 22.77°N)的两个闪电簇LC21和LC22,面积分别为115.0 km2和7.3 km2,如图6e所示。闪电簇LC21和LC22一分为二各自移动(见图6f)。闪电簇LC22在8:24—8:30过程中消亡,如图6g所示,虽然面积为46.0 km2,但含有闪电事件的网格数仅占闪电面积的57.9%。闪电簇LC21继续从西南向东北移动,面积先增大逐渐减小,于8:54开始消亡,面积为55.7 km2,但闪电簇内含有闪电事件的网格数占闪电簇面积的34.8%,如图6h所示。闪电簇LC生成、成熟、分裂、部分消亡、再分裂、部分消亡、直到消亡的时空演变轨迹如图6i所示。图6i中轨迹的颜色代表时间戳,圆形区域代表闪电簇覆盖区域,圆心为闪电簇的质心地理坐标。闪电簇LC运动速度及方向角见表3。
表3 闪电簇LC时空特征参数
Tab.3 The lightning cluster LC spatiotemporal parameters

时间(UTC)经度/(°E)纬度/(°N)面积/km2速度/(km/h)方向角/(°) 7:42112.0522.773.6—— 7:48112.0822.7827.835.725.76 7:54112.1222.78115.054.5-0.34
(续)
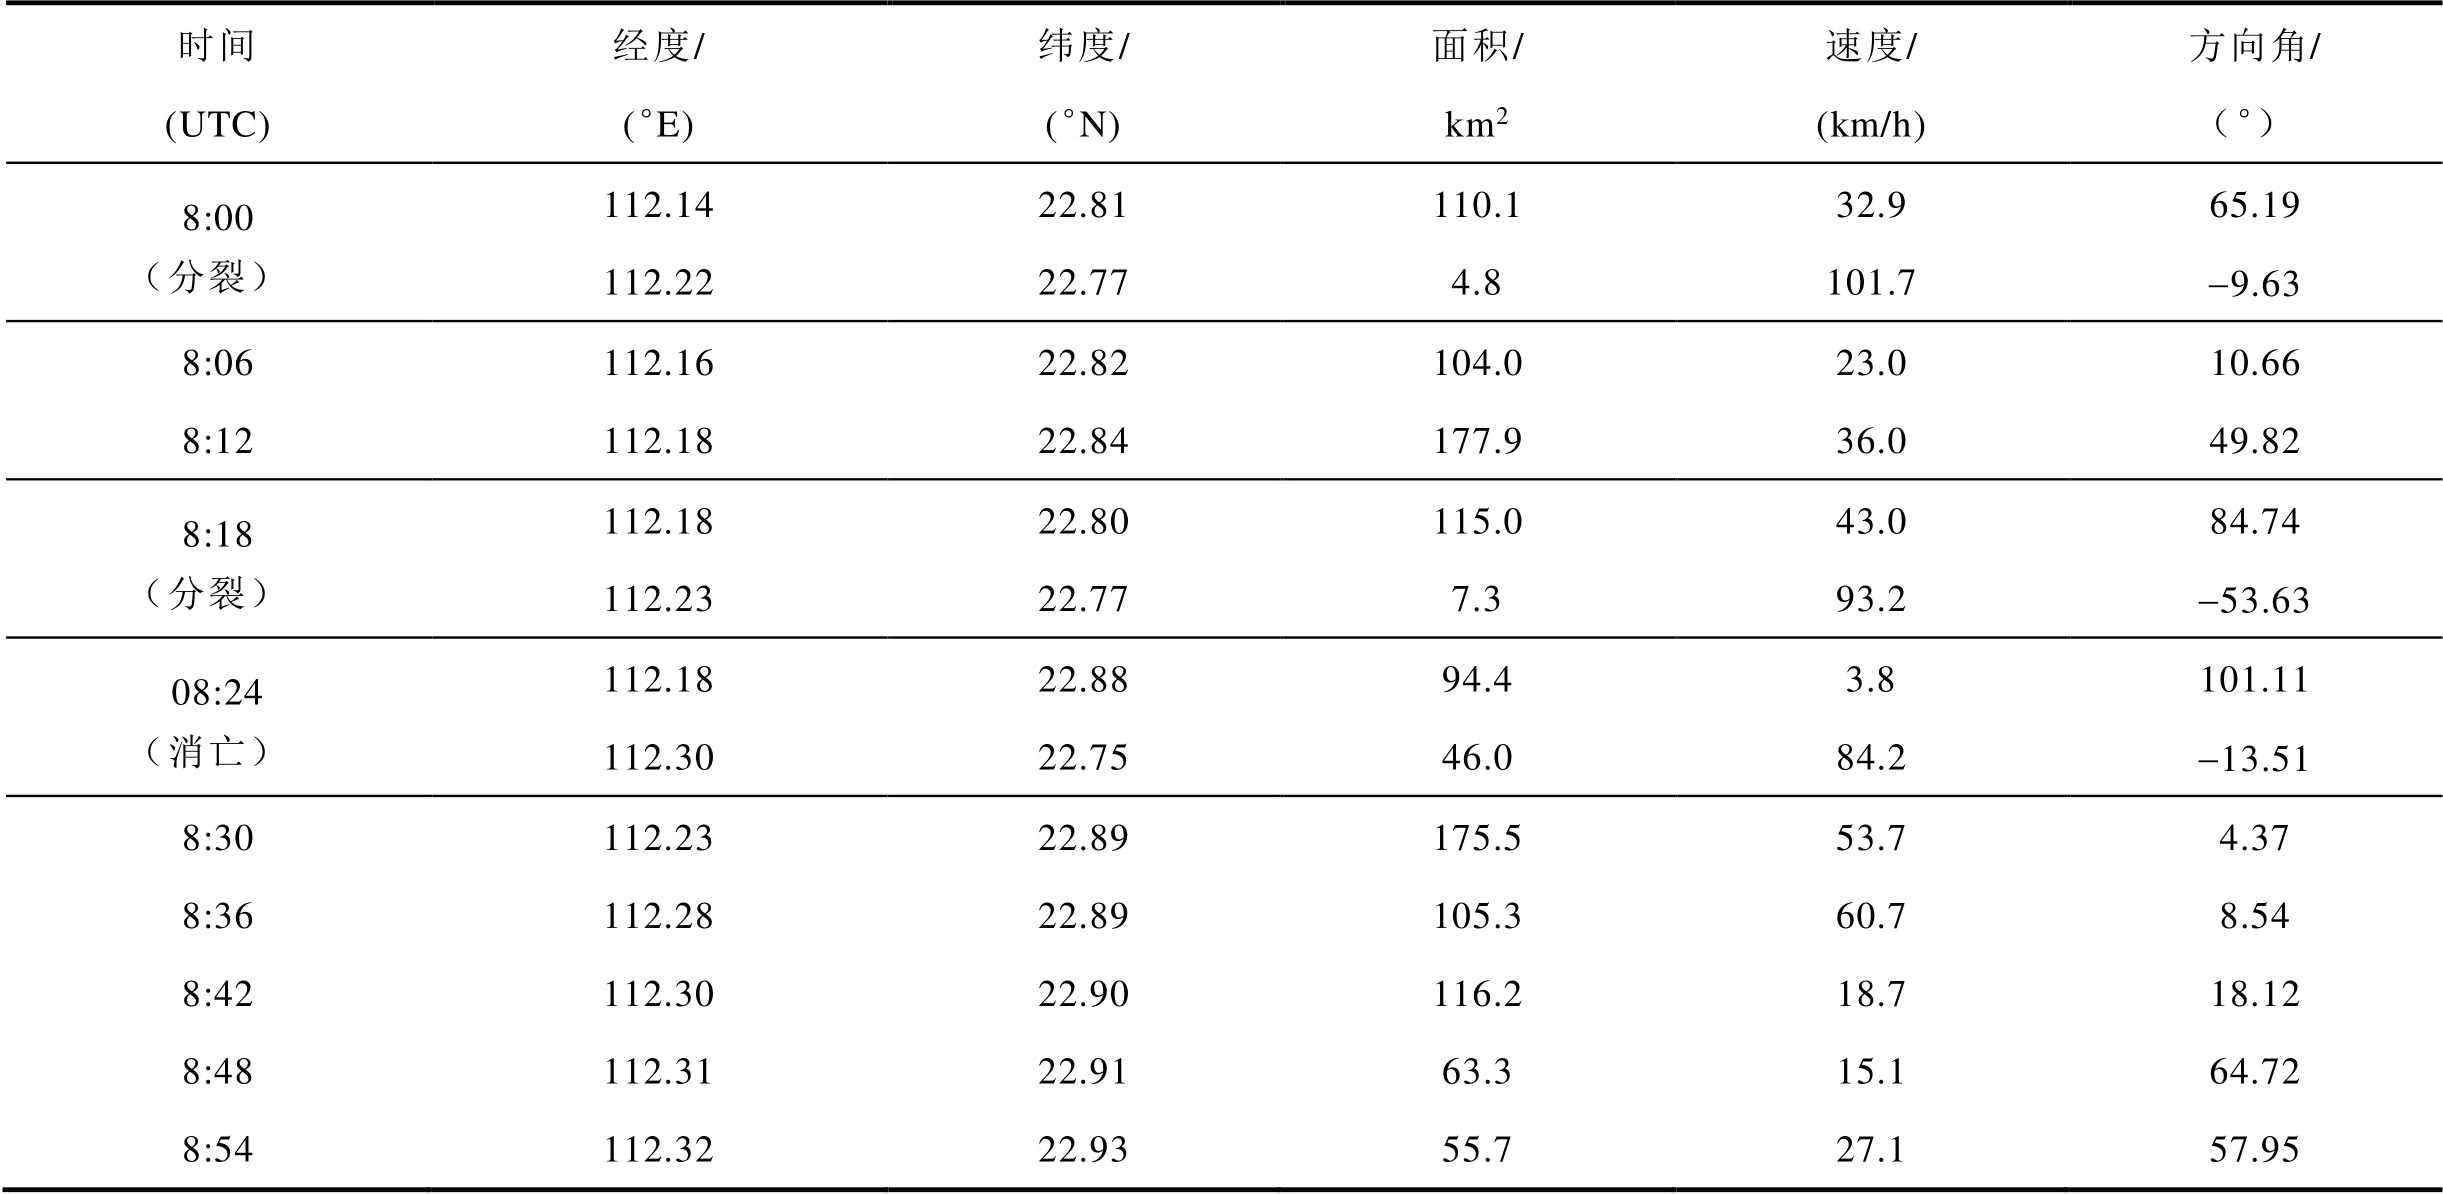
时间(UTC)经度/(°E)纬度/(°N)面积/km2速度/(km/h)方向角/(°) 8:00(分裂)112.1422.81110.132.965.19 112.2222.774.8101.7-9.63 8:06112.1622.82104.023.010.66 8:12112.1822.84177.936.049.82 8:18(分裂)112.1822.80115.043.084.74 112.2322.777.393.2-53.63 08:24(消亡)112.1822.8894.43.8101.11 112.3022.7546.084.2-13.51 8:30112.2322.89175.553.74.37 8:36112.2822.89105.360.78.54 8:42112.3022.90116.218.718.12 8:48112.3122.9163.315.164.72 8:54112.3222.9355.727.157.95
闪电簇LC面积和闪电事件个数,包括全闪电事件个数、云闪事件个数及地闪事件个数随时间变化如图7所示。一条完整轨迹的闪电簇面积和全闪电事件个数整体随时间先呈上升趋势而后呈下降趋势。地闪个数少于云闪个数,于8:24(UTC)达到峰值,全闪电、云闪和地闪分别为154个、81个和73个。
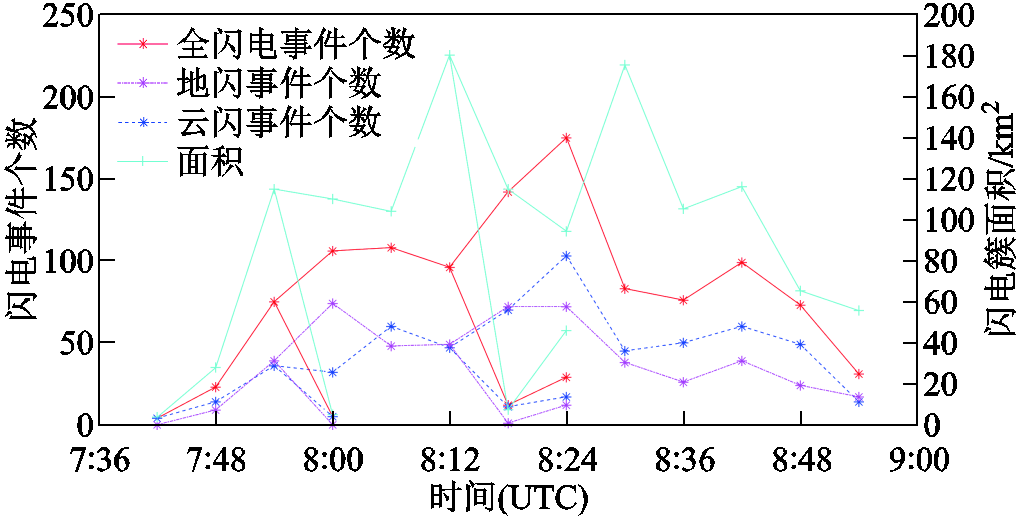
图7 轨迹面积和闪电事件个数时间变化
Fig.7 Variation of lightning areas and number of lightning events with time along track
整个雷暴活动过程一共得到541条闪电簇轨迹,其中313条闪电簇轨迹时长大于18 min。将时长大于18 min的轨迹采取如上述方法进行分析,忽略闪电簇影响范围,保留闪电簇质心运动轨迹,得到一次雷暴活动时空演变过程,如图8所示。

图8 一次雷暴活动时空演变过程
Fig.8 Temporal and spatial evolution of a thunderstorm
闪电簇的移动方向和移动速度可以由连续时刻闪电簇质心确定。九个案例中,案例1、2、4、5、7和9六个案例的闪电簇朝东北方向运动,案例3、6和8的雷暴活动则是朝西北方向运动。
闪电簇轨迹速度分布如图9a所示。在0~25 km/h速度范围内,闪电簇数量分布急剧增加并在25 km/h 附近达到峰值;而后随着速度增加,闪电簇数量逐渐下降。轨迹时长大于18 min的闪电簇移动速度均值为51.4 km/h,中值为43.0 km/h。32.91%的闪电簇速度大于60 km/h,仅有10.11%的闪电簇速度大于100 km/h,且闪电簇平均速度略高于速度中值,见表4。
表4 九个雷暴活动运动特征
Tab.4 Movement characteristics of from nine cases

轨迹速度/(km/h) 平均中值 轨迹(dur≥18 min)51.443.0 简单轨迹42.134.4 复杂轨迹54.847.1
复杂轨迹移动速度高于简单轨迹移动速度。简单轨迹闪电簇之间的配对依赖最短距离,而复杂轨迹的速度采用合并或分裂过程中配对成功闪电簇的平均速度,即合并或分裂过程中闪电簇的平均配对距离比简单配对距离大。本文所得闪电簇运动特征结果与文献[26]基于DBSCAN处理的十年闪电数据所得年均指标基本一致。
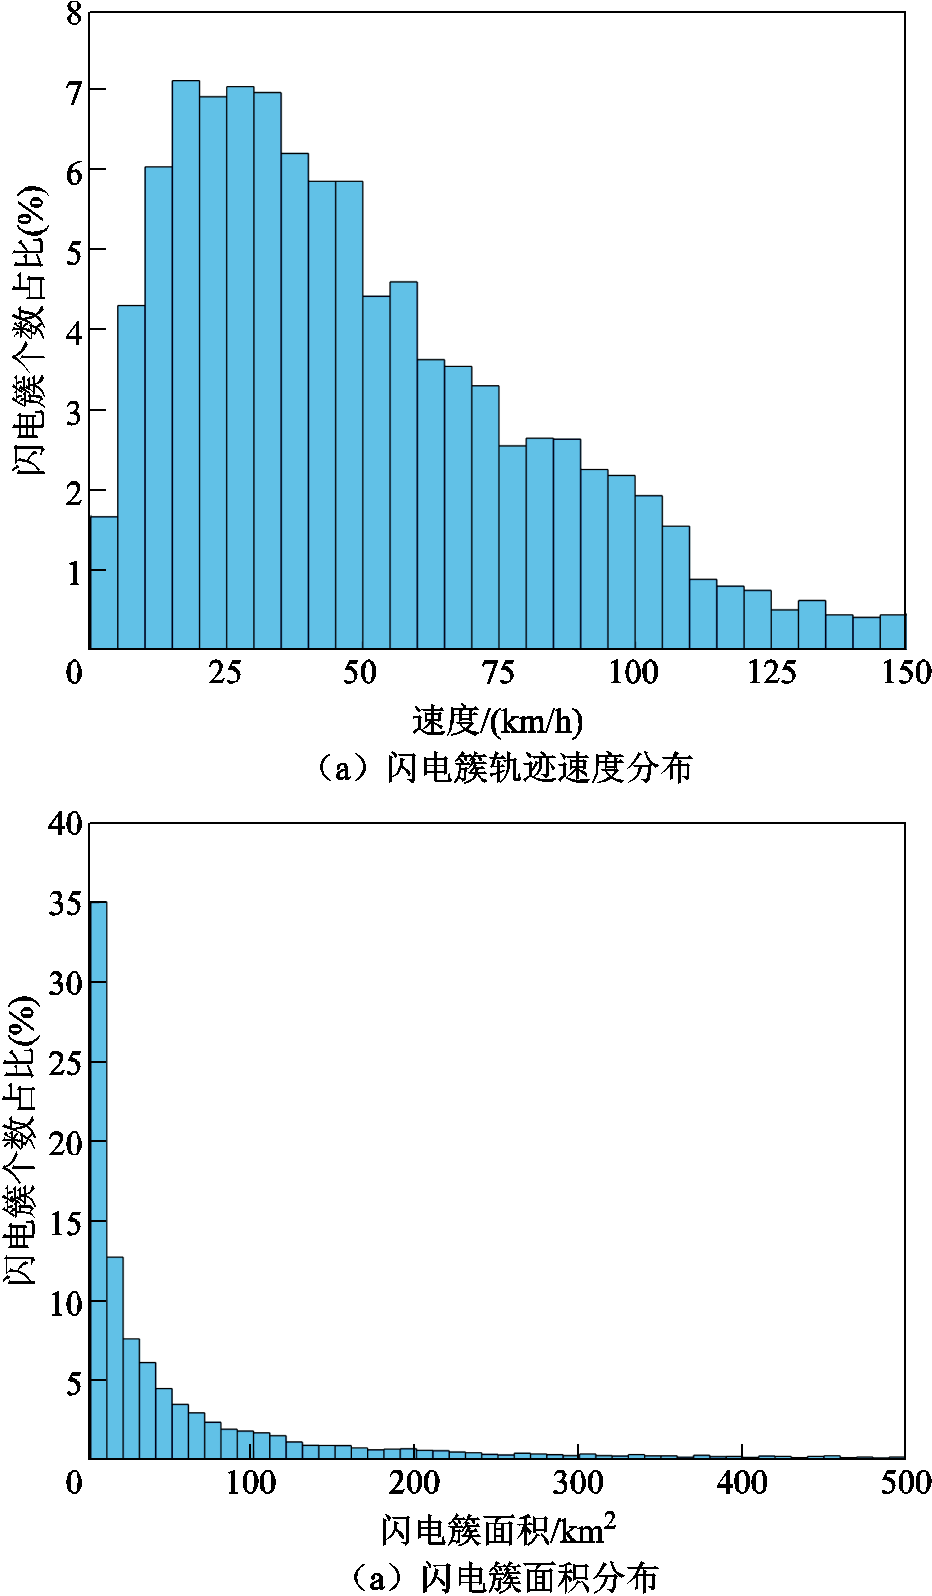
图9 雷暴活动运动特征参数分布
Fig.9 Distribution of motion parameters in thunderstorms
九个雷暴过程识别出10 894个闪电簇形成有效轨迹,面积分布如图9b所示。统计发现,35.1%的闪电簇面积小于10 km2,21.6%的闪电簇面积超过100 km2,闪电簇面积中值为22 km2。这和蔡力等所分析的闪电簇几乎在百千米尺度相比,本文提出的跟踪方法有效缩小了闪电簇面积[20]。
采用评估列联表法对九个案例进行评估,九个案例及整体的POD、FAR和CSI见表5。
表5 列联表法评估结果
Tab.5 Evaluation results of contingency table method

案例POD(%)FAR(%)CSI(%) 163.341.443.8 263.940.944.3 362.342.442.7 463.641.743.7 561.742.142.6 667.737.448.2
(续)

案例POD(%)FAR(%)CSI(%) 765.738.246.7 867.437.847.8 968.135.049.8 整体64.340.442.7
评估指标POD、FAR和CSI分别为64.3%,40.4%和42.7%。对于超过20万个全闪电事件的雷暴活动(案例1~3),POD值相对其他两类较小,约占63%;5万~10万个全闪电事件的雷暴活动(案例7~9)POD值最大,最大可达到68.1%;10万~20万个全闪电事件的雷暴活动(案例4~6)POD值波动幅度最大,三个案例分别为63.6%、61.7%和67.7%。FAR与POD的变化趋势相反,CSI与POD的变化趋势相同。可以看出,轨迹越简单,预测下一时间间隔的闪电簇位置的准确性越高。文献[20]采用k-mean聚类法对地中海地区全闪电轨迹进行跟踪,未来30 min的命中率为46%,可见预测时间越短,命中率越高。文献[30]基于LSM-ResNet模型,结合多种雷达数据预测闪电区域的命中率大约为63%,本文命中率略高且计算量小。相对于八邻域法识别闪电簇,不考虑历史速度及闪电簇分裂合并过程,命中率大约为30%。本文采用的组合八邻域法识别闪电簇,在考虑历史速度以及闪电簇分裂合并过程的情况下,POD可以提升到64.3%。
九个案例的轨迹特征及整体的评估结果见表6和图10。从图10a可以看出,前五个案例的雷暴活动的轨迹时长中值为24 min,而后四个案例中值为30 min。前五个案例在闪电事件数量较多的情况下,轨迹时长中值较低,原因是轨迹时长较短的比例数增加。
表6 轨迹特征法评估结果
Tab.6 Evaluation results of track feature method

案例持续时长中值/min轨迹偏差均值/km平均标准化非连贯性/s-1平均分裂合并次数 1242.850.034 12.43 2242.890.036 12.66 3242.870.024 52.77 4243.010.035 02.48 5242.910.035 52.05 6302.750.035 92.44 7302.790.027 72.57 8302.470.030 22.67 9302.320.042 42.04 整体242.800.032 72.51
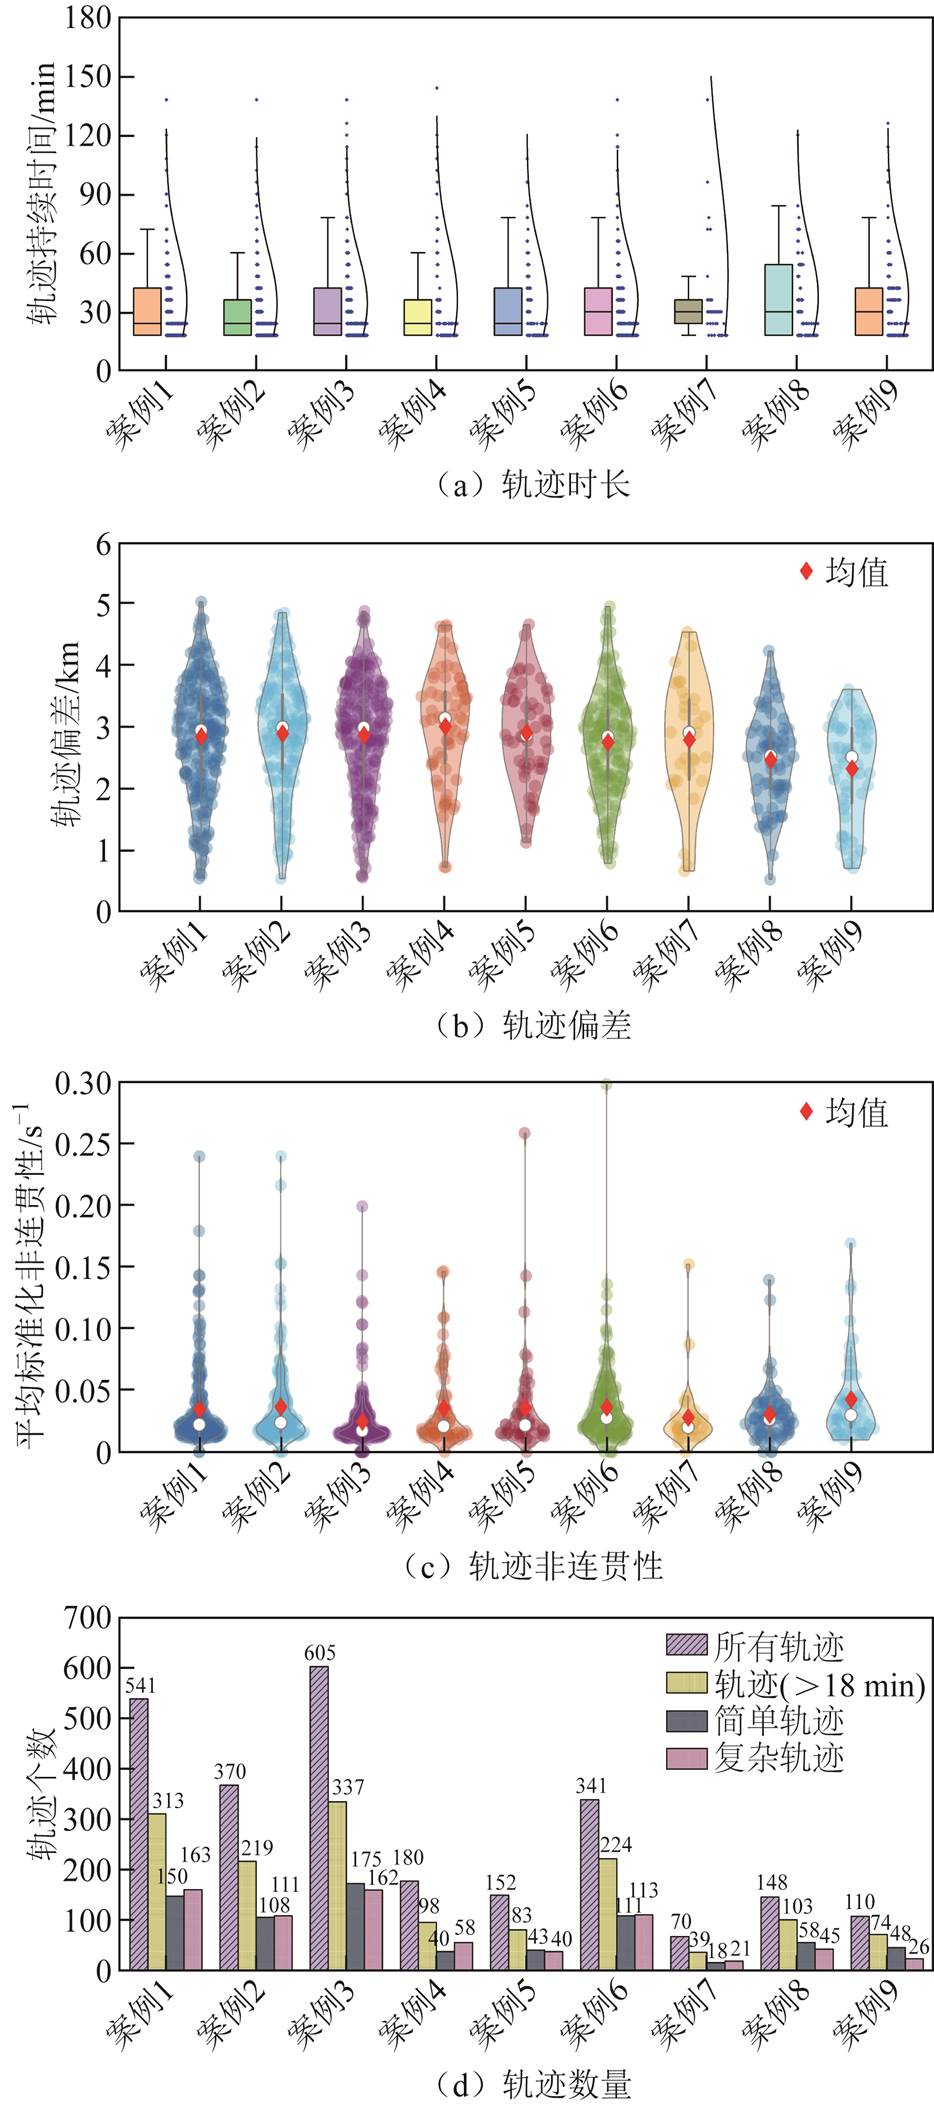
图10 轨迹特征法评估结果
Fig.10 Evaluation results of track feature method
如图10b所示,随着全闪电数量的减少,轨迹偏差呈现减小的趋势。5万~10万闪电簇的雷暴活动轨迹偏差最小;而20万以上闪电事件的雷暴活动轨迹偏差稳定,范围在2.85~2.89之内;10万~20万闪电簇的雷暴活动轨迹偏差波动较大,分别为3.01 km、2.91 km和2.75 km。闪电事件数量和轨迹越少,闪电簇运动轨迹的线性越好。由图10c可见,20万以上的雷暴活动的连贯性指标Nc小于10万~20万的连贯性Nc,闪电簇沿轨迹连贯性更好。
九个案例轨迹分类分布情况如图10d所示,识别出的2 517条闪电簇轨迹中,1 490条轨迹时长超过18 min,占总数的57.98%。简单轨迹和复杂轨迹几乎各占一半,分别为751条和739条。平均分裂合并次数为2.51次。
本文提出一种基于组合八邻域跟踪算法的全闪电雷暴活动监测方法及闪电簇轨迹定量评估方法,得到结论如下:
1)对九个雷暴活动进行识别跟踪,共识别出10 894个闪电簇,面积中值为22 km2.。九个雷暴活动共2 517条闪电轨迹,轨迹时长大于18 min的有1 490条,其中751条为简单轨迹,739条为复杂轨迹。
2)时长大于18 min的轨迹平均速度为51.4 km/h,速度中值为43.0 km/h。简单轨迹运动速度为42.1 km/h,而复杂轨迹平均速度为54.8 km/h,简单轨迹的闪电簇运动速度比复杂轨迹的闪电簇慢。
3)九次雷暴整体评估指标POD、FAR和CSI分别为64.3%,40.4%和42.7%,轨迹时长、轨迹偏差、轨迹非连贯性和平均合并分裂次数分别为24 min、2.80 km、0.032 7 s-1和2.51次。
4)本文所采用的方法,雷电识别尺度在输电线路的5个档距的范围,跟踪结果指标较好,可以为输电线路雷电预警提供支撑。
参考文献
[1] 马瑞阳, 郑栋, 姚雯, 等. 雷暴云特征数据集及我国雷暴活动特征[J]. 应用气象学报, 2021, 32(3): 358-369. Ma Ruiyang, Zheng Dong, Yao Wen, et al. Thunderstorm feature dataset and characteristics of thunderstorm activities in China[J]. Journal of Applied Meteorological Science, 2021, 32(3): 358-369.
[2] 王建. 输电线路气象灾害风险分析与预警方法研究[D]. 重庆: 重庆大学, 2016. Wang Jian. Research on meteorological disaster risk analysis and fault early warning methods for overhead transmission lines[D]. Chongqing: Chongqing University, 2016.
[3] 蔡国伟, 雷宇航, 葛维春, 等. 高寒地区风电机组雷电防护研究综述[J]. 电工技术学报, 2019, 34(22): 4804-4815. Cai Guowei, Lei Yuhang, Ge Weichun, et al. Review of research on lightning protection for wind turbines in alpine areas[J]. Transactions of China Electrotechnical Society, 2019, 34(22): 4804-4815.
[4] 袁涛, 左思家, 司马文霞, 等. 紧凑型多腔室并联间隙雷电冲击闪络路径约束研究[J]. 电工技术学报, 2023, 38(11): 2989-2998. Yuan Tao, Zuo Sijia, Sima Wenxia, et al. Research on lightning flashover path constraints of compact multi-chamber parallel gap[J]. Transactions of China Electrotechnical Society, 2023, 38(11): 2989-2998.
[5] Okabe S, Takami J. Occurrence probability of lightning failure rates at substations in consideration of lightning stroke current waveforms[J]. IEEE Transactions on Dielectrics and Electrical Insulation, 2011, 18(1): 221-231.
[6] Perez E, Espinosa J, Aranguren D. On the development of dynamic stroke density for transmission line for power system operational applications[J]. International Journal of Electrical Power & Energy Systems, 2020, 116: 105527.
[7] 袁涛, 王肖田, 司马文霞, 等山区输电线路雷击跳闸预警的融合算法研究[J]. 电工技术学报, 2023, 38(9): 2528-2540. Yuan Tao, Wang Xiaotian, Sima Wenxia,et al. Research on fusion algorithm of lightning strike trip warning for mountain transmission lines[J]. Transactions of China Electrotechnical Society, 2023, 38(9): 2528-2540.
[8] Matsui M, Michishita K, Yokoyama S. Cloud-to-ground lightning flash density and the number of lightning flashes hitting wind turbines in Japan[J]. Electric Power Systems Research, 2020, 181: 106066.
[9] Banjanin M S. Application possibilities of special lightning protection systems of overhead distribution and transmission lines[J]. International Journal of Electrical Power & Energy Systems, 2018, 100: 482-488.
[10] 曾嵘, 周旋, 王泽众, 等. 国际防雷研究进展及前沿述评[J]. 高电压技术, 2015, 41(1): 1-13. Zeng Rong, Zhou Xuan, Wang Zezhong, et al. Review of research advances and fronts on international lightning and protection[J]. High Voltage Engineering, 2015, 41(1): 1-13.
[11] 王东方, 孙竹玲, 袁善锋, 等. 北京多频段闪电三维定位网及一次雷暴过程的闪电时空演化特征[J]. 大气科学, 2020, 44(4): 851-864. Wang Dongfang, Sun Zhuling, Yuan Shanfeng, et al. Beijing broadband lightning network and the spatiotemporal evolution of lightning flashes during a thunderstorm[J]. Chinese Journal of Atmospheric Sciences, 2020, 44(4): 851-864.
[12] 蔡力. 地基VLF/LF三维全闪电定位技术研究[D]. 武汉: 武汉大学, 2013. Cai Li. Ground-based VLF/LF three dimensional total lightning location technology[D]. Wuhan: Wuhan University, 2013.
[13] 陈家宏, 张勤, 冯万兴, 等. 中国电网雷电定位系统与雷电监测网[J]. 高电压技术, 2008, 34(3): 425-431. Chen Jiahong, Zhang Qin, Feng Wanxing, et al. Lightning location system and lightning detection network of China power grid[J]. High Voltage Engineering, 2008, 34(3): 425-431.
[14] Biagi C J, Cummins K L, Kehoe K E, et al. National Lightning Detection Network (NLDN) performance in southern Arizona, Texas, and Oklahoma in 2003-2004[J]. Journal of Geophysical Research, 2007, 112: D05208.
[15] Shao X M, Stanley M, Regan A, et al. Total lightning observations with the new and improved Los Alamos Sferic Array (LASA)[J]. Journal of Atmospheric and Oceanic Technology, 2006, 23(10): 1273-1288.
[16] Betz H D, Meneux B. LINET systems - 10 years experience[C]//2014 International Conference on Lightning Protection (ICLP), Shanghai, China, 2014: 1553-1557.
[17] 高文胜, 张博文, 周瑞旭, 等. 基于雷电定位系统监测数据的雷暴云趋势预测[J]. 电网技术, 2015, 39(2): 523-529. Gao Wensheng, Zhang Bowen, Zhou Ruixu, et al. Nowcasting of the thunderstorm trend based on data collected by lightning location system[J]. Power System Technology, 2015, 39(2): 523-529.
[18] 王羽, 向美辰, 邓冶强, 等. 基于时空聚类的引雷塔区域雷电地闪活动分析[J]. 高电压技术, 2021, 47(12): 4255-4264. Wang Yu, Xiang Meichen, Deng Yeqiang, et al. Analysis of lightning activity in area of triggering lightning tower based on spatial-temporal clustering[J]. High Voltage Engineering, 2021, 47(12): 4255-4264.
[19] 司马文霞, 李永福, 杨庆, 等. 改进网格法及其在雷电参数统计中的应用[J]. 高电压技术, 2012, 38(8): 1834-1841. Sima Wenxia, Li Yongfu, Yang Qing, et al. Improved grid method and its application to statistics of lightning parameters[J]. High Voltage Engineering, 2012, 38(8): 1834-1841.
[20] 王红斌, 程思, 范伟男, 等. 雷暴活动全闪电定位及空间演变过程分析[J]. 电工技术学报, 2021, 36(2): 373-379. Wang Hongbin, Cheng Si, Fan Weinan, et al. Total lightning location of thunderstorm activities and spatial evolution process analysis[J]. Transactions of China Electrotechnical Society, 2021, 36(2): 373-379.
[21] Houston A L, Lock N A, Lahowetz J, et al. Thunderstorm observation by radar (ThOR): an algorithm to develop a climatology of thunderstorms[J]. Journal of Atmospheric and Oceanic Technology, 2015, 32(5): 961-981.
[22] Dixon M, Wiener G. TITAN: thunderstorm identification, tracking, analysis, and nowcasting-a radar-based methodology[J]. Journal of Atmospheric and Oceanic Technology, 1993, 10(6): 785-797.
[23] Kohn M, Galanti E, Price C, et al. Nowcasting thunderstorms in the Mediterranean region using lightning data[J]. Atmospheric Research, 2011, 100(4): 489-502.
[24] Cai Li, Zou Xin, Wang Jianguo, et al. The Foshan total lightning location system in China and its initial operation results[J]. Atmosphere, 2019, 10(3): 149-153.
[25] Huang Yijun, Fan Yadong, Cai L, et al. A new thunderstorm identification algorithm based on total lightning activity[J]. Earth and Space Science, 2022, 9(4): e2021EA002079.
[26] He Lifeng, Ren Xiwei, Gao Qihang, et al. The connected-component labeling problem: a review of state-of-the-art algorithms[J]. Pattern Recognition, 2017, 70: 25-43.
[27] del Moral A, Rigo T, Llasat M C. A radar-based centroid tracking algorithm for severe weather surveillance: identifying split/merge processes in convective systems[J]. Atmospheric Research, 2018, 213: 110-120.
[28] Rigo T, Pineda N, Bech J. Analysis of warm season thunderstorms using an object-oriented tracking method based on radar and total lightning data[J]. Natural Hazards and Earth System Science, 2010, 10(119): 1881-1893.
[29] 彭治班, 吴宝俊, 江剑民, 等. 提高小概率事件预报成功率的一条途径[J]. 气象, 2000, 26(2): 3-5, 10. Peng Zhiban, Wu Baojun, Jiang Jianmin, et al. A method to improve the forecast accuracy of rare events[J]. Meteorological Monthly, 2000, 26(2): 3-5, 10.
[30] 张亚东. 基于深度学习和多维空间数据的闪电落区识别研究——以浙江宁波为例[D]. 南京: 南京信息工程大学, 2022.
Abstract Lightning is the main cause of damages to power systems. The planning of power system transmission corridors and line lightning protection are mainly based on the lightning density and the distribution of lightning days. Measures such as reducing the grounding resistance of towers and installing lightning arresters are taken to improve the insulation level of transmission lines. The traditional lightning density and the number of thunderstorm days are not able to present the temporal and spatial evolution characteristics of thunderstorm activities. Monitoring the movement of lightning activity can provide track and warning information for lightning protection of equipment. This paper presents a combinatorial eight-connectivity tracking method and evaluation indexes based on total lightning data, which is applied to analyze the temporal and spatial evolution of lightning activities in Guangzhou.
The tracking method based on total lightning data is divided into two steps: cluster identification and cluster tracking. At the step of identification, the grid method is used to pre-process the total lightning events and the lightning region (112°E~115°E, 22°N~25°N) is gridded into 0.01°×0.01° grid boxes (longitude×latitude). Total lightning events are distributed into grid cells according to their geographical coordinates to form a total lightning density map in a single time interval. First, the electrically active region is identified by the 8-connectivity method and form primary lightning clusters. According to the size of the transmission line span, primary lightning clusters are merged into final lightning clusters within the distance of two grid cells. At the step of tracking, the algorithm takes influencing factors into account to match clusters between two successive time intervals, including history velocity, lightning cluster area and split-merge processes. In addition, the evaluation indexes contain the skill scores of the probability of detection (POD), false alarm ratio (FAR), and critical success index (CSI) from the contingency table approach, the track characteristics of track duration, track linearity, track continuity and track complexity to quantitatively evaluate the performance of tracking method.
The tracking method and evaluation are used to analyze the nine thunderstorms and case 1 are presented as an example. The case 1 has 313 tracks longer than 18 min, and tracks move in the northeast direction, with a mean speed of 51.4 km/h and a median speed of 43.0 km/h. The centroid of lightning clusters and temporal and spatial evolution characteristics of each track are counted. The evaluation indexes of POD, FAR and CSI are 63.3%, 41.4% and 43.8%, respectively, while the median track duration, mean jitter of track, incoherence and average number of splits and merges are 24 min, 2.85 km, 0.034 1 s-1 and 2.43, respectively.
The following conclusions can be drawn from the nine thunderstorms based on the combinatorial eight-connectivity tracking method and evaluation indexes: (1) A total of 10,894 lightning clusters were identified in the nine lightning activities, with a median area of 22 km2. It is found that 1 490 lightning cluster tracks are longer than 18 min, of which simple tracks and complex tracks (involving split-ting or merging) account for half, respectively. (2) Six lightning activities move in the northeast direction, the rest move northwest, with a mean speed of 51.4 km/h and a median speed of 43.0 km/h. Simple tracks move slower than complex tracks. (3) POD, FAR and CSI are 65.6%, 39.2%, 46.4%, respectively, while the median track duration, mean jitter of track, incoherence and average number of splits and merges are 24 min, 2.80 km, 0.032 7 s-1 and 2.51, respectively. This algorithm can describe the temporal and spatial evolution of lightning activity and indexes are able to evaluate the tracking results, which provides an effective method for predicting thunderstorm movement and lightning warning of transmission lines.
keywords:Lightning activity, tracking method, evaluation index, spatial-temporal evolution, combinatorial eight-connectivity
DOI:10.19595/j.cnki.1000-6753.tces.222187
中图分类号:TM863
国家自然科学基金(52177154)和中央高校基本科研业务费专项资金(2042022kf0016)资助项目。
收稿日期 2022-11-21
改稿日期 2023-01-07
黄怡鋆 女,1992年生,博士研究生,研究方向为雷电监测预警技术。E-mail:yjhuang23@whu.edu.cn
樊亚东 女,1967年生,教授,博士生导师,研究方向为工程电磁场及应用、雷电防护与接地技术等。E-mail:ydfan@whu.edu.cn(通信作者)
(编辑 李 冰)