 (1)
(1)
摘要 随着非线性负荷和冲击性负荷的不断增加以及新能源的大规模并网,电网环境日趋复杂,各类电能质量问题日益凸显。其中,谐波问题尤为突出,准确估计谐波参数不仅是谐波治理的关键,也是电力企业和用户评价电能质量的重要依据。为此,该文提出一种基于自适应移频滤波的电力系统谐波分析方法。首先,对电网谐波信号进行初次移频滤波操作,以获得信号实际基波频率;然后,根据信号实测基波频率,对信号进行二次移频滤波处理,进而准确获取各次谐波的幅值和相角;最后,仿真实验表明,该文所提算法能够有效地克服非同步采样和噪声的影响,并且具有测量精度高、实时性好和适应性强等特点。此外,通过实际构建的硬件测试平台,进一步验证了所提算法的准确性和可靠性。
关键词:电力系统分析 电能质量 电网谐波 移频滤波
随着电力电子、微电子等相关技术的快速普及与新能源产业的飞速发展,各类非线性与冲击性负荷在电网中的使用比重逐渐增加,特别是以光伏、风电为代表的新能源大规模并网,使得当前电网运行环境日趋复杂[1- 2]。这些电力电子设备在工作时会不可避免地引入谐波,使得电网信号波形发生畸变,给电力系统安全运行造成严重影响[3-5]。
近年来,国内外学者在电力系统谐波分析方面做了大量的研究工作,并且也取得了一定的研究成果。目前电力系统谐波分析的主要方法有卡尔曼滤波[6]、Prony[7]、人工神经网络[8]、小波变换[9-10]和快速傅里叶变换(Fast Fourier Transform, FFT)及其改进算法[11-12]等。基于卡尔曼滤波的分析方法虽可实现电力系统谐波信号的跟踪测量,但其需依赖信号的先验信息进行准确的数学建模,不准确的建模将导致谐波参数估计误差较大[13]。Prony及其改进算法虽然能够实现较高的谐波参数估计精度,但其对噪声十分敏感,且巨大的运算量也限制了其在实际中的应用[14]。人工神经网络法具有一定的自学能力且具有检测精度高、计算量小等特点,但其初始训练样本往往难以确定[15]。小波变换在分析非周期和暂态信号时具有一定优势,但其计算复杂、运算量大、对噪声敏感且不易于嵌入式实现[16]。FFT因具有简单、快速、易于嵌入式实现等优点而被广泛使用[17]。但利用FFT对电网信号进行分析时难以做到同步采样,从而造成频谱泄露和栅栏效应,使得谐波参数的估计误差较大[18-19]。为克服传统傅里叶变换在非同步采样条件下所导致的频谱泄露与栅栏效应等问题,国内外学者针对FFT提出一系列改进算法,例如,加窗插值FFT[20-22]、加窗相位差FFT[23]和加窗移频FFT算法[24]。加窗插值FFT需对谐波频谱进行最小二乘拟合,计算相对复杂[25]。加窗相位差FFT与加窗移频FFT算法均具有较高的精度与较小的运算量,但其谐波参数的估计精度受制于所选择的窗函数,不具备普适性[26-27]。这些改进FFT算法虽然在一定程度上提高了谐波参数的检测精度,但对弱幅值谐波参数估计的精度仍略显不足。文献[28]提出基于移频滤波的谐波频率分析方法,可有效减少频谱泄露对弱幅值谐波的影响,从而实现弱幅值谐波的频率估计,然而该方法仍会受到基波频率偏差的影响。
针对上述问题,本文提出一种基于自适应移频滤波的电力系统谐波分析方法。该方法先对原始谐波信号进行首次移频滤波操作,以获取信号的实际基波频率;然后,根据实测基波频率偏差构造新的移频函数,并对原始谐波信号进行二次移频滤波处理,以获得各次谐波的幅值和相角参数。本文分别在弱幅值谐波信号、基波频率偏差、白噪声影响等条件下对算法进行了仿真,并构建了实际的硬件测试平台。仿真与实际测试结果表明,本文所提算法能够对电力系统谐波参数进行准确、快速和有效的估计。
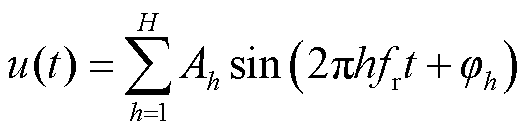
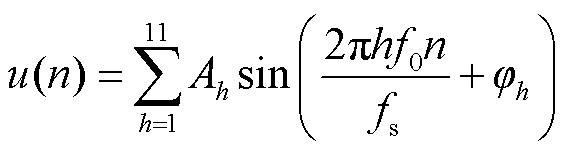
电力系统的稳态谐波信号模型可表示为
(1)
式中,Ah为第h次谐波的幅值;φh为第h次谐波的相角;H为谐波最高阶次;fr为实际基波频率。
假设电力系统标称频率为fnom=50 Hz,则实际频率fr为
 (2)
(2)
式中, 为实际电网基波频率偏差。
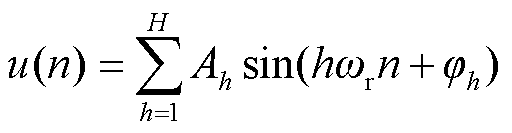
对信号u(t)进行采样,采样频率fs取标称频率的整数倍,即fs=Mfnom,M为正整数。采样后的信号可表示为
 (3)
(3)
式中,ωr=2πfr/(Mfnom);n=1,2, , N;N为采样点数。
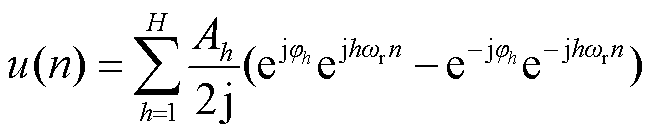
通过欧拉公式对式(3)进行改写,可以得到
 (4)
(4)
根据式(4),电网谐波信号u(n)包含的频率成分可分为hωr和-hωr两个部分。
假设移频函数为
 (5)
(5)
式中,ωnom为标称角频率,且ωnom=2πfnom/fs=2π/M;hs为所求谐波次数。
将式(4)两边同时乘以该移频函数,可以得到移频后的信号为
 (6)
(6)
由式(6)可知,移频后信号的频率成分从原始信号的hωr和-hωr变为(hsωnom+hωr)和(hsωnom-hωr)。将式(6)所示信号经过低通滤波处理即可将所求频率分量保留,以便得到其相关参数。
考虑到实际信号易受噪声影响,以及均值滤波器是在滤波器长度固定条件下对白噪声具有最佳抑制效果的滤波器,本文在对移频后信号进行滤波之前,首先对均值滤波器的特性进行分析。
均值滤波器的时域表达式为
 (7)
(7)
式中,M为均值滤波器长度且M=fs/fnom。
对式(7)进行离散时间傅里叶变换(Discrete Time Fourier Transform, DTFT)处理后,可以得到
 (8)
(8)
故均值滤波器的幅频响应可表示为
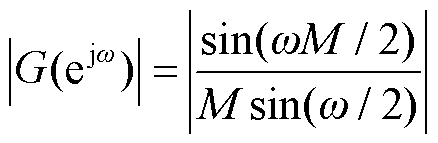 (9)
(9)
单次滤波操作难以很好地滤除目标频率分量之外的频率分量,故本文对移频后信号进行多次迭代滤波处理,以减少其他频率分量对目标频率分量的干扰。信号与均值滤波器进行多次迭代滤波处理,等同于该信号与p阶自卷积均值滤波器(Self-Convolution Mean Filter, SCMF)进行卷积运算。其中,p阶SCMF可表示为
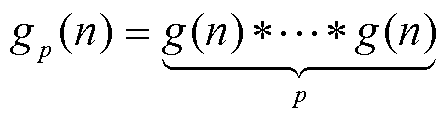 (10)
(10)
式中,*为卷积运算符。
图1给出了不同阶数p情况下,自卷积均值滤波器的幅频特性曲线。根据图1可知,随着自卷积均值滤波器阶数的增加,其旁瓣峰值电平逐渐减小,旁瓣衰减速率逐渐增加,对其他谐波分量的抑制效果也不断增强。
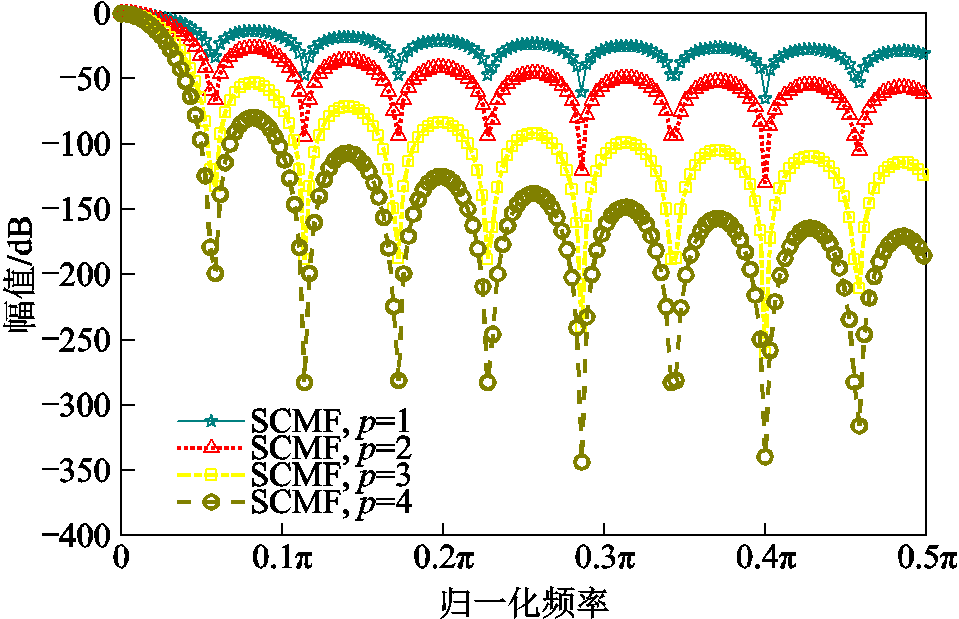
图1 不同阶数SCMF的幅频特性
Fig.1 The amplitude-frequency characteristics of SCMF with different orders
经过移频滤波后的信号y(n)可表示为
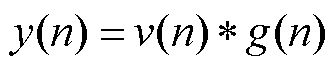 (11)
(11)
根据卷积定理,可将式(11)表示为
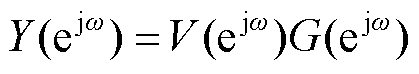 (12)
(12)
式中,Y(ejω)、V(ejω)和G(ejω)分别为y(n)、v(n)和g(n)的DTFT。
V(ejω)的表达式为
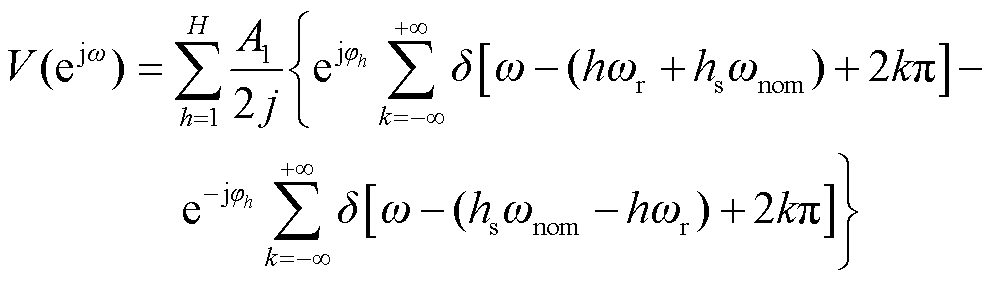 (13)
(13)
式中,δ(·)为冲激函数。
Y(ejω)的表达式为
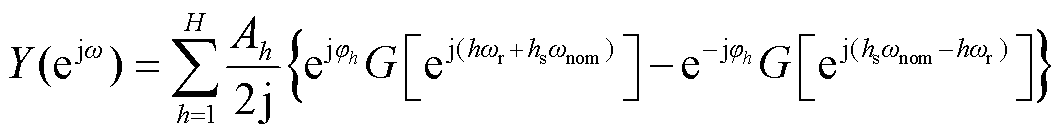 (14)
(14)
谐波信号经过移频滤波处理后会具有以下特性:
1)当h=hs时,经移频滤波后的hs次谐波分量ωn(h)=hs(ωnom-ωr)≈0,因此有
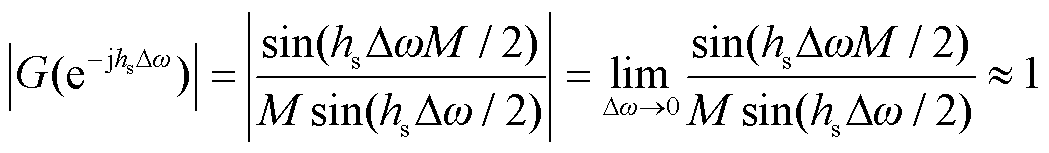 (15)
(15)
式中,∆ω=ωr-ωnom。即当h=hs时,hs(ωnom-ωr)频率分量得以保留。
2)当h≠hs时,经移频滤波后的ωp(h)=(hsωnom+ hωr)≠0且ωn(h)=(hsωnom-hωr)≠0,此时 与
与 ,即所有h≠hs的谐波频率分量将被滤除。
通过以上分析可知,电网谐波信号经移频滤波处理后,仅保留了频率为hsωr的谐波分量,其余频率分量均被抑制。因此,经移频滤波处理后的谐波信号在时域上可以表示为
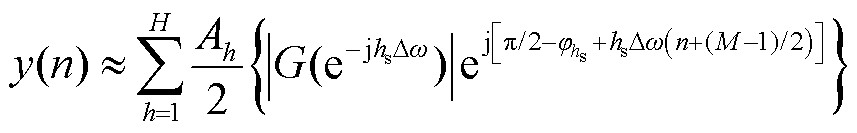 (16)
(16)
而经移频和p次滤波后的谐波信号可表示为
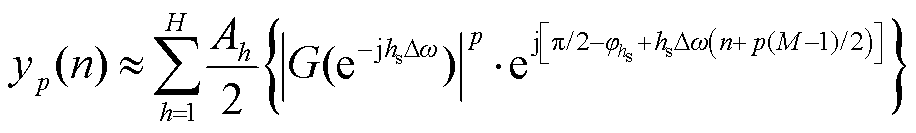 (17)
(17)
取基波(hs=1)并在该信号上任取两点n1、n2,利用yp(n)的相角可得实际基波的角频率偏差为
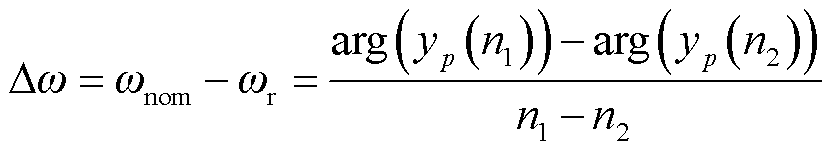 (18)
(18)
式中,arg表示取复数相角。
由式(18)可得实际基波频率偏差量∆f为
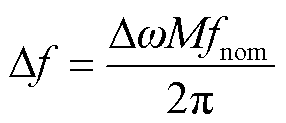 (19)
(19)
将式(19)代入式(2),可得实际基波频率fr为
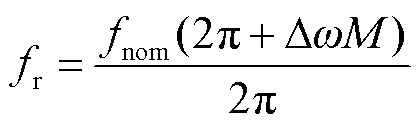 (20)
(20)
根据实际基波频率fr可以得到经过校正的移频函数角频率为ωc=2πfr/fs,此时经过校正后的移频函数可表示为
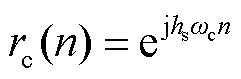 (21)
(21)
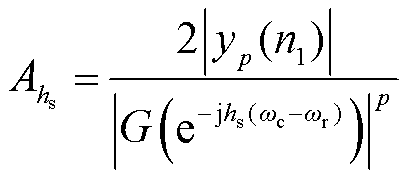
经fr校正后使用的滤波器长度为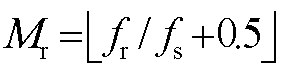 。将式(21)代入式(6),即对原始谐波信号再次进行移频滤波处理,可推导出第hs次谐波幅值修正公式为
 (22)
(22)
第hs次谐波相角修正公式为
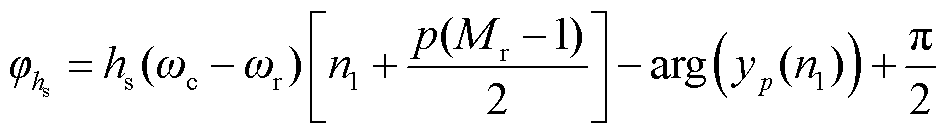 (23)
(23)
本文提出的基于自适应移频滤波的谐波分析方法流程如图2所示,具体实现步骤为:
1)首先对原始电网采样信号进行一次按标称频率ωnom的移频滤波操作。
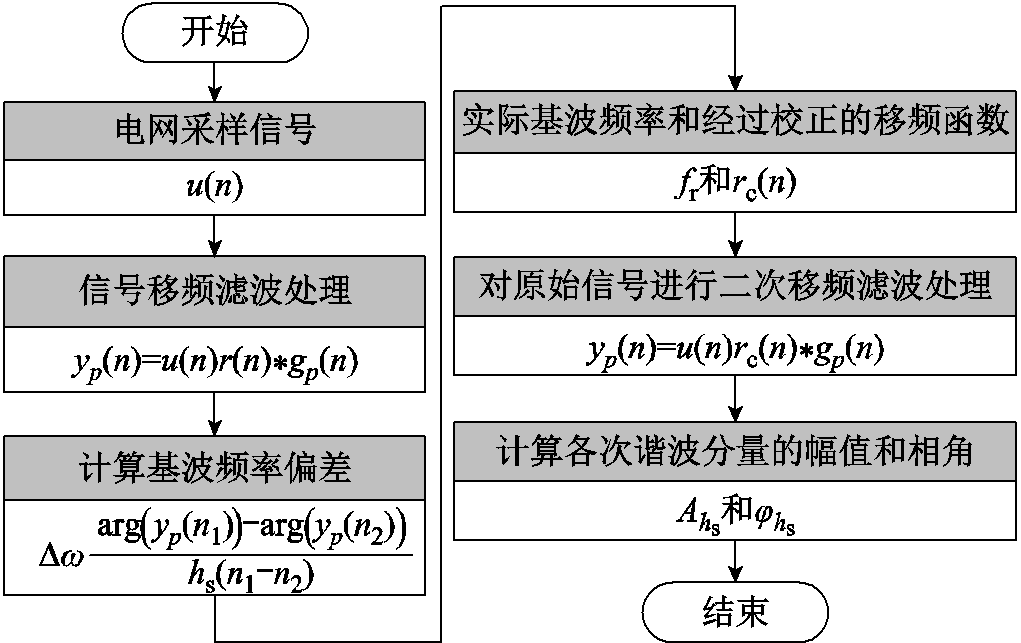
图2 基于自适应移频滤波的电网谐波分析方法流程图
Fig.2 The flow chart of power grid harmonic analysis method based on adaptive frequency-shift filtering
2)通过式(18)计算实际基波的频偏∆f,并由该频偏得到电网信号的实际基波频率fr和经过校正的移频函数角频率ωc。
3)利用校正后的移频函数rc(n)对原始信号再次进行移频滤波处理,以确保所求谐波分量落在零频处,最后根据式(22)和式(23)得到所求阶次谐波的幅值与相角信息。
图3以获取2次谐波参数为例进行说明。首先,电网信号经过基波移频滤波计算得到角频率偏差∆ω,并获得经过∆ω校正的新移频函数;然后,所求的2次谐波利用经过校正后的移频函数进行二次移频滤波处理,使得所求2次谐波的频率谱线被移至零频处;最后,通过式(22)和式(23)计算得到2次谐波的幅值与相角信息。
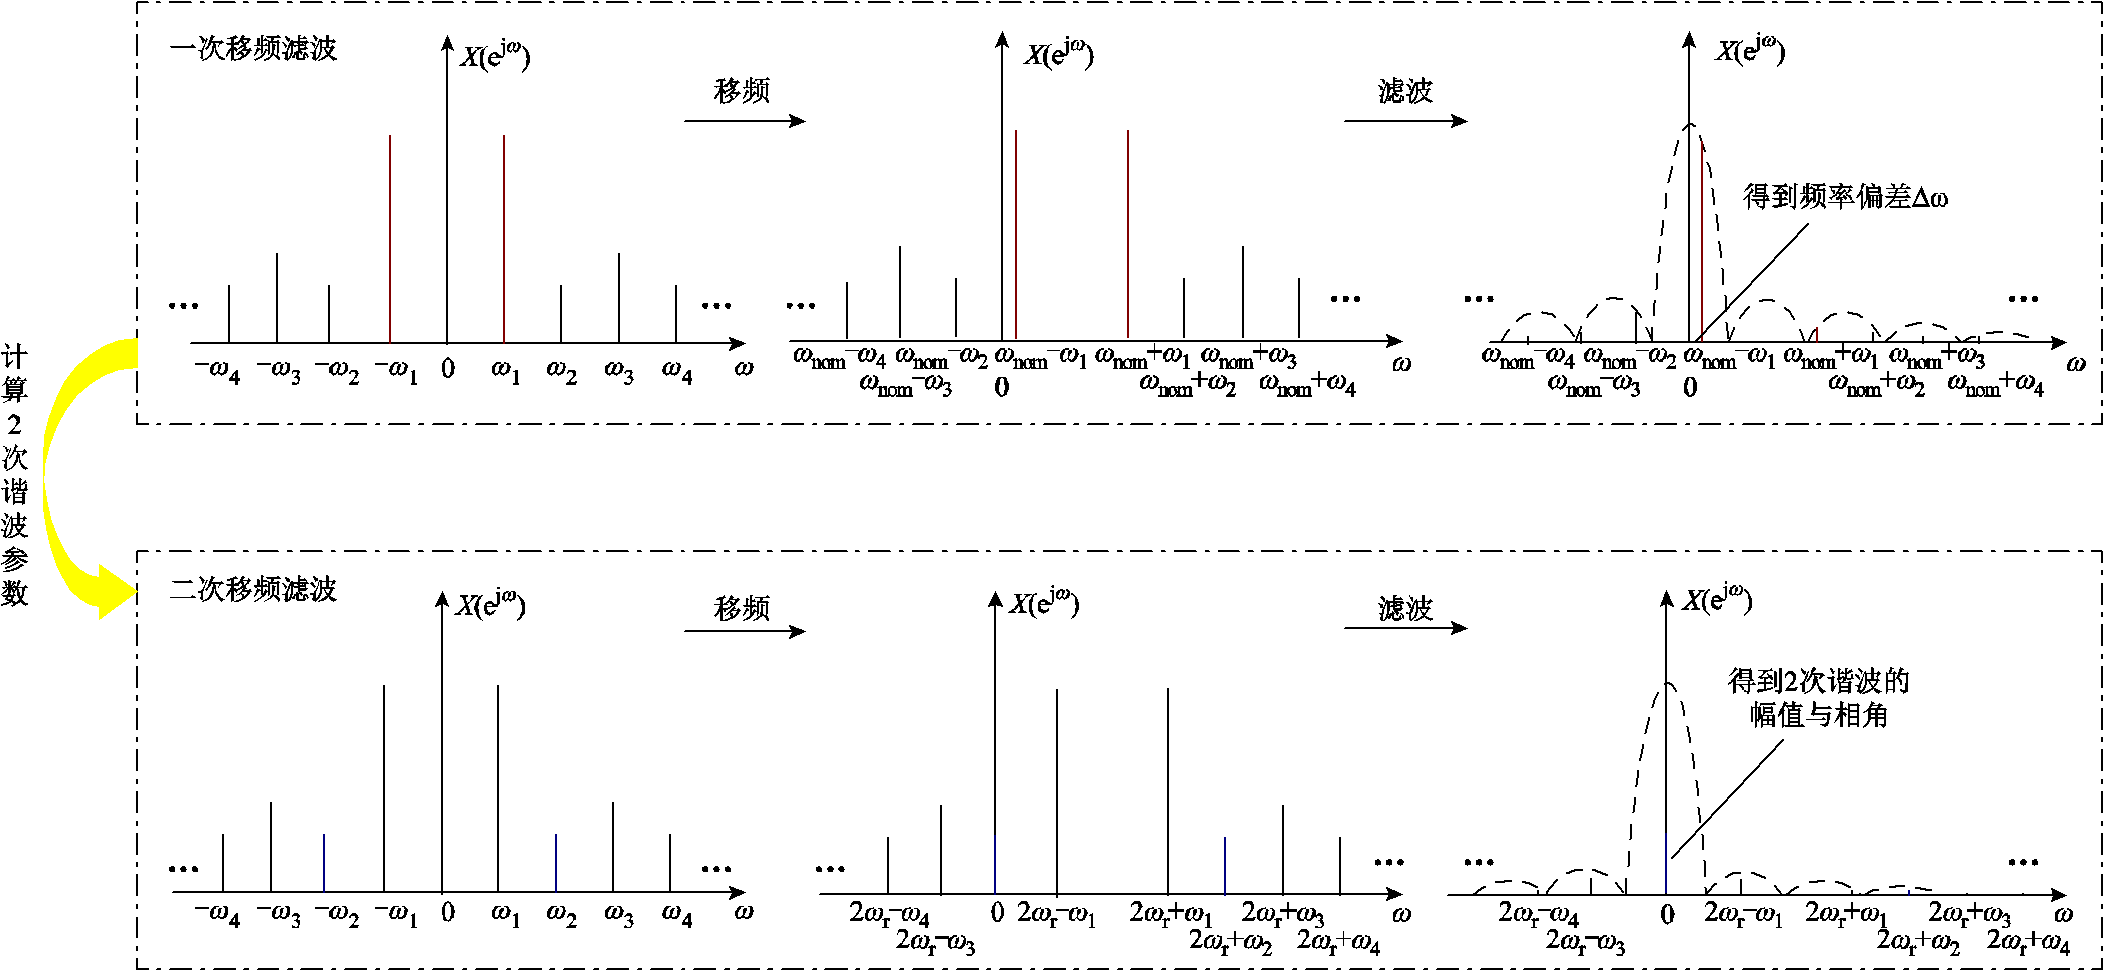
图3 自适应移频滤波算法示意图
Fig.3 The diagram of the adaptive frequency-shift filtering algorithm
为了评估算法的实时性能,本文对所提算法的时间复杂度进行分析。假设电网信号的采样点数为N,且算法中的卷积运算均采用快速卷积进行计算,则所提算法总共需要进行6Nlog2N次加法运算和2N(1+3log2N)次乘法运算,故算法的时间复杂度为O(Nlog2N)。与加窗插值FFT算法相比,两者的时间复杂度相当。然而,加窗插值FFT算法需要事先通过多项式拟合求解拟合系数。因此,在实际应用时,本文算法更加方便快捷,从而更具优势。
电网弱幅值谐波分量通常会被附近较大谐波幅值的频谱泄露所淹没,导致弱谐波幅值信号的测量结果误差较大。为验证本文所提算法的准确性,采用文献[29]中使用的弱幅值谐波信号进行仿真分析。该信号已在许多文献中被广泛使用,其表达式为
 (24)
(24)
式中,f0为基波频率,f0=49.5Hz;采样频率fs=8 kHz。仿真信号各次谐波具体参数见表1。
表1 弱幅值谐波信号各谐波分量参数
Tab.1 Parameters of each harmonic component of weak amplitude harmonic signal

谐波阶次Ah/Vφh/(°) 12205 20.110
(续)
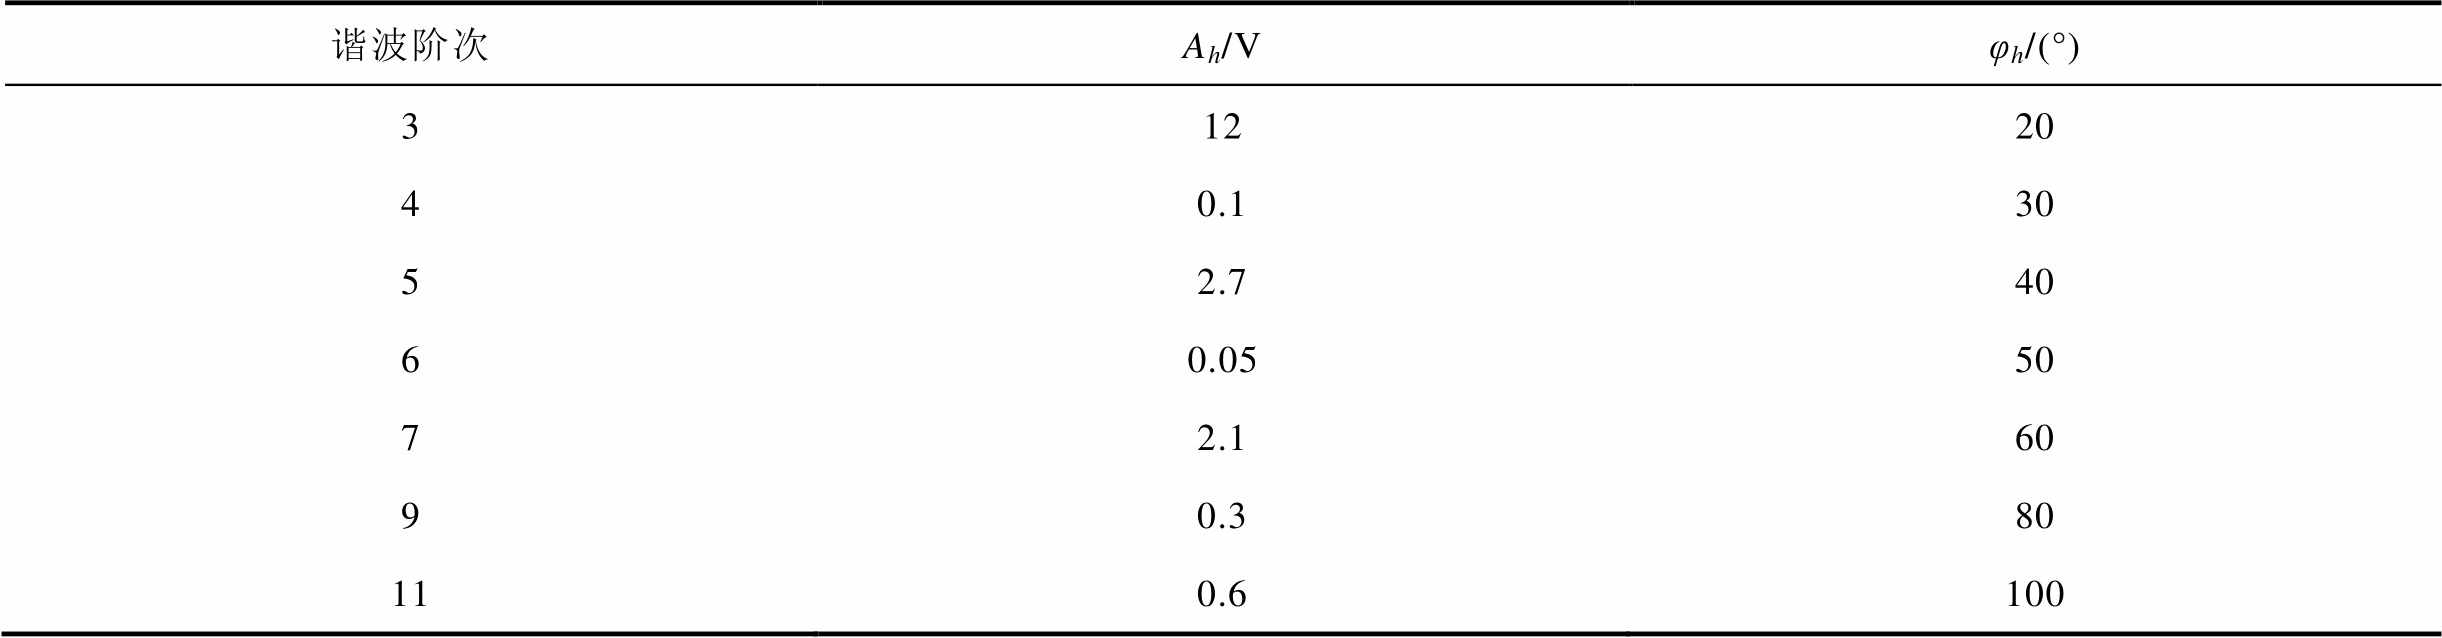
谐波阶次Ah/Vφh/(°) 31220 40.130 52.740 60.0550 72.160 90.380 110.6100
由所设定参数可知,仿真是在非同步采样下进行的。分别采用Hanning窗插值FFT(Hanning Window interpolation FFT, HW-FFT)、Blackman-Harris窗插值FFT(Blackman-Harris Window interpolation FFT, BHW-FFT)、四项三阶Nuttall窗插值FFT(4-term 3-order Nuttall Window interpolation FFT, NW-FFT)、移频滤波(Frequency Shift Filtering, FSF)与本文所提自适应移频滤波(Adaptive Frequency Shift Filtering, AFSF)算法对该信号的谐波参数进行分析比较,其中窗函数长度均为1 024。各个算法所得信号幅值和相角测量相对误差分别见表2和表3。
表2 不同算法对弱幅值谐波的幅值测量相对误差
Tab.2 Relative error of amplitude measurement of weak amplitude harmonic using different algorithms
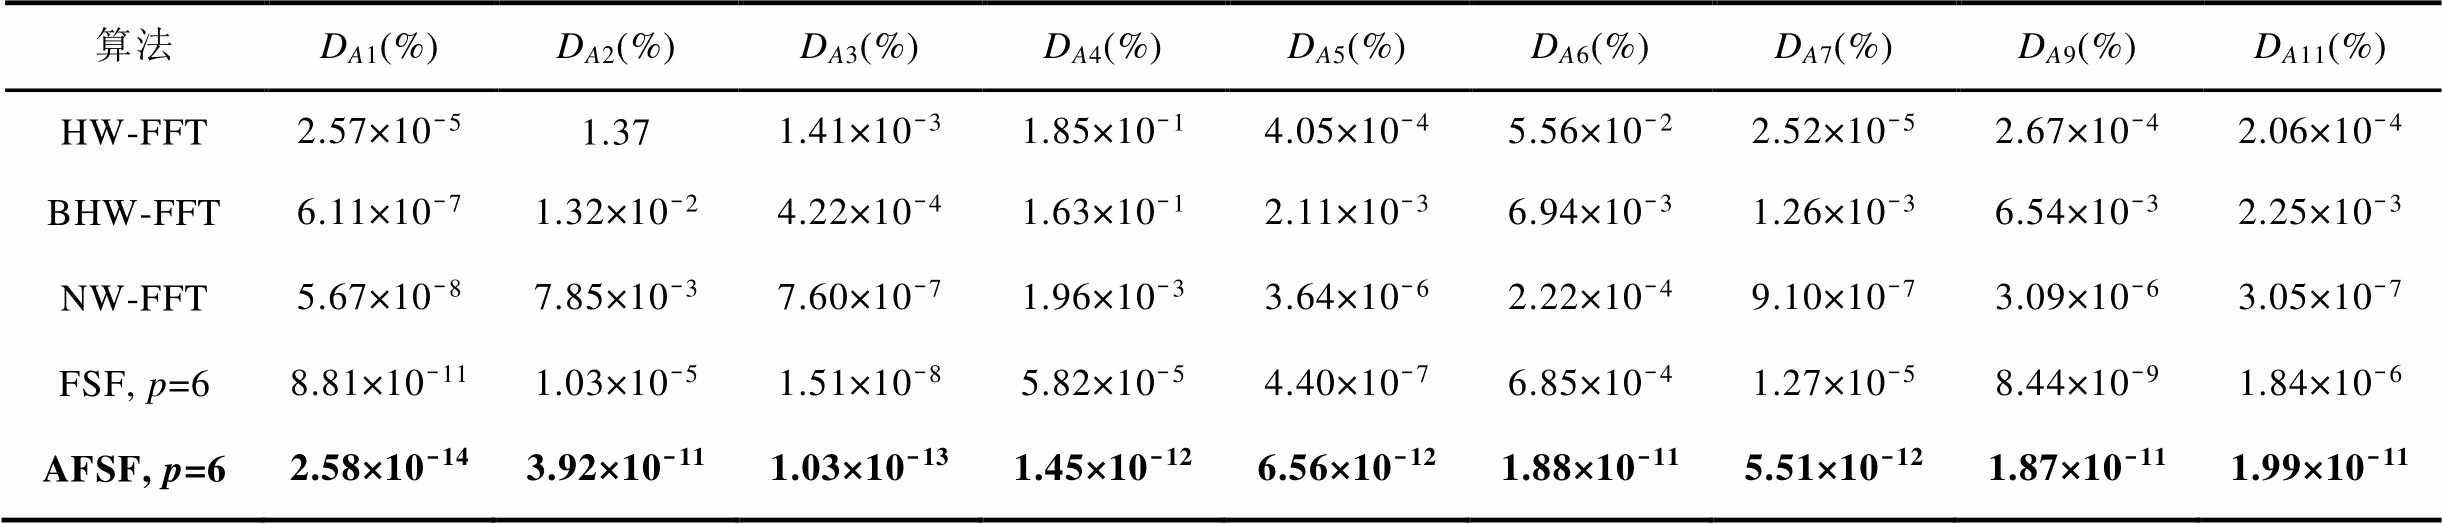
算法DA1(%)DA2(%)DA3(%)DA4(%)DA5(%)DA6(%)DA7(%)DA9(%)DA11(%) HW-FFT2.57×10-51.371.41×10-31.85×10-14.05×10-45.56×10-22.52×10-52.67×10-42.06×10-4 BHW-FFT6.11×10-71.32×10-24.22×10-41.63×10-12.11×10-36.94×10-31.26×10-36.54×10-32.25×10-3 NW-FFT5.67×10-87.85×10-37.60×10-71.96×10-33.64×10-62.22×10-49.10×10-73.09×10-63.05×10-7 FSF, p=68.81×10-111.03×10-51.51×10-85.82×10-54.40×10-76.85×10-41.27×10-58.44×10-91.84×10-6 AFSF, p=62.58×10-143.92×10-111.03×10-131.45×10-126.56×10-121.88×10-115.51×10-121.87×10-111.99×10⁻¹¹
表3 不同算法对弱幅值谐波的相角测量相对误差
Tab.3 Relative errors of phase measurement of weak amplitude harmonic using different algorithms
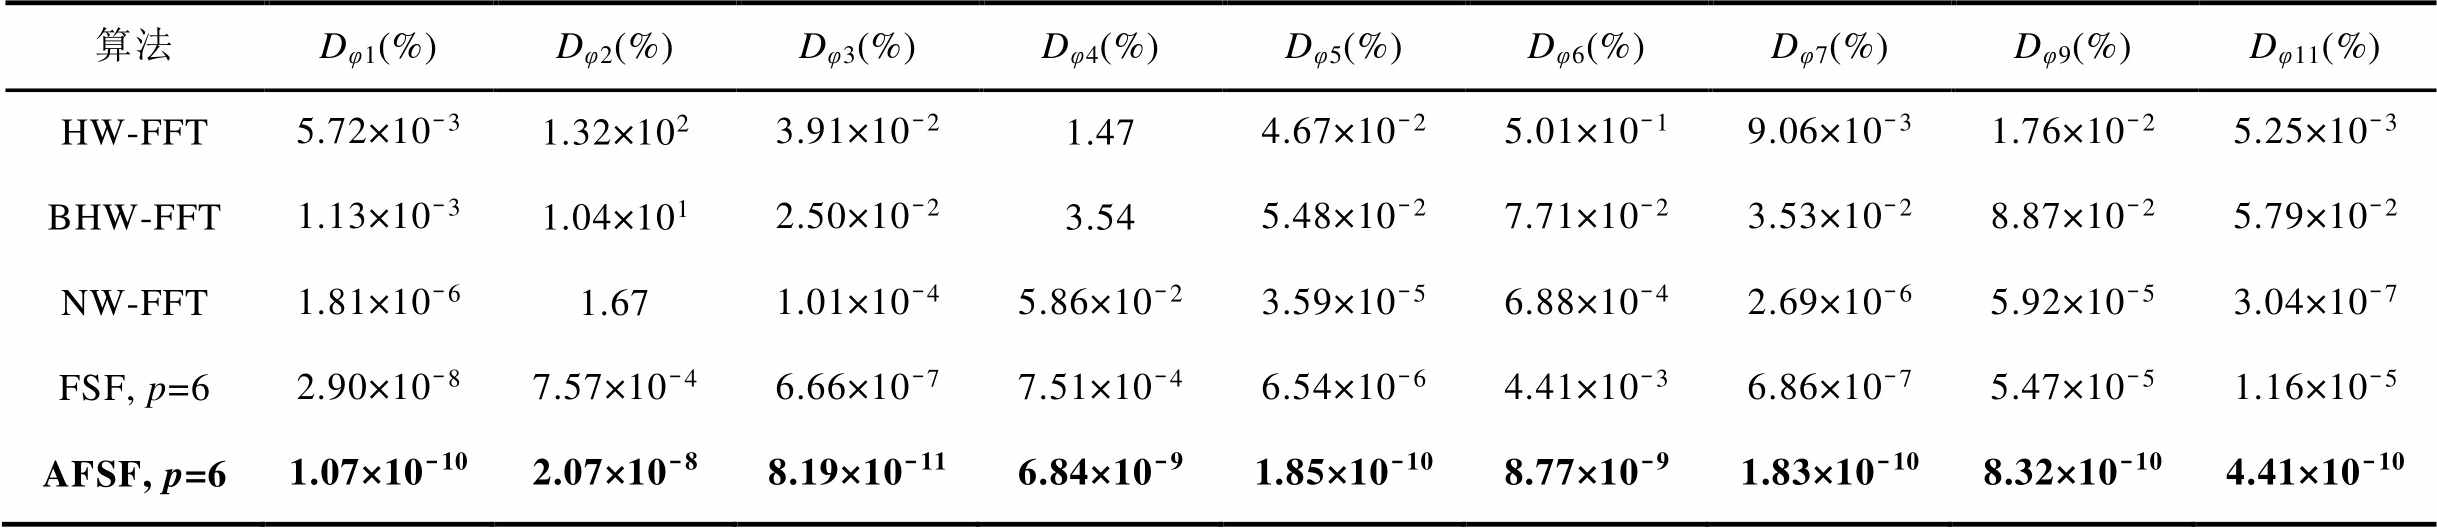
算法Dφ1(%)Dφ2(%)Dφ3(%)Dφ4(%)Dφ5(%)Dφ6(%)Dφ7(%)Dφ9(%)Dφ11(%) HW-FFT5.72×10-31.32×1023.91×10-21.474.67×10-25.01×10-19.06×10-31.76×10-25.25×10-3 BHW-FFT1.13×10-31.04×1012.50×10-23.545.48×10-27.71×10-23.53×10-28.87×10-25.79×10-2 NW-FFT1.81×10-61.671.01×10-45.86×10-23.59×10-56.88×10-42.69×10-65.92×10-53.04×10-7 FSF, p=62.90×10-87.57×10-46.66×10-77.51×10-46.54×10-64.41×10-36.86×10-75.47×10-51.16×10⁻⁵ AFSF, p=61.07×10-102.07×10-88.19×10-116.84×10-91.85×10-108.77×10-91.83×10-108.32×10-104.41×10⁻¹⁰
相较于其他阶次的谐波参数估计结果,2次谐波的估计精度明显较低。参见表1可知,2次谐波的幅值仅为0.1 V,远低于基波与3次谐波幅值。此时,2次谐波分量易被基波分量与3次谐波分量的频谱泄漏所淹没,从而出现较大的估计误差。
Nuttall窗具有较好的旁瓣特性,能够有效地抑制其他阶次谐波分量的频谱泄露。因此,NW-FFT的估计精度要高于其他加窗插值算法。然而在估计2次谐波的初相角时,NW-FFT仍然表现不足。因FSF将目标分量频谱搬移至接近零频的位置,可减少频谱泄露的影响,故采用FSF估计2次谐波估计的误差要远远小于加窗插值法。然而,由于仿真信号的基波频率为49.5 Hz,而FSF是以标称频率(fnom=50 Hz)进行频谱搬移的,故影响了其谐波幅值与相角的估计精度。本文提出的AFSF算法是对原始信号采用经校正后的移频函数进行频谱搬移的。所以虽然存在基波频率偏差,但目标频率分量仍旧能够被搬移至零频位置,从而可以得到高精度的谐波幅值与相角估计值。仿真实验结果表明,本文提出的算法具有最高的谐波参数估计精度。算法对于2次弱幅值谐波分量的幅值与相角的最大估计相对误差分别为3.92×10⁻¹¹%和2.07×10⁻⁸%。
为了验证本文所提算法在基波频率偏差情况下对谐波参数的估计性能,本节仍采用式(24)表示的谐波信号,并设置频率在49.5~50.5 Hz范围内以0.1 Hz为步长进行变动。采用p=6的SCMF和2.1节相同的参数设置。采用AFSF的谐波参数估计结果如图4所示。
从图4可以看出,由于本文所提算法采用实际频率的自适应校正,能够将目标频率分量搬移至零谱线处,即使基波频率存在波动,也不会对算法的估计精度造成较大影响。尽管2次弱谐波的估计误差较大,但所提算法对于2次谐波的幅值估计相对误差仍小于1×10⁻¹⁰%,相角估计相对误差小于1×10⁻⁷%。
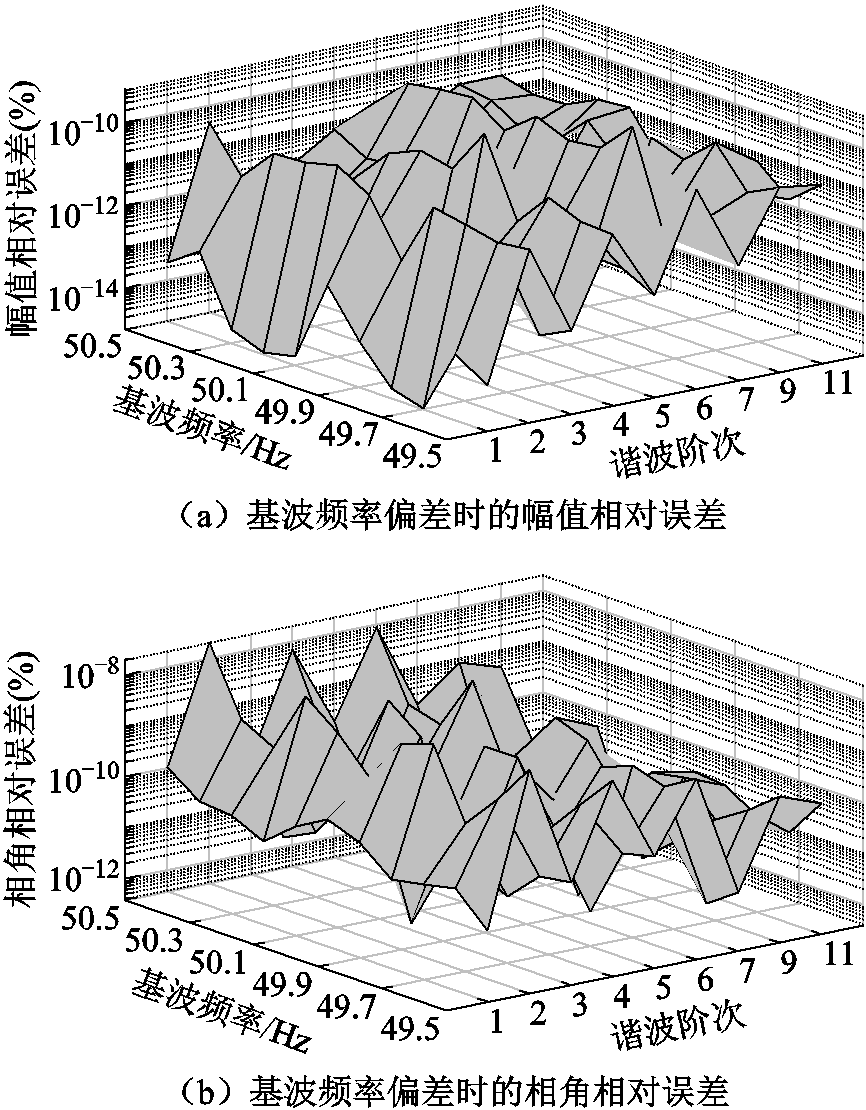
图4 基波频率偏差时本文所提算法的相对误差
Fig.4 The relative errors of the proposed algorithm when fundamental frequency deviation occurs
实际测量中存在的噪声会对谐波参数测量造成影响。为了验证本文所提算法在噪声环境下对谐波参数估计的准确性,将式(24)表示的谐波信号叠加信噪比为10~100 dB的高斯白噪声,同时设置基波频率为49.5 Hz。分别采用HW-FFT、BHW-FFT、NW-FFT、FSF与AFSF算法进行仿真实验,其中窗函数长度为1 024,FSF与AFSF均采用p=6的SCMF。考虑到高斯白噪声的随机性,在每个信噪比条件下均运行30 000次并取平均值。图5给出了白噪声影响下不同算法的基波幅值与基波相角的平均估计相对误差。
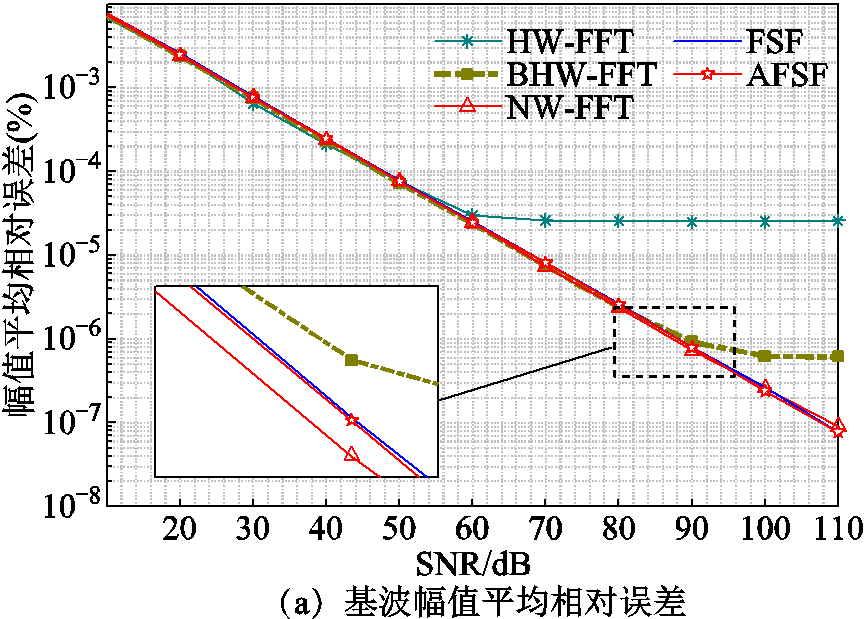
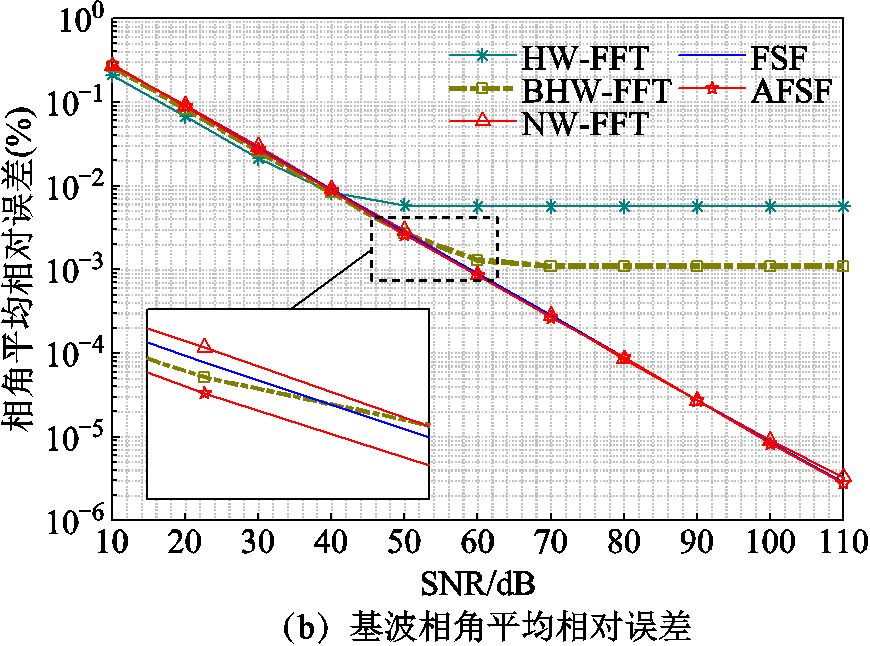
图5 白噪声影响下不同算法的基波平均相对误差
Fig.5 The average relative errors of fundamental wave with different algorithms under the influence of white noise
由图5可知,当信噪比增加到一定程度时,HW-FFT和BHW-FFT的谐波参数估计精度保持不变,这是因为受到所采用窗函数性能的限制,此时的估计误差主要来源于频谱泄露而不是白噪声。相比之下,NW-FFT、FSF与AFSF的估计精度几乎相同,且随着信噪比的增加而不断提高。然而,对于弱幅值谐波参数的检测,本文算法更具优势。
为了验证所提算法的准确性和有效性,本文在实际硬件平台上进行了测试。硬件测试平台的整体架构如图6所示,其中,标准源输出的谐波信号具体参数见表4。标准源的一路输出至标准仪表进行对比测试,另一路接入硬件测试平台。硬件测试平台的信号调理电路将测试谐波信号转换为适合模数转换器(Analog-to-Digital Converter, ADC)ADS8598H输入的交流小信号,在ADC中进行采样后,将其送入Zynq-7010进行算法计算并输出测量结果。
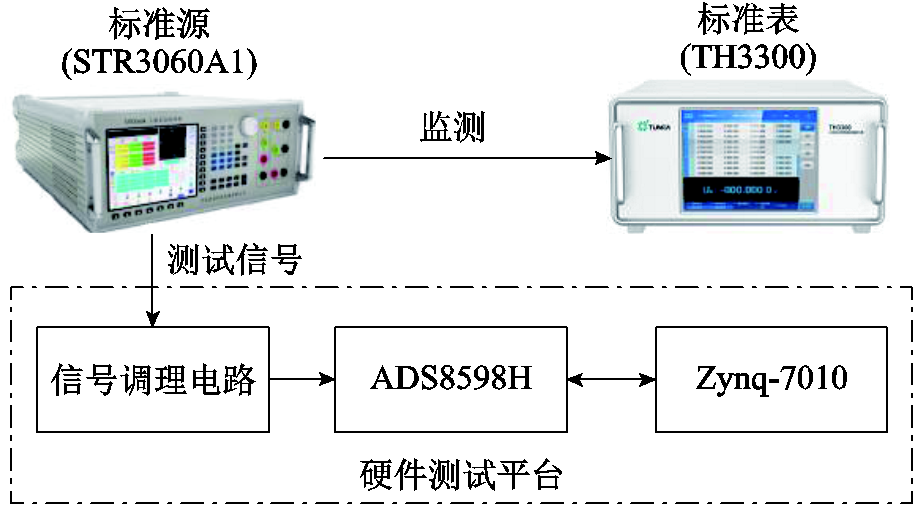
图6 实际硬件测试平台
Fig.6 The actual hardware test platform
实际测试结果见表5,其中,γA表示幅值相对误差,ΔP表示相角绝对误差。由表5可知,实际测量结果的幅值相对误差小于2.78%,相角绝对误差小于0.88°,满足GB/T14549—1993《电能质量公共电网谐波》中对A级仪表的要求。这表明所提算法在实际硬件平台上具有较高的准确性和可靠性,能够满足实际测量的需求。
表4 实际谐波信号相关参数
Tab.4 Parameters related to actual harmonic signal
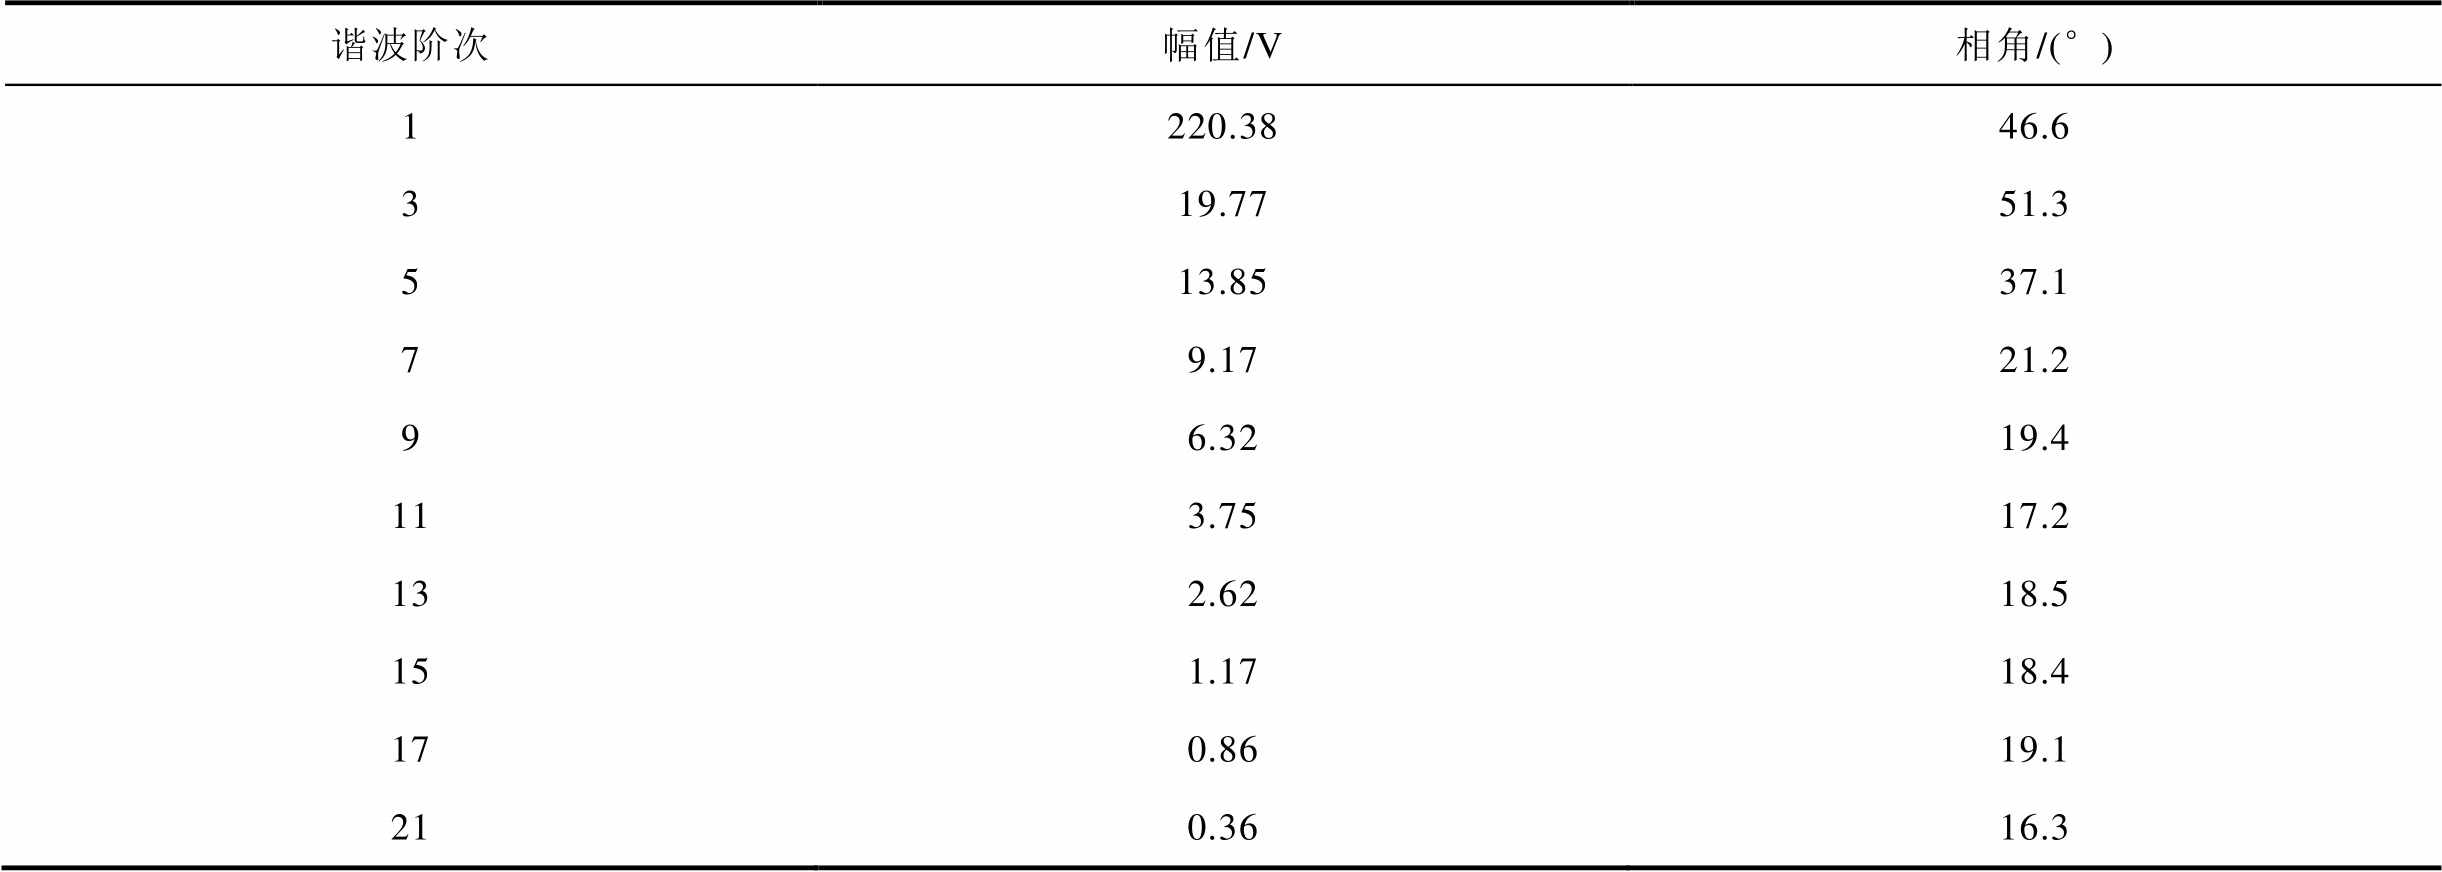
谐波阶次幅值/V相角/(°) 1220.3846.6 319.7751.3 513.8537.1 79.1721.2 96.3219.4 113.7517.2 132.6218.5 151.1718.4 170.8619.1 210.3616.3
表5 实际谐波信号测试结果
Tab.5 The test results of actual harmonic signal
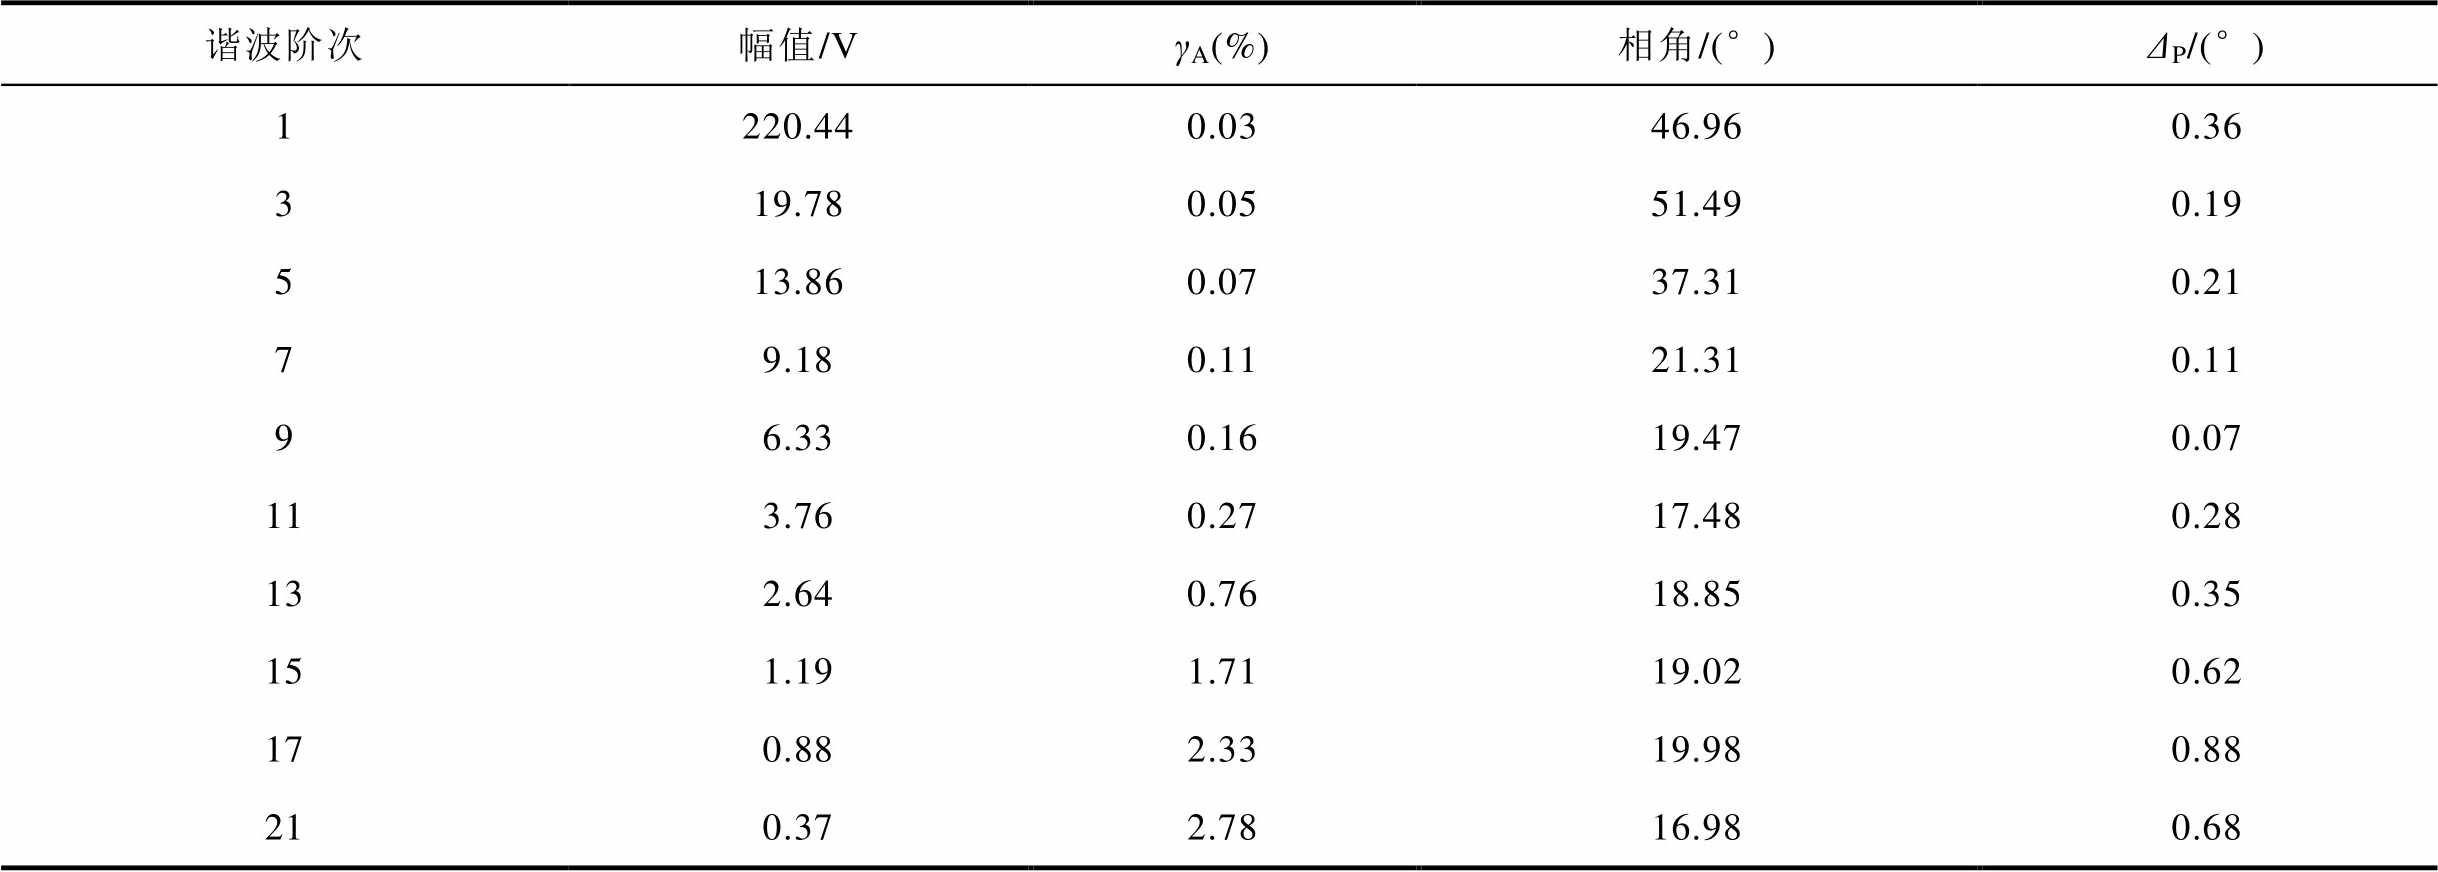
谐波阶次幅值/VγA(%)相角/(°)ΔP/(°) 1220.440.0346.960.36 319.780.0551.490.19 513.860.0737.310.21 79.180.1121.310.11 96.330.1619.470.07 113.760.2717.480.28 132.640.7618.850.35 151.191.7119.020.62 170.882.3319.980.88 210.372.7816.980.68
为实现电力系统谐波参数准确、有效的测量,本文提出了一种基于自适应移频滤波的电力系统谐波分析方法,以动态自适应调整频率偏差的方式来实现电网谐波参数的准确估计。该方法首先对原始谐波信号进行首次移频滤波处理以获取实际基波频率,并利用谐波实际基波频率偏差构造新移频函数以对原始谐波信号进行二次移频滤波运算;最后通过所推导公式计算得到各次谐波的幅值和相角信息。仿真和实际测量结果表明,本文所提方法能够准确、有效地检测电力系统谐波参数,在鲁棒性和实时性方面具有明显优势。尤其对于弱幅值谐波分量的检测,该方法表现出很强的适用性。此外,本文所提方法还能够为电力系统谐波参数的准确和实时检测提供新的解决方案与思路。
参考文献
[1] Ma Xiaoyang, Yang Qiuling, Chen Chang, et al. Harmonic and interharmonic analysis of mixed dense frequency signals[J]. IEEE Transactions on Industrial Electronics, 2021, 68(10): 10142-10153.
[2] Langella R, Testa A, Meyer J, et al. Experimental-based evaluation of PV inverter harmonic and interharmonic distortion due to different operating conditions[J]. IEEE Transactions on Instrumentation and Measurement, 2016, 65(10): 2221-2233.
[3] 杨逸帆, 赵兵兵, 康迪, 等. 基于改进希尔伯特-黄变换的电力系统谐波检测系统设计[J]. 电气技术, 2022, 23(5): 9-17.
Yang Yifan, Zhao Bingbing, Kang Di, et al. Design of power system harmonic detection system based on improved Hilbert-Huang transform[J]. Electrical Engineering, 2022, 23(5): 9-17.
[4] Memije D, Carranza O, Rodríguez J J, et al. Inverter harmonic perturbations rejection in renewable energy conversion systems applying a super-twisting algorithm[J]. IET Renewable Power Generation, 2021, 15(7): 1483-1497.
[5] 叶宗彬, 侯波, 张延澳, 等. 一种三相对称系统快速谐波检测算法[J]. 电工技术学报, 2023, 38(2): 510-522.
Ye Zongbin, Hou Bo, Zhang Yan'ao, et al. A fast harmonic detection algorithm for three-phase symmetric systems[J]. Transactions of China Electrotechnical Society, 2023, 38(2): 510-522.
[6] Louis A, Ledwich G, Walker G, et al. Measurement sensitivity and estimation error in distribution system state estimation using augmented complex Kalman filter[J]. Journal of Modern Power Systems and Clean Energy, 2020, 8(4): 657-668.
[7] Xia Xin, Li Chaoshun, Ni Wei. Dominant low-frequency oscillation modes tracking and parameter optimisation of electrical power system using modified Prony method[J]. IET Generation, Transmission & Distribution, 2017, 11(17): 4358-4364.
[8] Lin F J, Lu K C, Ke Tinghan. Probabilistic wavelet fuzzy neural network based reactive power control for grid-connected three-phase PV system during grid faults[J]. Renewable Energy, 2016, 92: 437-449.
[9] Xiao Liye, Shao Wei, Yu Mengxia, et al. Research and application of a hybrid wavelet neural network model with the improved cuckoo search algorithm for electrical power system forecasting[J]. Applied Energy, 2017, 198: 203-222.
[10] Chang G W, Lin Y L, Liu Y J, et al. A hybrid approach for time-varying harmonic and interharmonic detectionusing synchrosqueezing wavelet transform[J]. Applied Sciences, 2021, 11(2): 752.
[11] 黄冬梅, 唐志涛, 张晋轩, 等. 基于FFT的电力谐波分析方法[J]. 电工技术, 2022(20): 213-216.
Huang Dongmei, Tang Zhitao, Zhang Jinxuan, et al. Power harmonic analysis based on FFT[J]. Electric Engineering, 2022(20): 213-216.
[12] 王保帅, 肖勇, 胡珊珊, 等. 适用于非整数次幂的高精度混合基FFT谐波测量算法[J]. 电工技术学报, 2021, 36(13): 2812-2820, 2843.
Wang Baoshuai, Xiao Yong, Hu Shanshan, et al. High precision mixed radix FFT algorithm for harmonic measurement under non-integer power sequence[J]. Transactions of China Electrotechnical Society, 2021, 36(13): 2812-2820, 2843.
[13] Xi Yanhui, Tang Xin, Li Zewen, et al. Harmonic estimation in power systems using an optimised adaptive Kalman filter based on PSO-GA[J]. IET Generation, Transmission & Distribution, 2019, 13(17): 3968-3979.
[14] 杨挺, 武金成, 袁博. 谐波和间谐波检测的压缩感知恢复算法[J]. 中国电机工程学报, 2015, 35(21): 5475-5482.
Yang Ting, Wu Jincheng, Yuan Bo. The restoration algorithm of compressed sensing to detect harmonic and inter-harmonic[J]. Proceedings of the CSEE, 2015, 35(21): 5475-5482.
[15] Tang Yuanhong, Hu Weihao, Cao Di, et al. Artificial intelligence-aided minimum reactive power control for the DAB converter based on harmonic analysis method[J]. IEEE Transactions on Power Electronics, 2021, 36(9): 9704-9710.
[16] 吴建章, 梅飞, 郑建勇, 等. 基于改进经验小波变换和XGBoost的电能质量复合扰动分类[J]. 电工技术学报, 2022, 37(1): 232-243, 253.
Wu Jianzhang, Mei Fei, Zheng Jianyong, et al. Recognition of multiple power quality disturbances based on modified empirical wavelet transform and XGBoost[J]. Transactions of China Electrotechnical Society, 2022, 37(1): 232-243, 253.
[17] Wen He, Guo Siyu, Teng Zhaosheng, et al. Frequency estimation of distorted and noisy signals in power systems by FFT-based approach[J]. IEEE Transactions on Power Systems, 2014, 29(2): 765-774.
[18] Wen He, Teng Zhaosheng, Wang Yong, et al. Spectral correction approach based on desirable sidelobe window for harmonic analysis of industrial power system[J]. IEEE Transactions on Industrial Electronics, 2013, 60(3): 1001-1010.
[19] 吴禹, 唐求, 滕召胜, 等. 基于改进S变换的电能质量扰动信号特征提取方法[J]. 中国电机工程学报, 2016, 36(10): 2682-2689.
Wu Yu, Tang Qiu, Teng Zhaosheng, et al. Feature extraction method of power quality disturbance signals based on modified S-transform[J]. Proceedings of the CSEE, 2016, 36(10): 2682-2689.
[20] 陈至豪, 王立德, 王冲, 等. 基于组合余弦优化窗四谱线插值FFT的电力谐波分析方法[J]. 电网技术, 2020, 44(3): 1105-1113.
Chen Zhihao, Wang Lide, Wang Chong, et al. An approach for electrical harmonic analysis based on optimized composite cosine window four-spectrum-line interpolation FFT[J]. Power System Technology, 2020, 44(3): 1105-1113.
[21] 周西峰, 赵蓉, 郭前岗. Blackman-Harris窗的插值FFT谐波分析与应用[J]. 电测与仪表, 2014, 51(11): 81-85.
Zhou Xifeng, Zhao Rong, Guo Qiangang. Blackman-Harris window based interpolation FFT Harmonic analysis and its application[J]. Electrical Measurement & Instrumentation, 2014, 51(11): 81-85.
[22] Li Jianmin, Cao Yuanyuan, Zhang Xuhui, et al. An accurate harmonic parameter estimation method based on Slepian and Nuttall mutual convolution window[J]. Measurement, 2021, 174: 109027.
[23] 吴超凡, 陈隆道. 应用于电力谐波分析的改进相位差校正法[J]. 电工技术学报, 2017, 32(7): 158-164.
Wu Chaofan, Chen Longdao. Improved phase difference correction method applied to power harmonic analysis[J]. Transactions of China Electrotechnical Society, 2017, 32(7): 158-164.
[24] 贾清泉, 杨晓雯, 宋知用. 一种电力系统谐波信号的加窗频移算法[J]. 中国电机工程学报, 2014, 34(10): 1631-1640.
Jia Qingquan, Yang Xiaowen, Song Zhiyong. A window frequency shift algorithm for power system harmonic analysis[J]. Proceedings of the CSEE, 2014, 34(10): 1631-1640.
[25] 李文番, 张国钢, 钟浩杰, 等. 一种高频率分辨率的谐波、间谐波分析模型[J]. 电工技术学报, 2022, 37(13): 3372-3379, 3403.
Li Wenfan, Zhang Guogang, Zhong Haojie, et al. A high frequency resolution harmonic and interharmonic analysis model[J]. Transactions of China Electrote-chnical Society, 2022, 37(13): 3372-3379, 3403.
[26] 吴建章, 梅飞, 陈畅, 等. 基于经验小波变换的电力系统谐波检测方法[J]. 电力系统保护与控制, 2020, 48(6): 136-143.
Wu Jianzhang, Mei Fei, Chen Chang, et al. Harmonic detection method in power system based on empirical wavelet transform[J]. Power System Protection and Control, 2020, 48(6): 136-143.
[27] Yao Wenxuan, Teng Zhaosheng, Tang Qiu, et al. Measurement of power system harmonic based on adaptive Kaiser self-convolution window[J]. IET Generation, Transmission & Distribution, 2016, 10(2): 390-398.
[28] 李建闽, 滕召胜, 吴言, 等. 基于移频滤波的频率测量方法[J]. 中国电机工程学报, 2018, 38(3): 762-769.
Li Jianmin, Teng Zhaosheng, Wu Yan, et al. Frequency measurement algorithm based on frequency shift and filtering[J]. Proceedings of the CSEE, 2018, 38(3): 762-769.
[29] Shuai Zhikang, Zhang Junhao, Tang Lu, et al. Frequency shifting and filtering algorithm for power system harmonic estimation[J]. IEEE Transactions on Industrial Informatics, 2019, 15(3): 1554-1565.
Abstract With the increasing proportion of various types of nonlinear and impactive loads in the power grid, especially the large-scale integration of new energy sources represented by photovoltaic and wind power, the harmonic issues in the current power system are becoming increasingly severe. Accurately estimating harmonic parameters is not only critical for harmonic control but also an essential basis for power companies and users to evaluate power quality. To achieve accurate and effective detection of harmonic parameters in modern power systems, this paper proposes a power system harmonic analysis method based on adaptive frequency-shift filtering, which estimates harmonic parameters by dynamically and adaptively adjusting frequency deviations.
This method first performs a frequency-shift operation on the original power grid sampled signal based on the nominal frequency ωnom. Then, considering that it is difficult to completely filter out frequency components other than the target frequency component in a single filtering operation, this paper performs multiple iterations of filtering on the frequency-shift signal. Specifically, the frequency-shift signal is convolved with a p-order self-convolution mean filter (SCMF) to reduce the interference from other frequency components on the target frequency component. After the initial frequency-shift filtering of the power grid harmonic signal, the harmonic angular frequency deviation ∆ω, the actual fundamental frequency fr, and the new frequency-shift function corrected by ∆ω can be obtained. Next, according to the desired harmonic order hs and the frequency-shift function after correction, a second frequency-shift filtering process is carried out, moving the desired harmonic spectral line to the zero frequency position. Finally, the amplitude and phase of the desired harmonic component can be accurately obtained by using the derived formulas. For a power grid sampled signal with length N and using fast convolution for the convolution operation in the algorithm, the time complexity of the proposed algorithm is O(Nlog2N). Compared with the windowed interpolation FFT algorithm (WIFFT), the time complexity of both algorithms is similar. However, the WIFFT algorithm requires prior determination of fitting coefficients through polynomial fitting. Therefore, the algorithm proposed in this paper is more convenient and straightforward in practical applications, thus offering distinct advantages.
This paper conducted simulation experiments on the algorithm under conditions of weak amplitude harmonic signal, fundamental frequency deviation, noise impact, etc., and also established an actual hardware testing platform. The amplitude relative error and the phase absolute error of the actual measurement results fully meet the requirements of Class A meters in GB/T 14549 “Quality of electric energy supply — Harmonics in public supply network”. Simulation experiments and practical measurement results demonstrate that the proposed method can accurately and effectively detect power system harmonic parameters, showing significant advantages in robustness, adaptability, and real-time performance. Especially for detecting weak amplitude harmonic components, this method exhibits strong applicability. The proposed method can provide new solutions and ideas for the effective and fast analysis of harmonic parameters in complex power grid environments, as well as theoretical and engineering application issues related to electric energy science and accurate metering in the electric power system.
Keywords:Power system analysis, power quality, grid harmonics, frequency-shift filtering
DOI: 10.19595/j.cnki.1000-6753.tces.230786
中图分类号:TM933
国家自然科学基金(51907062, 52207076)、湖南省自然科学基金(2021JJ40354)和湖南省自科区域联合基金(2023JJ50025)资助项目。
收稿日期 2023-06-05
改稿日期 2023-08-04
李建闽 男,1985年生,副教授,硕士生导师,研究方向为电能质量检测、电力系统分析、智能检测与智能信息处理等。E-mail:ljmdzyx@163.com(通信作者)
曹远远 男,1995年生,硕士研究生,研究方向电气测量及其应用。E-mail:337908401@qq.com
(编辑 赫 蕾)