
图1 试验现场示意图及控制室设备实物图
Fig.1 Schematic diagram of the test site and physical diagram of the equipment
摘要 2019年夏季在广州开展了火箭引雷试验,成功地触发了14次闪电,总回击(RS)数达74次,平均回击数为5.3次,单次闪电的最大回击数为14次。该文对火箭引雷的回击电流及不同距离电场波形特征进行了分析。回击的间隔时间、峰值电流、10%~90%上升时间、半峰值宽度、1 ms转移电荷和1 ms作用积分的几何平均值分别为38.45 ms、12.38 kA、0.25 μs、8.31 μs、0.68 C和2.12×10³ A2·s,回击电流的转移电荷量和作用积分量均与回击峰值电流呈幂函数相关性。回击的先导电场强度峰值和回击电场强度峰值会随距离的增大而减小,而电场的10%~90%上升时间和半峰值宽度会随距离的增大而增大。回击电场强度峰值会随距离的增大而呈现出幂函数减小,且峰值电流与不同距离的先导电场强度峰值和回击电场峰值均呈现一定线性相关,距离越大,其线性拟合关系越好。
关键词:火箭引雷 电流 电场 回击
雷电是一种自然放电现象,能够在短时间内从雷暴云向地面转移大量电荷,会对电力系统造成严重的影响,甚至可能威胁人身安全[1-5]。而火箭触发闪电技术能够使闪电在指定地点和时间范围内发生,可以实现对光学设备观测视野的提前规划、对雷电流的直接测量及对闪电近距离电磁场进行同步记录[6]。
火箭触发闪电的发展过程主要包括三部分,即初始阶段(Initial Stage, IS)、回击阶段(Return Stroke, RS)和连续电流阶段(Continuous Current, CC)[7]。RS的电流峰值通常能达到十几到数十千安培,上升时间与半峰值宽度处于μs量级,并且许多研究已经证实了火箭触发闪电回击与自然闪电继后回击间电流和电磁场特性的相似性[8-10],因此火箭触发闪电的RS一直是研究的重点。
电流是反映放电过程和雷电强度的重要参数,对雷电防护而言非常重要。J. Schoene等[11]分析了在美国佛罗里达州成功触发的31次火箭触发闪电中共计117次回击的电流波形数据。郄秀书等[12]分析了2005—2010年在山东人工引发雷电实验中成功引发的22次负极性闪电,对36次实测回击电流波形参数进行了数理统计分析。张义军等[13]统计分析了2008—2014年在广东野外雷电综合观测试验的39次人工触发闪电,共包含106次回击,并和国内外相关结果进行了对比。
火箭触发闪电的电场波形中不仅包含着先导过程、连接过程及回击过程等丰富的物理信息[14],对于研究闪电机理非常重要,而且还可以用来估算回击电流峰值和定位闪电发生位置,评估闪电定位系统的有效性[15]。J. Schoene等[16]于2003年给出了1999—2000年在佛罗里达州测量的86个触发闪电回击在15 m和30 m处的电场波形参数。S. Mallick等[17]在佛罗里达州,对13次火箭触发闪电中69次负回击产生的远距离电场波形进行了研究,首次详细地描述了由火箭触发闪电产生的远电场波形。Qie Xiushu等[18]于2009年报告了2005—2007年在山东测量的10个触发闪电回击在60 m和550 m处的电场波形。
本文分析了火箭触发闪电的RS电流及58 m、90 m和1 600 m处的电场波形特征,研究了传播距离对电场特征参数的影响,还分析了RS不同距离电场强度与峰值电流间的关系,对研究闪电的物理机制和闪电定位系统的评估有重要意义[19]。
2019年夏季,武汉大学雷电防护与接地技术教育部工程研究中心与广东电科院、中国气象局合作,在广州从化的广州野外雷电实验基地(Guangdong Comprehensive Observation Experiment on Lightning Discharge, GCOELD)进行了火箭引雷试验[20]。
试验装置分布示意图及控制室部分设备实物图如图1所示。电流测量装置为1 mΩ同轴分流器,采集的电流数据由数字示波器DL850E进行采样,采样率为10 MHz。整个电流测量系统的带宽为20 MHz。使用平板天线作为垂直电场的测量设备,布置在三个观测点。观测点1位于距离闪电通道58 m处,电场波形由数据采集卡采集,采样率为10 MHz。观测点2距离闪电通道90 m,电场波形由示波器进行采样,采样率为50 MHz。观测点3位于一处建筑物的楼顶,距离闪电通道1 600 m,电场波形由数据采集卡采集,采样率为10 MHz。电场测量设备的3 dB带宽为160 Hz~0.5 MHz,时间常数为1 ms。
图1 试验现场示意图及控制室设备实物图
Fig.1 Schematic diagram of the test site and physical diagram of the equipment
2019年夏天共成功引发了14次火箭触发闪电,总回击数达74次,每次闪电的平均回击数为5.3次,单次闪电的最大回击次数为14次。共获取了61次RS的电流波形,48次RS的58 m处电场波形,25次RS的90 m处电场波形,12次RS的1 600 m处电场波形。
本文测得的典型火箭触发闪电RS电流波形如图2所示。对六个特征参数进行了统计,分别为回击间隔时间TIN(ms)、峰值电流Ip(kA)、10%~90%上升时间T10-90(μs)、半峰值宽度THPW(μs)、1 ms转移电荷量Q1ms(C)和1 ms作用积分AI1ms(103 A2·s)。回击间隔时间是指两次相邻回击的时间间隔。转移电荷指的是电流的积分,而作用积分是指电流二次方的积分,RS之后通常具有持续时间较长的连续电流阶段(CC),因此积分范围为RS开始后1 ms。
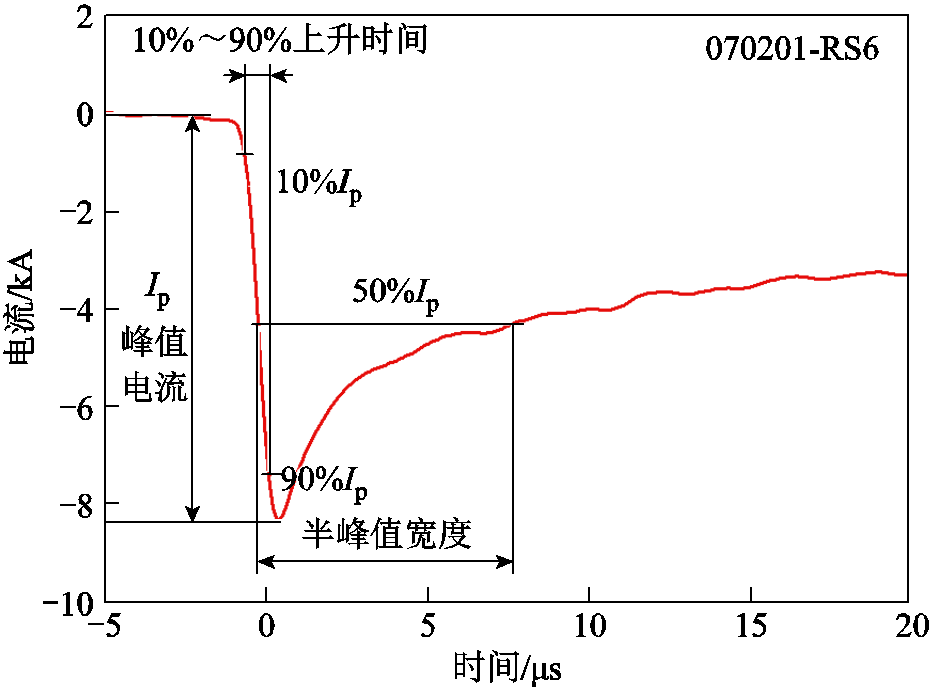
图2 RS电流波形
Fig.2 RS current waveform and definition of partial parameters
RS电流波形参数及与其他作者的比较见表2,特征参数的分布如图3所示,其中N为数量,AM(arithmetic mean)为算术平均值,GM(geometric mean)为几何平均值。回击间隔时间的长短能够反映雷暴云内电荷快速释放后重新积累的速度。回击间隔时间分布较广,最小值为2.44 ms,最大值为189.92 ms,回击间隔时间主要分布在0~100 ms,占比85.7%,算数平均值为54.69 ms,几何平均值为38.45 ms。这说明两次相邻回击可能接连发生,也可能相隔很久才发生,回击间隔时间的长短与雷暴云所含电荷量、电荷重聚时间、通道阻抗变化情况、连续电流的存在等诸多因素有关。
表2 RS电流波形参数及与其他作者的比较
Tab.2 The parameters of RS current waveform and comparison with other authors
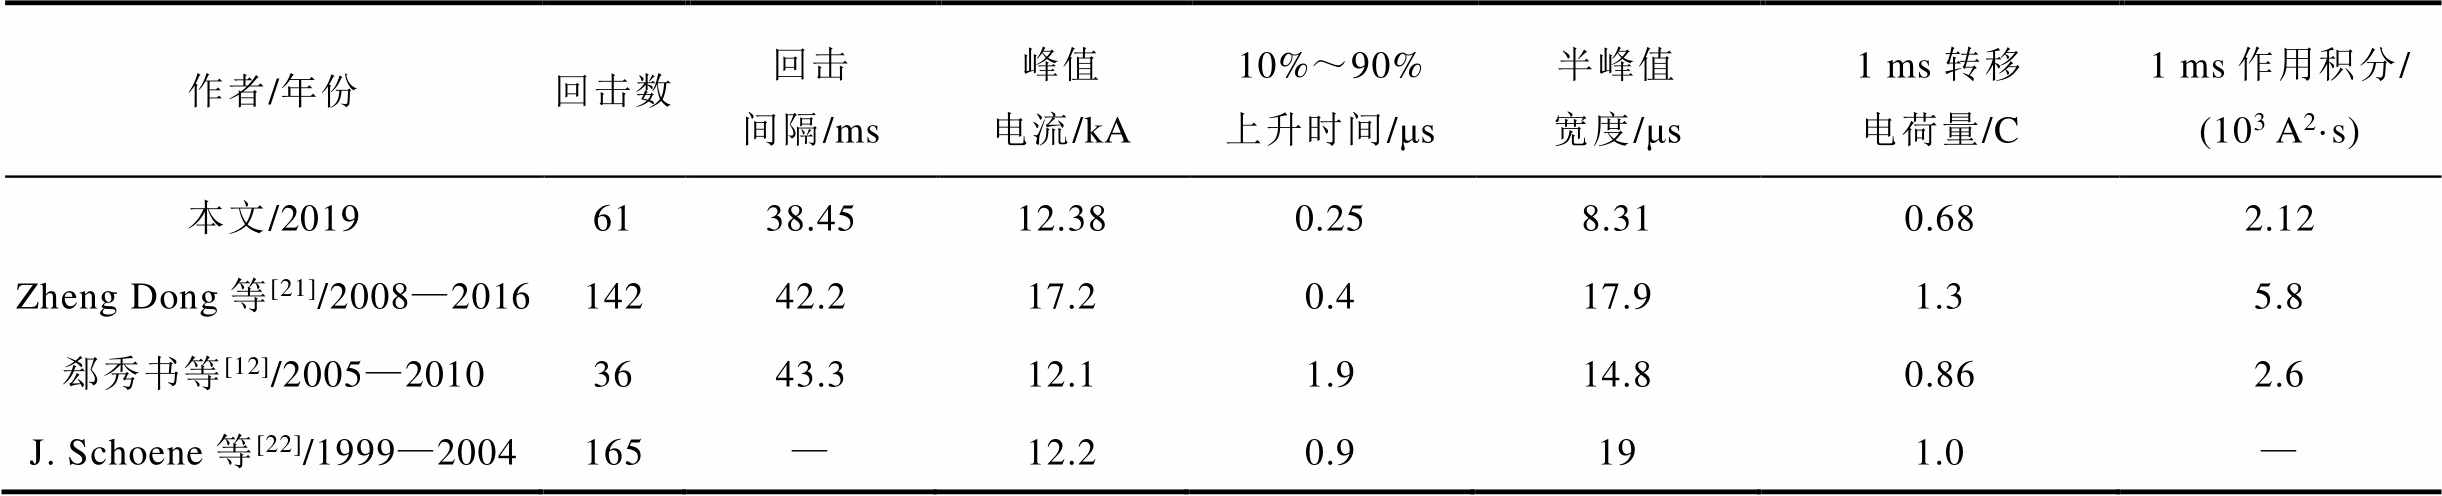
作者/年份回击数回击间隔/ms峰值电流/kA10%~90%上升时间/μs半峰值宽度/μs1 ms转移电荷量/C1 ms作用积分/ (103 A2·s) 本文/20196138.4512.380.258.310.682.12 Zheng Dong等[21]/2008—201614242.217.20.417.91.35.8 郄秀书等[12]/2005—20103643.312.11.914.80.862.6 J. Schoene等[22]/1999—2004165—12.20.9191.0—
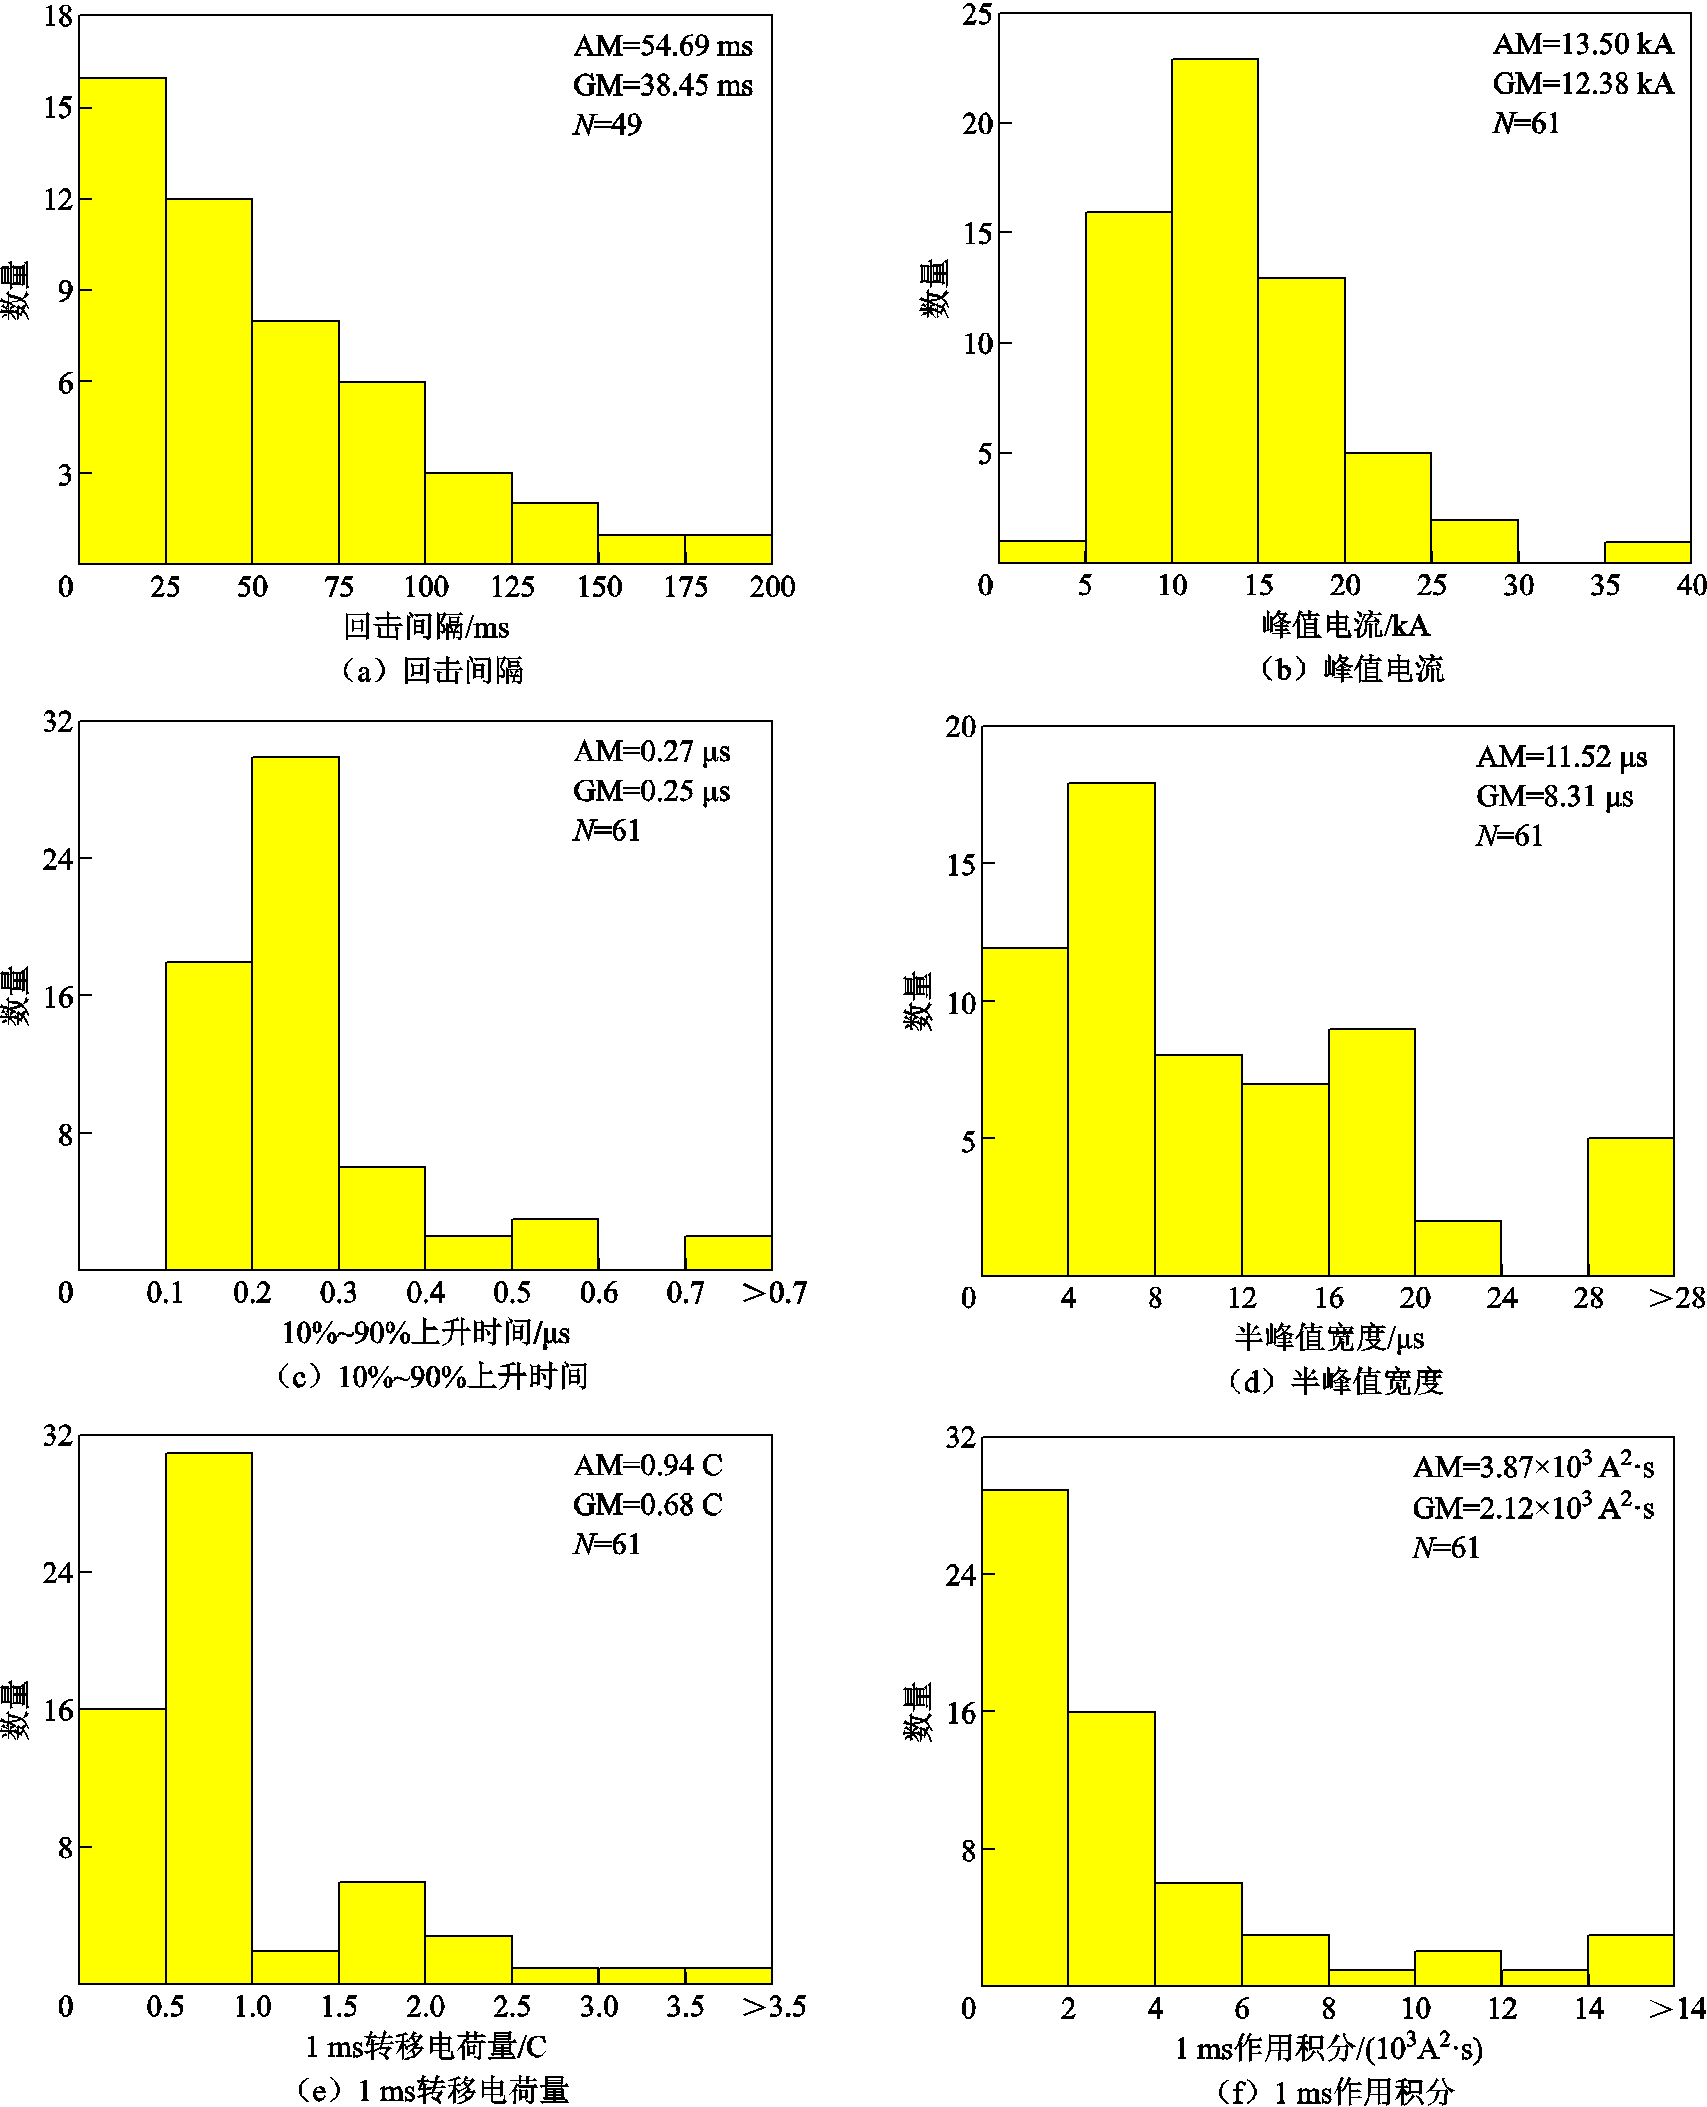
图3 RS电流波形参数分布
Fig.3 Distribution of RS current waveform parameters
峰值电流是反映放电强度最直观的特征参数。RS的峰值电流主要分布在5~20 kA范围内,占比85.2%,算术平均值为13.50 kA,几何平均值为12.38 kA,最小峰值电流为3.27 kA,最大峰值电流达到36.47 kA。
10%~90%上升时间能够直接反映RS上升沿的陡度,上升时间越短,陡度就越大,对电力系统的危害也越大。10%~90%上升时间主要分布在0.1~0.4 μs,占比88.5%,最小值为0.13 μs,最大值为0.80 μs,算术平均值为0.27 μs,几何平均值为0.25 μs。
半峰值宽度通常用来表征脉冲的宽度。本文统计的RS半峰值宽度分布较为分散,最小值为2.19 μs,最大值为57.83 μs,主要分布在0~20 μs,占比88.5%,算术平均值和几何平均值分别为11.52 μs 与8.31 μs。
回击1 ms转移电荷量主要分布在0~1.0 C区间,占比77.0%,最小值为0.05 C,最大值为5.24 C,算术平均值和几何平均值分别为0.94 C与0.68 C,部分RS的转移电荷较大,甚至比平均值大一个数量级,该类RS对电力设备的危害更大,更需要关注和研究。
1 ms作用积分表征了雷电流的电阻能量,能够用以评估RS对电力设备的危害。本文测得的回击1 ms作用积分主要分布在0~4×10³ A2·s区间,占比73.8%,最小值为0.14×10³ A2·s,最大值为35.77×10³ A2·s,算术平均值和几何平均值分别是3.87×10³ A2·s与2.12×10³ A2·s。且和转移电荷量一样,部分RS的作用积分较大。
通过与其他文献的统计结果[12,21-22]比较发现,本文统计的回击间隔、峰值电流、1 ms转移电荷量和1 ms作用积分的几何平均值与其他文献的结果统计接近,而10%~90%上升时间、半峰值宽度小于其他文献的统计结果。上升时间与半峰值宽度测量会受到测量系统带宽的限制,对频率响应非常敏感。Yang Jing等[23]对山东人工引发雷电实验获取的电流数据进行了分析,发现罗氏线圈的上限截止频率为1 MHz,不能较好地反映高频成分,会导致上升时间增大。另外由于实验中所用的引流杆由几段组合而成,在连接处会不可避免地发生反射,J. Schoene等[24]认为反射可能是导致较大上升时间的一个原因。R. J. Fisher等[9]分析认为高频响应不足通常会低估峰值和半峰值,这将导致对半峰值宽度的高估;而低频响应不足产生的低频误差将以电流更快衰减的方式影响闪电电流波形的尾部,将导致对半峰值宽度的低估。本文电流测量系统的频率响应是DC~20 MHz,具有较宽的频率响应特性,能够确保数据的可靠性。
本文还分析了RS电流波形特征参数间的关系,如图4所示。1 ms转移电荷量与峰值电流呈较好的相关性,回归方程为Q1ms=0.006Ip1.869,相关系数R2=0.88。1 ms作用积分量与峰值电流同样呈较好相关性,回归方程为AI1ms=0.003Ip2.601,相关系数R2=0.89。
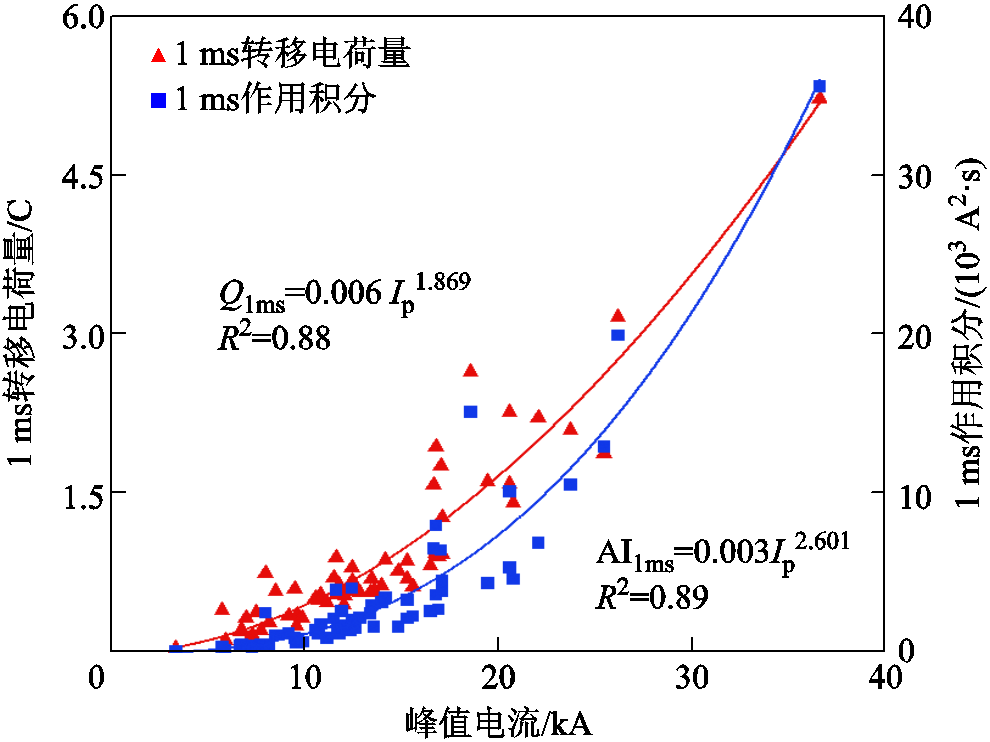
图4 峰值电流与1 ms转移电荷量和1 ms作用积分间的关系
Fig.4 Relationship between peak current and 1 ms transferred charge and 1 ms action integral
RS不同距离处电场波形及特征参数定义如图5所示,统计结果见表3。对于电场波形共定义了五个特征参数,分别是先导电场强度峰值EL(kV/m)、回击电场强度峰值ERS(kV/m)、10%~90%上升时间T10-90(μs)、半峰值宽度THPW(μs)和反峰比EOS/EL(%)。通过对比发现,不同距离处电场波形的特征参数具有较大差异。图6分别给出了58 m处和90 m处RS电场波形特征参数分布。
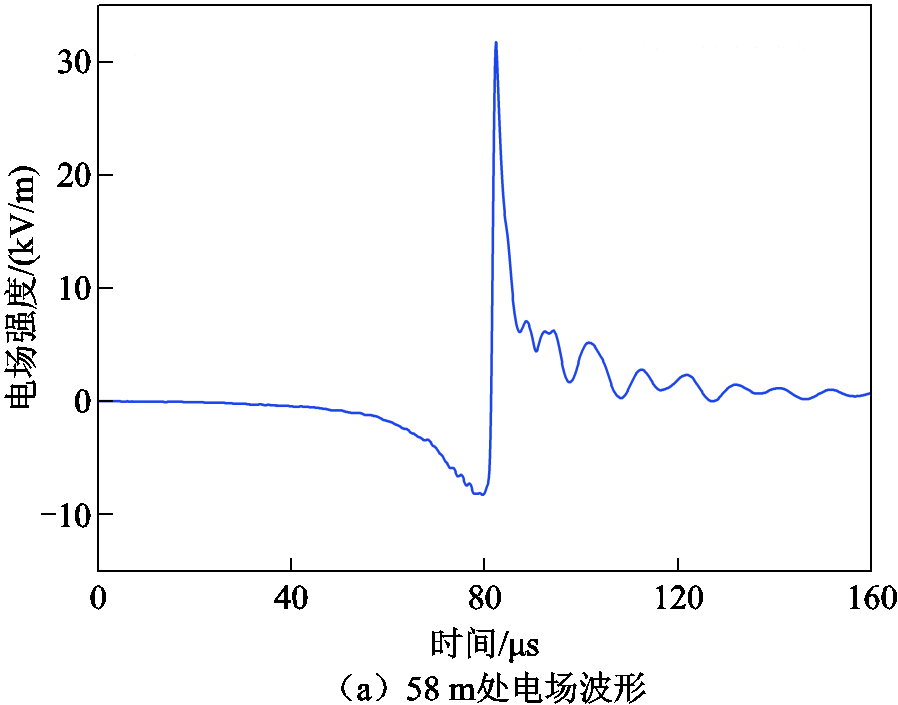
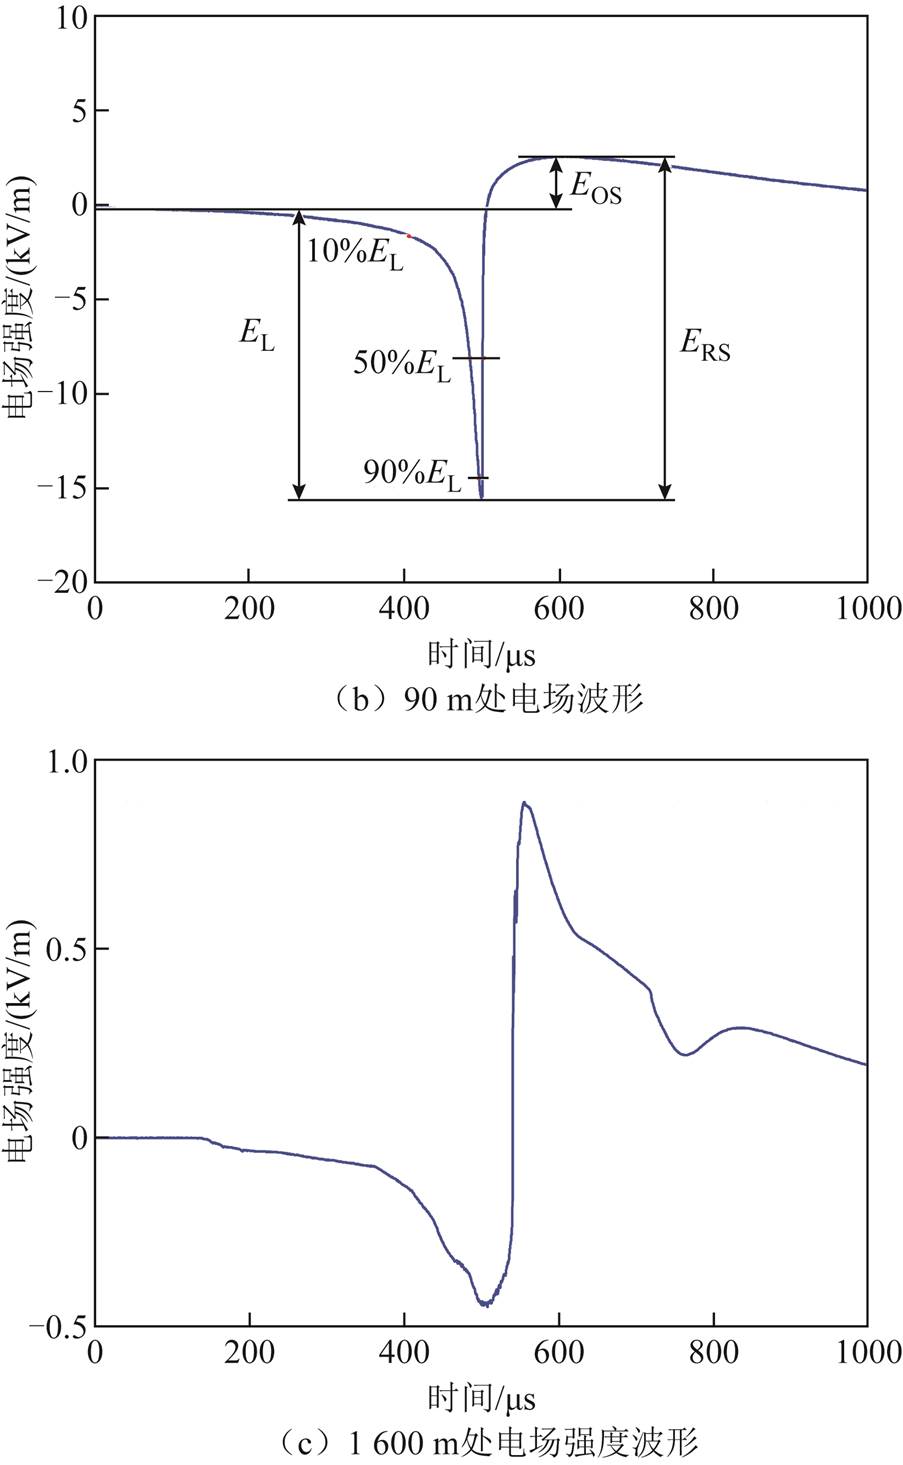
图5 不同距离处RS电场波形及参数定义
Fig.5 RS electric field waveforms at different distances and definition of parameters
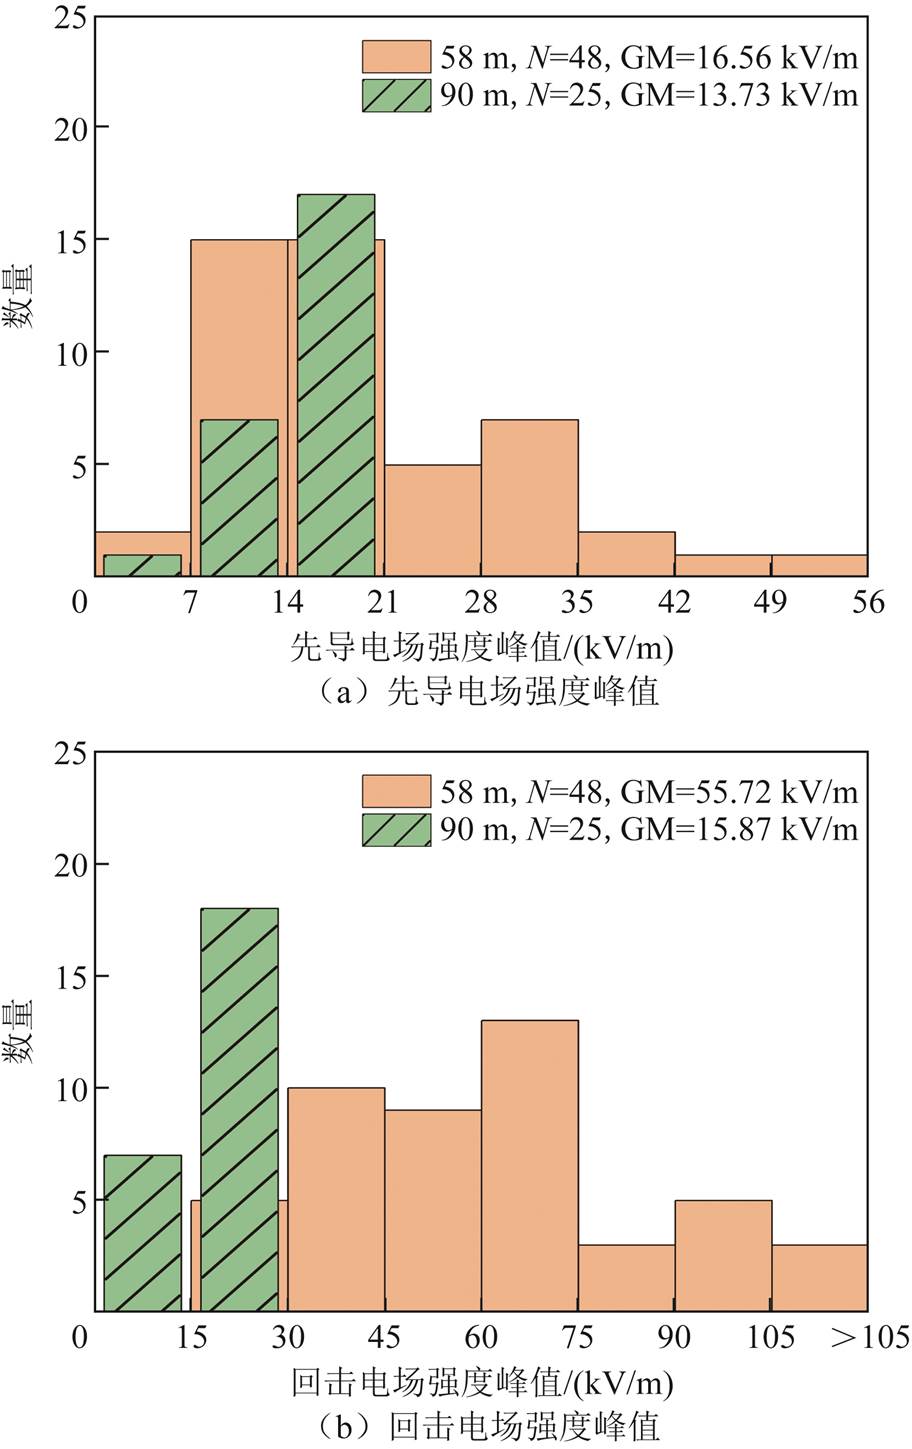
图6 58 m和90 m处RS电场波形参数分布
Fig.6 Distribution of RS electric field waveform parameters at 58 m and 90 m
58 m处的先导电场强度峰值主要集中在7~21 kV/m,占比62.5%,几何平均值为16.56 kV/m。90 m处的先导电场强度峰值同样主要集中在7~21 kV/m,但占比更高,为96.0%,几何平均值为13.73 kV/m。1 600 m处的先导电场强度峰值的几何平均值为0.36 kV/m。先导电场强度峰值展现出随着距离的增加而减小的趋势。
58 m处的回击电场强度峰值分布较为分散,最小值为21.66 kV/m,最大值为137.33 kV/m,几何平均值为55.72 kV/m。90 m处的回击电场强度峰值均处于0~30 kV/m区间内,几何平均值为15.87 kV/m。12次RS的1 600 m处的电场波形中7次RS的回击电场强度峰值均超出了测量量程,因此样本数只有5个,几何平均值为0.78 kV/m。回击电场强度峰值同样展现出随着距离的增加而减小的趋势。
58 m处的10%~90%上升时间主要集中在0~30 μs,占比72.9%,几何平均值为21.32 μs。90 m处的10%~90%上升时间主要集中在30~90 μs,占比68.0%,几何平均值为85.65 μs。1 600 m处的10%~90%上升时间的几何平均值为782.90 μs。10%~90%上升时间展现出随着距离的增加而增大的趋势。
58 m处的半峰值宽度主要集中在0~14 μs,占比85.4%,几何平均值为6.81 μs。90 m处的半峰值宽度主要集中在7~21 μs,占比80.0%,几何平均值为15.49 μs。1 600 m处的10%~90%上升时间的几何平均值为476.98 μs。半峰值宽度展现出随着距离的增加而增大的趋势。
58 m处的反峰比分布较为分散,最小值为70.34%,最大值为963.26%,几何平均值为223.14%。90 m处的反峰比主要集中在0~50%,占比96.0%,几何平均值为13.29%。1 600 m处的反峰比的几何平均值为204.51%。
为了比较不同距离下回击电场波形特征的差异,将先导电场强度峰值与回击电场强度峰值进行了归一化处理。将峰值电流水平归一化为15 kA,去除电流峰值大小差异对电场强度峰值的影响。对回击电场强度峰值和距离进行拟合分析如图7所示,二者呈现幂函数相关,回归方程为ERS=1117D-0.9,相关系数R2=0.99,为强相关。
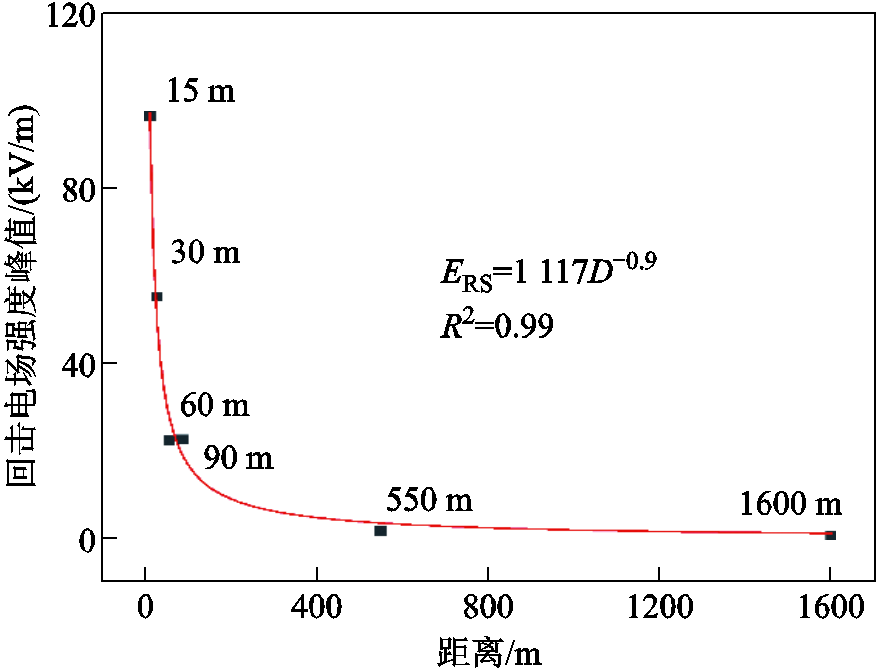
图7 回击电场峰值与距离之间的关系
Fig.7 Relationship between return stroke electric field peak and distance
峰值电流与58 m处的先导电场强度峰值和回击电场强度峰值的拟合关系如图8所示。先导电场强度峰值与峰值电流呈现出一定的线性正相关,回归方程为EL=0.968Ip+3.714,相关系数R2=0.39,相对较小。而回击电场强度峰值与峰值电流则呈现出较强的线性正相关,回归方程为ERS=3.647Ip+9.515,相关系数R2=0.84。
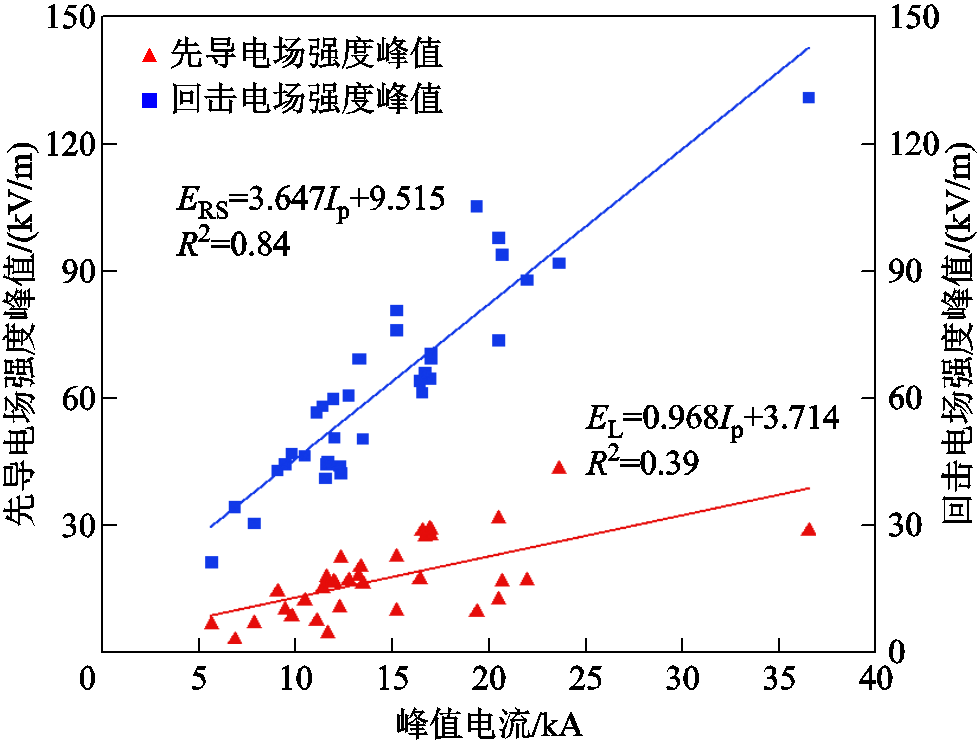
图8 58 m处先导电场强度峰值和回击电场强度峰值与峰值电流之间的关系
Fig.8 Relationship between leader electric field peak and return stroke electric field peak and peak current at 58 m
峰值电流与90 m处的先导电场强度峰值和回击电场峰值的拟合关系如图9所示。先导电场强度峰值和回击回击电场强度峰值与峰值电流的回归方程分别为EL=0.803Ip+5.530和ERS=0.862Ip+7.245,相关系数R2分别为0.76和0.72。
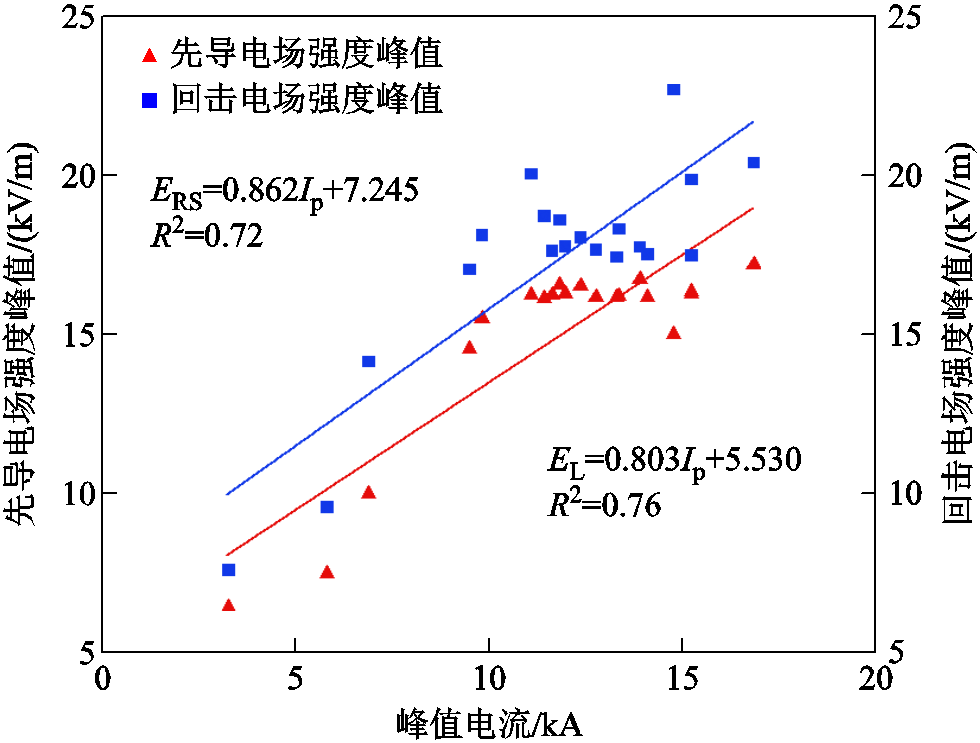
图9 90 m处先导电场强度峰值和回击电场强度峰值与峰值电流之间的关系
Fig.9 Relationship between leader electric field peak and return stroke electric field peak and peak current at 90 m
峰值电流与1 600 m处的先导电场强度峰值和回击电场强度峰值的拟合关系如图10所示。先导电场强度峰值和回击电场强度峰值与峰值电流的回归方程分别为EL=0.0164Ip+0.0405和ERS=0.0532Ip+ 0.0799,相关系数R2分别为0.80和0.95。
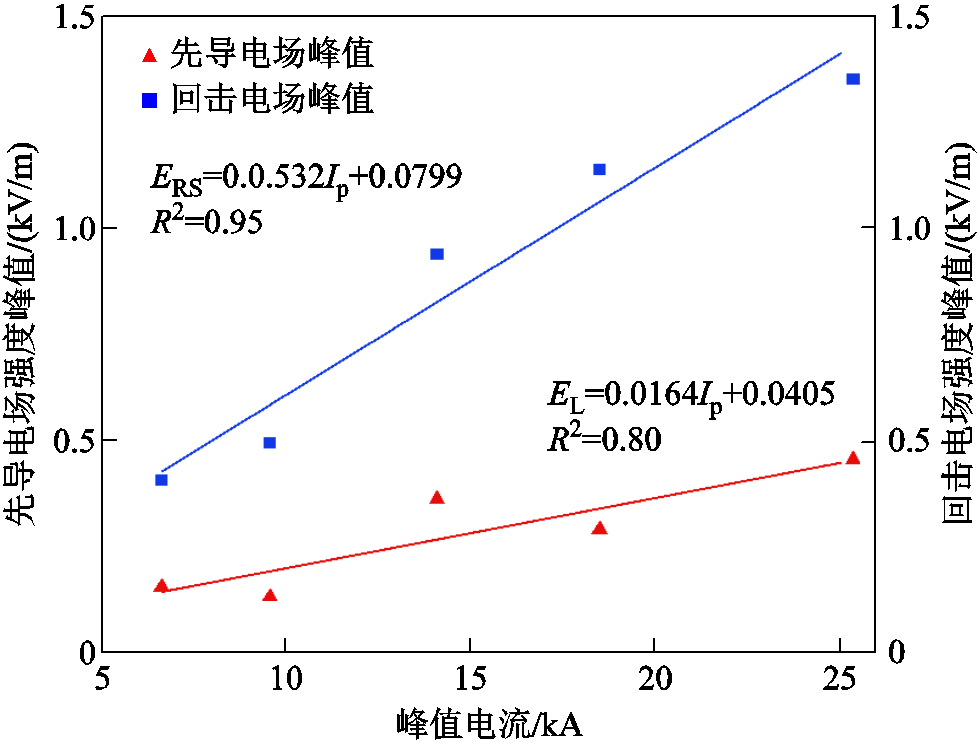
图10 1 600 m处先导电场强度峰值和回击电场强度峰值与峰值电流之间的关系
Fig.10 Relationship between leader electric field peak and return stroke electric field peak and peak current at 1 600 m
总的来看,峰值电流与不同距离的先导电场强度峰值和回击电场强度峰值间均呈现出线性关系。 1 600 m的样本量虽然最小,但明显优于58 m和 90 m的拟合效果。
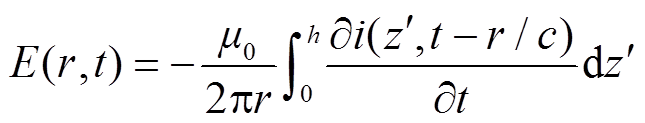
图11给出了闪电通道电磁场辐射原理示意图。已知地闪回击通道电流或电荷分布情况和在Lorentz规范下,地面任意距离处的垂直电场强度的计算公式[25-26]为
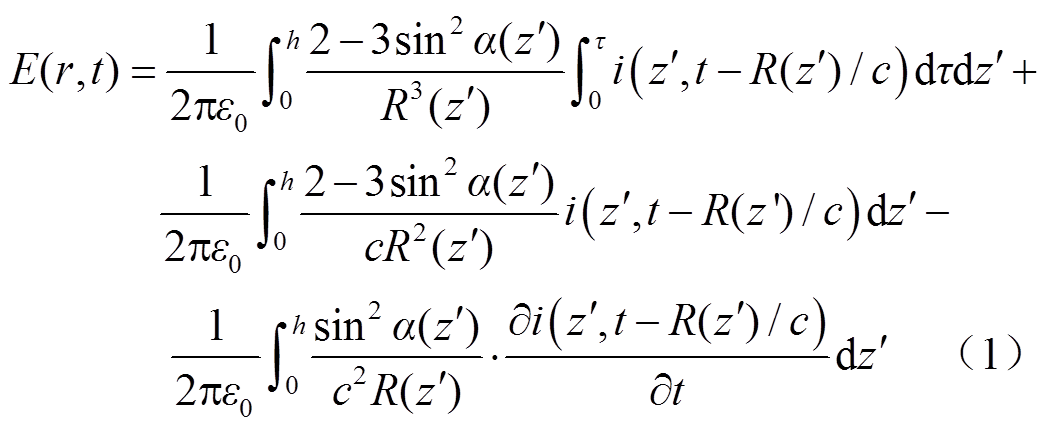
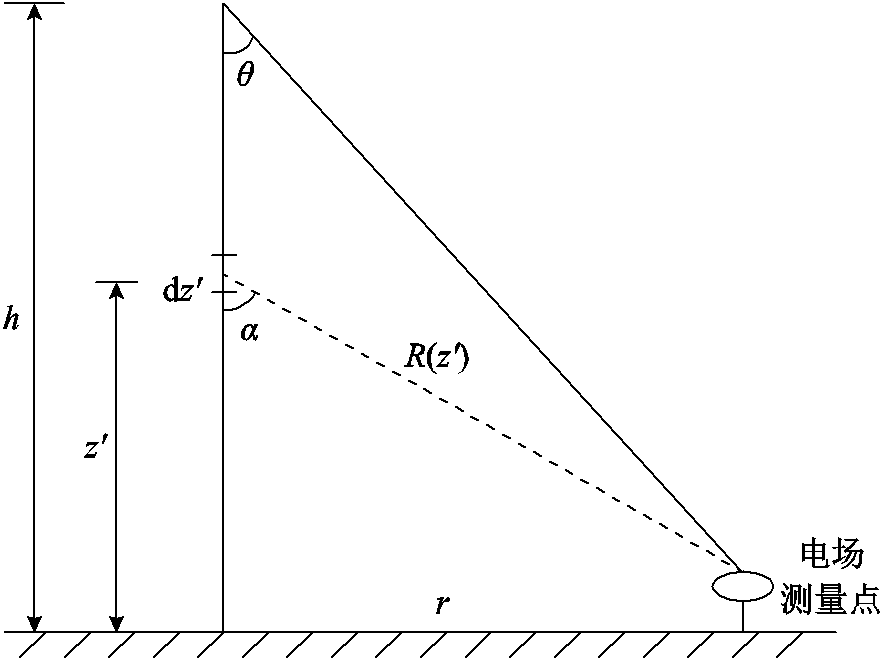
图11 闪电通道电磁场辐射原理示意图
Fig.11 Schematic diagram of electromagnetic field radiation principle of lightning channel
式中,i为电流;t为时间; 为闪电通道的高度;
 为电场测量点距离闪电通道的水平距离;
 为通道
为通道 高度处与电场测量点间的距离;
 为光速;
为光速; 为通道高度处和电场测量点连线与垂直通道之间的夹角;
 为真空介电常数。
从式(1)中可以看出,时域电场可以分为三部分,分别是静电场、感应场与辐射场,随着距离的增加,分别随距离倒数的三次方、二次方和一次方衰减。当观测距离较大时,假设电流分布服从传输线模型,回击速度 恒定,式(1)可以化简为
 (2)
(2)
当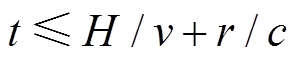 时
时
![]() (3)
(3)
式中,m0为真空磁导率。这也就意味着,较远距离电场强度峰值与电流峰值成正比,可以使用远距离的电场强度峰值估算自然闪电回击的电流峰值[27]。较远距离电场主要由辐射场主导,电场强度峰值与电流峰值成正比,而较近距离时电场由静电场、感应场和辐射场三部分组成,不是单纯的线性关系,所以距离越远拟合的线性度越好。
2019年夏天在广州从化开展了火箭引雷实验,分析了回击电流及不同距离的电场波形参数,研究了传播距离对电场特征参数的影响,以及不同距离电场强度与峰值电流间的关系,主要结论如下:
1)成功引发了14次火箭触发闪电,总回击数达74次,每次闪电的平均回击数为5.3次,单次闪电的最大回击次数为14次。
2)统计分析了回击的电流特征参数。回击间隔时间、峰值电流、10%~90%上升时间、半峰值宽度、1 ms转移电荷和1 ms作用积分的几何平均值分别为38.45 ms、12.38 kA、0.25 μs、8.31 μs、0.68 C和2.12×10³ A2·s。1 ms转移电荷量和1 ms作用积分量均与峰值电流呈幂函数相关性。
3)随着距离增加,电场强度峰值会逐渐衰减,而上升时间与半峰值宽度会随着距离的增加而增大。
4)回击电场强度峰值会随距离的增大而呈现出幂函数减小,且峰值电流与不同距离的先导电场强度峰值和回击电场强度峰值均呈现一定线性相关,距离越大,其线性拟合关系越好。
参考文献
[1] Orville R. The art and science of lightning protection[J]. Bulletin of the American Meteorological Society, 2009, 90(7): 1022.
[2] 王红斌, 程思, 范伟男, 等. 雷暴活动全闪电定位及空间演变过程分析[J]. 电工技术学报, 2021, 36(2): 373-379.Wang Hongbin, Cheng Si, Fan Weinan, et al. Total lightning location of thunderstorm activities and spatial evolution process analysis[J]. Transactions of China Electrotechnical Society, 2021, 36(2): 373-379.
[3] 张文锋, 李志伟, 张国建, 等. 山区35kV架空线路雷击特性仿真分析[J]. 电气技术, 2022, 23(9): 19-28. Zhang Wenfeng, Li Zhiwei, Zhang Guojian, et al. Simulation analysis on lightning strike characteristics of 35kV overhead lines in mountainous area[J]. Electrical Engineering, 2022, 23(9): 19-28.
[4] 周蜜, 丁文汉, 王建国, 等. 闪电连接高度对地面电场波形的影响[J]. 电工技术学报, 2021, 36(4): 857-868. Zhou Mi, Ding Wenhan, Wang Jianguo, et al. Effect of lightning junction height on ground electric field waveform[J]. Transactions of China Electrotechnical Society, 2021, 36(4): 857-868.
[5] 袁涛, 左思家, 司马文霞, 等. 紧凑型多腔室并联间隙雷电冲击闪络路径约束研究[J]. 电工技术学报, 2023, 38(11): 2989-2998. Yuan Tao, Zuo Sijia, Sima Wenxia, et al. Research on lightning flashover path constraints of compact multi-chamber parallel gap[J]. Transactions of China Electrotechnical Society, 2023, 38(11): 2989-2998.
[6] Li Quanxin, Rachidi F, Rubinstein M, et al. Measurement and modeling of both distant and close electric fields of an M-component in rocket-triggered lightning[J]. Journal of Geophysical Research: Atmospheres, 2020, 125(21): e2019JD032300.
[7] Rakov V A, Uman M A. Lightning: physics and effects[M]. Cambridge: Cambridge University Press, 2003.
[8] Hubert P, Laroche P, Eybert-Berard A, et al. Triggered lightning in new Mexico[J]. Journal of Geophysical Research: Atmospheres, 1984, 89(D2): 2511-2521.
[9] Fisher R J, Schnetzer G H, Thottappillil R, et al. Parameters of triggered-lightning flashes in Florida and Alabama[J]. Journal of Geophysical Research: Atmospheres, 1993, 98(D12): 22887-22902.
[10] Le Vine D M, Willett J C, Bailey J C. Comparison of fast electric field changes from subsequent return strokes of natural and triggered lightning[J]. Journal of Geophysical Research: Atmospheres, 1989, 94(D11): 13259-13265.
[11] Schoene J, Uman M A, Rakov V A. Return stroke peak current versus charge transfer in rocket-triggered lightning[J]. Journal of Geophysical Research: Atmospheres, 2010, 115(D12): D12107.
[12] 郄秀书, 杨静, 蒋如斌, 等. 山东人工引发雷电综合观测实验及回击电流特征[J]. 大气科学, 2012, 36(1): 77-88. Qie Xiushu, Yang Jing, Jiang Rubin, et al. Shandong artificially triggering lightning experiment and current characterization of return stroke[J]. Chinese Journal of Atmospheric Sciences, 2012, 36(1): 77-88.
[13] 张义军, 张阳, 郑栋, 等. 2008—2014年广东人工触发闪电电流特征[J]. 高电压技术, 2016, 42(11): 3404-3414. Zhang Yijun, Zhang Yang, Zheng Dong, et al. Current characteristcs of triggered lightnings in Guangdong from 2008 to 2014[J]. High Voltage Engineering, 2016, 42(11): 3404-3414.
[14] Miki M, Rakov V A, Rambo K J, et al. Electric fields near triggered lightning channels measured with Pockels sensors[J]. Journal of Geophysical Research: Atmospheres, 2002, 107(D16): ACL2-1.
[15] Nag A, Mallick S, Rakov V A, et al. Evaluation of U.S. National Lightning Detection Network performance characteristics using rocket-triggered lightning data acquired in 2004–2009[J]. Journal of Geophysical Research: Atmospheres, 2011, 116(D2): D02123.
[16] Schoene J, Uman M A, Rakov V A, et al. Statistical characteristics of the electric and magnetic fields and their time derivatives 15 m and 30 m from triggered lightning[J]. Journal of Geophysical Research: Atmospheres, 2003, 108(D6): 4192.
[17] Mallick S, Rakov V A, Hill J D, et al. Performance characteristics of the NLDN for return strokes and pulses superimposed on steady currents, based on rocket-triggered lightning data acquired in Florida in 2004–2012[J]. Journal of Geophysical Research: Atmospheres, 2014, 119(7): 3825-3856.
[18] Qie Xiushu, Zhao Yang, Zhang Qilin, et al. Characteristics of triggered lightning during Shandong artificial triggering lightning experiment (SHATLE)[J]. Atmospheric Research, 2009, 91(2/3/4): 310-315.
[19] 陈怀飞, 王宇, 孙通, 等. 风机回击电磁场波形特征及辐射增强效应研究[J]. 高电压技术, 2020, 46(6): 2122-2130. Chen Huaifei, Wang Yu, Sun Tong, et al. Study on waveform characteristics and radiation enhancement effect of lightning return stroke initiated from wind turbine[J]. High Voltage Engineering, 2020, 46(6): 2122-2130.
[20] Cai Li, Li Jin, Wang Jianguo, et al. Differences between flashes with and without return strokes in rocket-triggered lightning[J]. Geophysical Research Letters, 2021, 48(11): e2021GL093483.
[21] Zheng Dong, Zhang Yijun, Zhang Yang, et al. Characteristics of the initial stage and return stroke currents of rocket-triggered lightning flashes in Southern China[J]. Journal of Geophysical Research: Atmospheres, 2017, 122(12): 6431-6452.
[22] Schoene J, Uman M A, Rakov V A, et al. Characterization of return-stroke currents in rocket-triggered lightning[J]. Journal of Geophysical Research: Atmospheres, 2009, 114(D3): D03106.
[23] Yang Jing, Qie Xiushu, Zhang Guangshu, et al. Characteristics of channel base currents and close magnetic fields in triggered flashes in SHATLE[J]. Journal of Geophysical Research: Atmospheres, 2010, 115(D23): D23102.
[24] Schoene J, Uman M A, Rakov V A, et al. Test of the transmission line model and the traveling current source model with triggered lightning return strokes at very close range[J]. Journal of Geophysical Research: Atmospheres, 2003, 108(D23): 4737.
[25] 张其林, 刘明远, 杨璟, 等. 近距离地闪电场变化及对通道电荷密度分布的响应[J]. 气象学报, 2012, 70(4): 847-854. Zhang Qilin, Liu Mingyuan, Yang Jing, et al. Characteristics of the close leader/return stroke electric field change and its response to the corresponding charge density along the lightning channel[J]. Acta Meteorologica Sinica, 2012, 70(4): 847-854.
[26] 郄秀书, 张其林, 袁铁. 雷电物理学[M]. 北京: 科学出版社, 2013.
[27] Li Quanxin, Wang Jianguo, Cai Li, et al. On the return-stroke current estimation of Foshan Total Lightning Location System (FTLLS)[J]. Atmospheric Research, 2021, 248: 105194.
Abstract Lightning faults are one of the main causes of tripping of transmission lines. Obtaining real lightning parameters is crucial for lightning protection in power systems. One of the reasonable and effective means is triggered lightning test. Due to differences in climatic conditions and cloud charge distribution, lightning discharge parameters vary somewhat from region to region. There are relatively few relevant experimental studies in China, and there is a need to accumulate more lightning discharge data from different regions. To determine how lightning discharge occur, to provide accurate lightning discharge parameters needed for lightning protection work. To study and test lightning strike mechanisms and to evaluate the performance of lightning location systems.
Rocket-triggered lightning test was conducted in Guangzhou in summer 2019. Lightning-triggered rockets were launched under suitable thunderstorm weather conditions to trigger upward negative polarity lightning. The lightning current flowed through the priming rod through a coaxial shunt with a resistance value of 1 mΩ and then flowed to ground. Thereby obtaining a realistic lightning current waveform. And three flat plate capacitor antennas were set up at 58 m, 90 m and 1600 m from the rocket launcher as the measurements of the vertical electric field of the lightning. Studying the trend of electric field waveform parameters with distance and the relationship between current parameters and electric field parameters.
A total of 14 flashes were successfully triggered, with a total of 74 return strokes, an average of 5.3 return strokes, and a maximum of 14 return strokes for a single flash. Defining six current waveform parameters and plotting the parameter distributions. The geometric mean values of the interval time of return strokes, peak current, 10%~90% rise time, half-peak width, 1 ms transferred charge and 1 ms action integral were 38.45 ms, 12.38 kA, 0.25 μs, 8.31 μs, 0.68 C, and 2.12×10³ A2·s, respectively. The relationship between the current parameters was investigated. Both the 1 ms transferred charge and the 1 ms action integral were correlated with the peak current as a power function. The distributions of five electric field characteristic parameters at different distances, including leader electric field peak, return stroke electric field peak, 10%~90% rise time, half-width time and inverse peak ratio, were counted. By normalizing the peak current to 15 kA, it was found that the leader electric field peak and return stroke electric field peak would decrease with increasing distance, while the 10%~90% rise time and half-peak width of the electric field would increase. The return stroke electric field peak showed a power function decrease with increasing distance. The peak current showed a certain linear correlation with both the leader electric field peak and return stroke electric field peak at different distances. And the larger the distance, the better the linear fit. This was caused by the fact that the electric field at close distances is dominated by electrostatic and radiation fields, and the electric field at far distances is dominated by radiation fields. The current and electric field waveform data reported in this paper provide reliable data support for testing the lightning return stroke model and lightning protection.
keywords:Rocket-triggered lightning, current, electric field, return stroke
DOI:10.19595/j.cnki.1000-6753.tces.221864
中图分类号:TM863
国家自然科学基金资助项目(52177154)。
收稿日期 2022-10-04
改稿日期 2022-10-28
蔡 力 男,1987年生,副教授,博士生导师,研究方向为雷电防护与接地技术,雷电物理与雷电探测。E-mail:cail@whu.edu.cn
王建国 男,1968年生,教授,博士生导师,研究方向为雷电防护与接地技术,高电压测试技术。E-mail:wjg@whu.edu.cn(通信作者)
(编辑 赫 蕾)