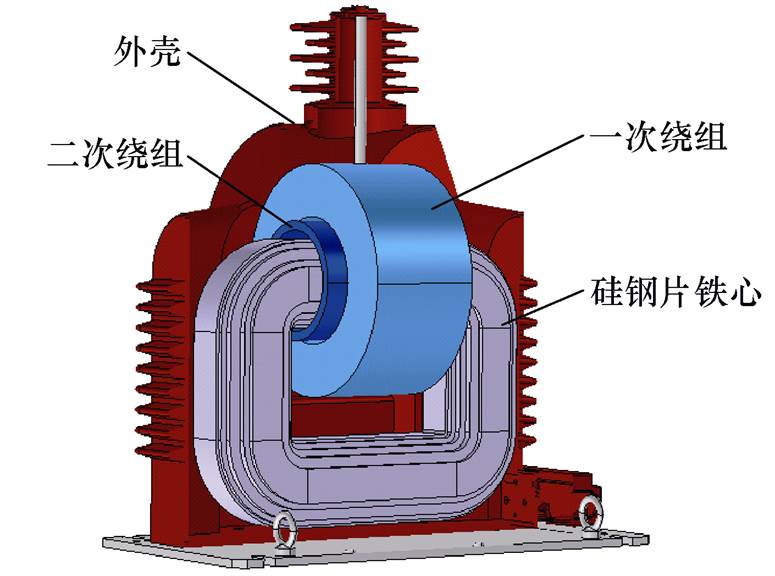
图1 一台35 kV电压等级PT内部构造
Fig.1 The internal structure of a 35 kV PT
摘要 与电力变压器相比,电磁式电压互感器(PT)具有更大的杂散电容,这将使其磁滞曲线的绘制以及宽频仿真模型的构建更加困难,难以进行精确的铁磁谐振仿真。目前,工程上常用频率扫描的方式计算高频高压变压器的分布电容。但是该方法需要数MHz的扫频范围,难以应用于工作在低频下的PT设备。该文提出一种低频窄带的频率扫描方法,通过在PT与变频电源端口之间串联电感的方式,将扫频试验的谐振点降至低频范围内,对杂散电容的数值进行了精确计算。该方法所需的扫描频段窄、扫描频率低,降低了对电源与测量设备的硬件要求,避免了由于高频试验带来的损耗问题。进而,可以分离PT端口电流中的容性电流与励磁电流分量,对磁滞曲线进行精确绘制。最终,可以建立包含铁心磁滞与杂散电容的p 型仿真模型。仿真结果具有较好的频率响应特性,与试验结果的相似系数保持在95 %以上,优于现有的仿真模型。
关键词:电磁式电压互感器 杂散电容 磁滞曲线 频率扫描
电磁式电压互感器(Potential Transformer, PT)被广泛应用于电网的数据采集中,其精确建模对系统的安全运行意义重大。由于PT具有较高的电压比与绕组匝数,杂散电容对其将具有更大的影响,使磁滞曲线的测量更加困难,系统中更容易发生铁磁谐振,感应耐压试验的端口电流抬升,造成安全风险[1]。因此,有必要对其进行准确测量。
文献[2-4]使用数值计算方法计算了变压器设备的杂散电容。该方法解释了变压器设备中杂散电容的产生机理,通过电场能量的计算获取了等效的杂散电容数值,可以帮助工程师改进变压器设计。然而,该方法需要构造复杂的数学模型,且难以保证计算结果的准确度。文献[5-8]使用有限元仿真方法计算变压器设备的杂散电容,并分析了其频率响应特性[9]。该方法降低了建模的难度,使对复杂带电体的电磁计算成为可能。但是,设备的使用者往往难以了解设备的内部参数,这将使得建模更加困难。文献[10-11]使用频率扫描的方法计算了高频变压器的杂散电容,并建立了相应的节点导纳矩阵[12]。该方法需要在数MHz的范围内进行频率扫描,使得试验流程更加繁琐,不适用于工作在低频下的PT设备。同时,仅有部分场所能够提供扫频试验所需的电源与测量设备。
铁心磁滞是PT精确建模所需的关键参数。工程上常常将空载试验的端口电流作为横坐标,端口电压的积分作为纵坐标,绘制磁滞曲线[13]。然而,该方法没有考虑PT的容性电流分量,使得测量结果有较大误差。有研究使用爱波斯坦线圈对硅钢片的磁滞曲线进行精确测量[14-17]。该方法具有很高的精度,但无法应用于完整的PT设备。有研究使用直流偏磁方法测量了PT的深度饱和曲线[18-21],但无法测量非饱和区的励磁特性。目前,国内外尚无一种成熟的方案,可以通过非破坏性的试验方法,对PT的杂散电容与铁心磁滞进行准确测量。
本文提出一种低频窄带的频率扫描方法,通过对PT进行非破坏性的端口试验,精确计算其杂散电容的具体数值。进而,可以分离空载试验中的励磁电流与电容电流,从而获取铁心磁滞数据。建立包含杂散电容与铁心磁滞的p 型仿真电路,并搭建试验平台,对不同电压输入下的PT端口电流的仿真与试验结果进行比较。结果表明,所建立的模型具有较高的仿真精度与良好的频率响应,可以为铁磁谐振相关仿真提供参考。
PT是一种大电压比的变压器,它将待测的高压转换为符合测量仪表量程的低压,从而实现对高压信号的安全测量。以一台35 kV电压等级的PT为例,其内部构造如图1所示,铭牌参数见表1。
图1 一台35 kV电压等级PT内部构造
Fig.1 The internal structure of a 35 kV PT
表1 PT的铭牌参数(部分)
Tab.1 Nameplate of the PT (part)

参 数数值 (型号) 型号JDZXFW-35II 额定电压比(35/0.1/0.1)/kV 额定频率/Hz50 极限输出/(V·A)2×300
PT的杂散电容将对其端口特性产生重要影响。电容的本质是衡量电荷容纳能力的物理量,工程上一般通过计算导体间存储的电场能量,对杂散电容的数值进行计算。在PT运行过程中,电场能量主要储存于各个绕组之中,因此PT的杂散电容主要由绕组的杂散电容所决定[12]。由于PT一次绕组匝数较多,绕线结构较为复杂,其产生的杂散电容值大于其他绕组。假设一次绕组产生的杂散电容为CH,二次绕组产生的杂散电容为CL,归算到高压端的等效电容为C1。由于PT具有较大的电压比(k 1),则有
1),则有
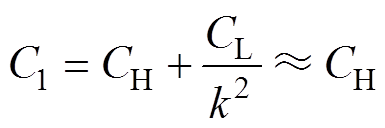 (1)
(1)
由式(1)可得,PT的杂散电容可以近似等效为由一次绕组产生的杂散电容[22]。可以建立PT的单电容模型,如图2所示。
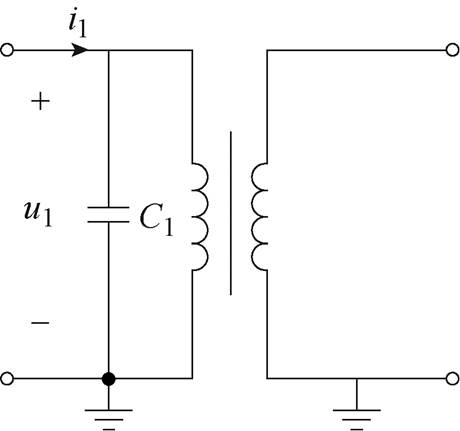
图2 PT的单电容模型
Fig.2 The single-capacitor model of the PT
本例中的PT设备具有分层绕组结构,一次绕组的几何参数与层间结构如图3所示。
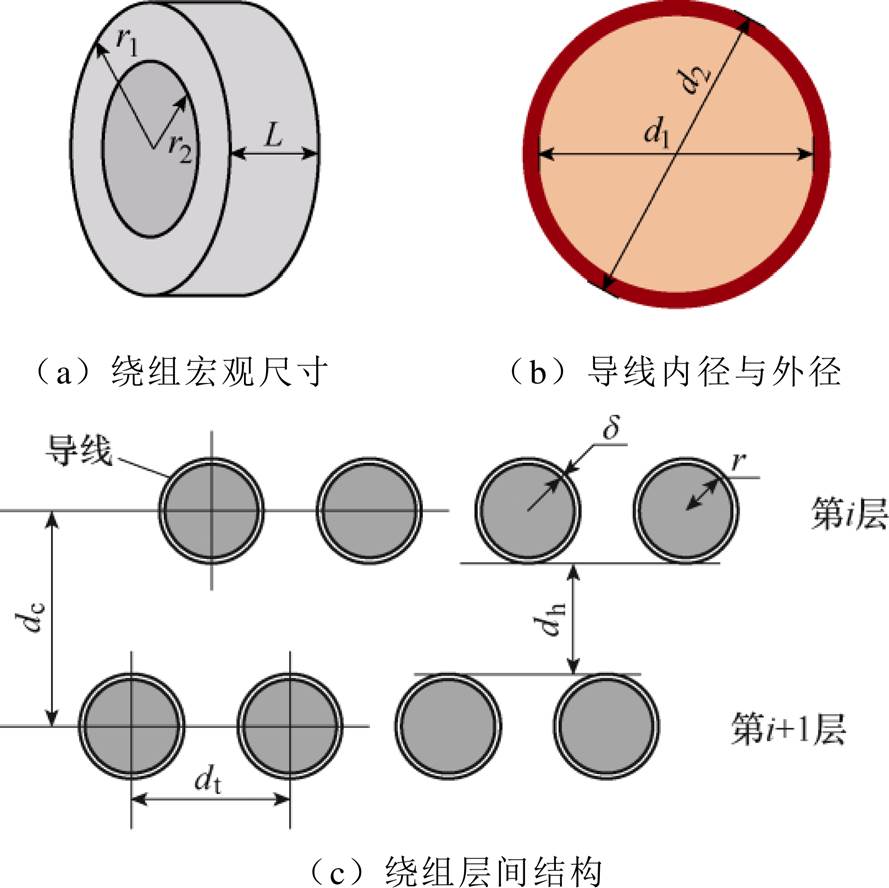
图3 一次绕组的几何参数与层间结构
Fig.3 Geometric parameters and interlayer structure of primary winding
图3a与图3b分别为一次绕组的宏观结构以及导线的尺寸参数。其数值见表2。
表2 一次绕组宏观结构与导线的尺寸参数
Tab.2 The macroscopic structure of the primary winding and the size parameters of the wire
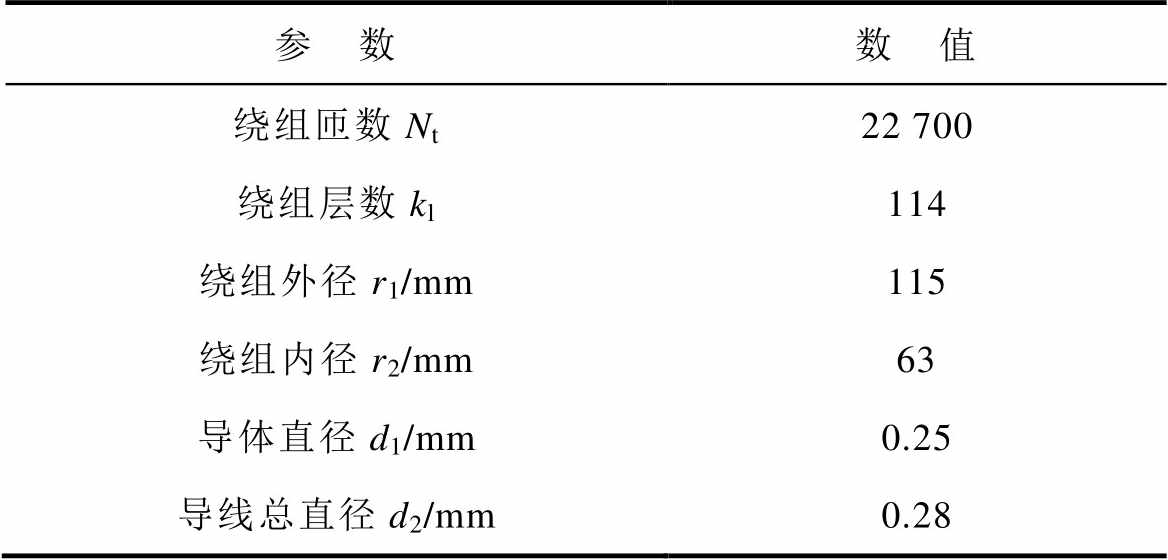
参 数数 值 绕组匝数Nt22 700 绕组层数kl114 绕组外径r1/mm115 绕组内径r2/mm63 导体直径d1/mm0.25 导线总直径d2/mm0.28
图3c为一次绕组的层间尺寸参数。其数值可以通过表2中的数据进行计算,计算结果见表3。
表3 一次绕组层间尺寸参数
Tab.3 Dimensional parameters between primary winding layers(单位: mm)
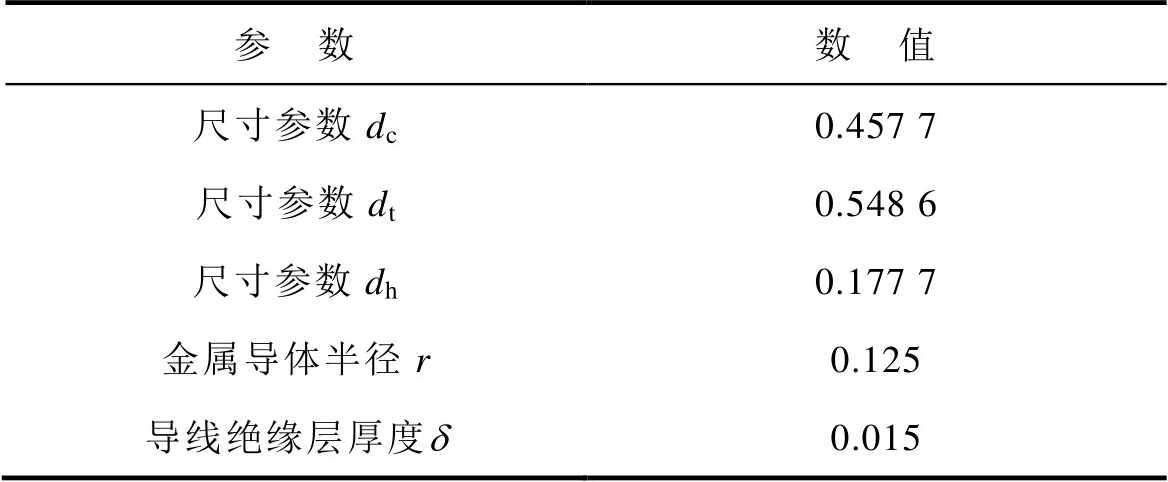
参 数数 值 尺寸参数dc0.457 7 尺寸参数dt0.548 6 尺寸参数dh0.177 7 金属导体半径r0.125 导线绝缘层厚度d0.015
此时,根据文献[23-24],由于PT设备具有层状绕组结构,可以等效为一种平行板电容模型,如图4所示。
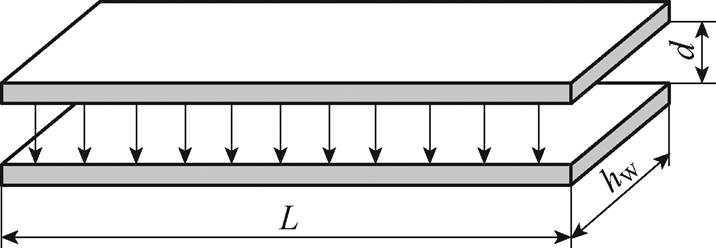
图4 平行板电容模型
Fig.4 Parallel plate capacitance model
图4中,L为线圈的宽度,hw为线圈的平均匝长度,d为两层绕组之间的等效距离。一般采用C型或者Z型方案绕制绕组[25],如图5所示。
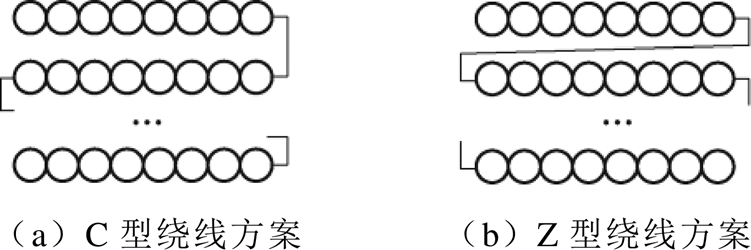
图5 典型绕线方案
Fig.5 Typical winding methods
根据绕线方式的不同,绕组内的电动势分布将有所不同,如图6所示。
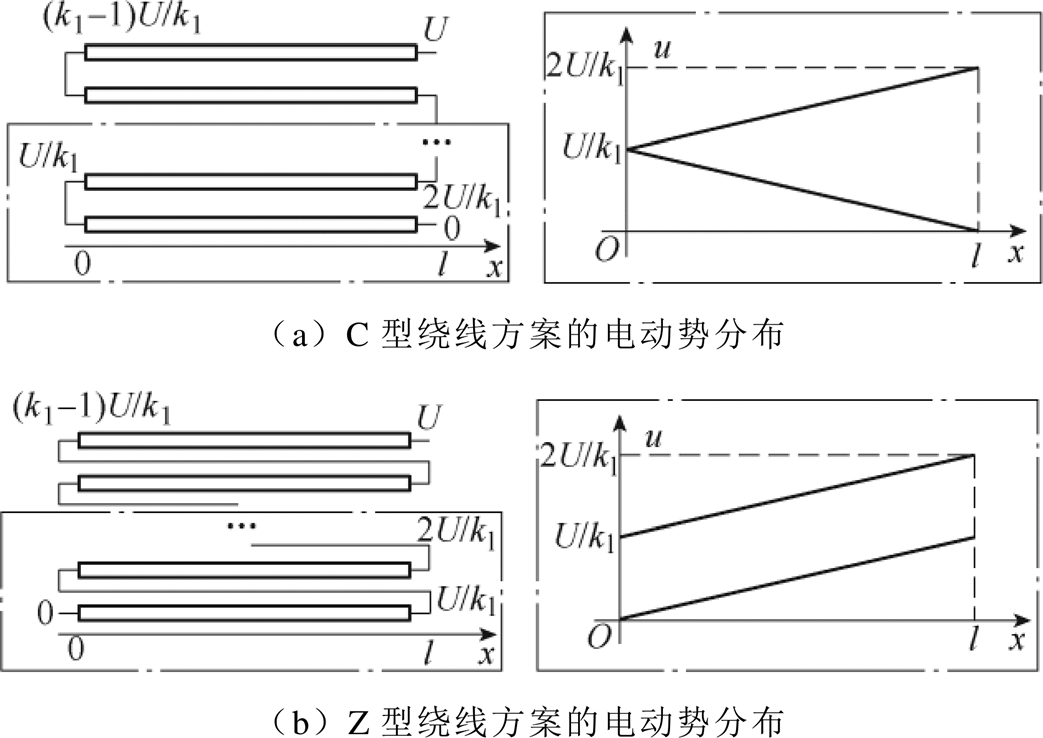
图6 典型绕线方案的电动势分布
Fig.6 Potential distribution of typical winding methods
电动势分布的不同将导致不同的电场分布,进而使得绕组的等效电容不同。两种绕线方式对应的杂散电容计算公式如式(2)所示,文献[24]详细阐述了该公式的推导过程。
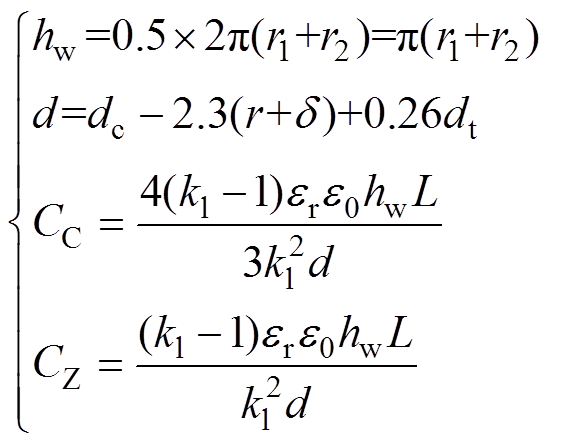 (2)
(2)
式中,CC与CZ分别为C型与Z型绕法产生的分布电容;e0为真空介电常数;er为绕组层间介质的相对介电常数,一般取3~5之间。此时,PT设备的绕组电容的估算值为50~120 pF,无法满足精确建模的需求。
PT设备的T型等效电路如图7所示。
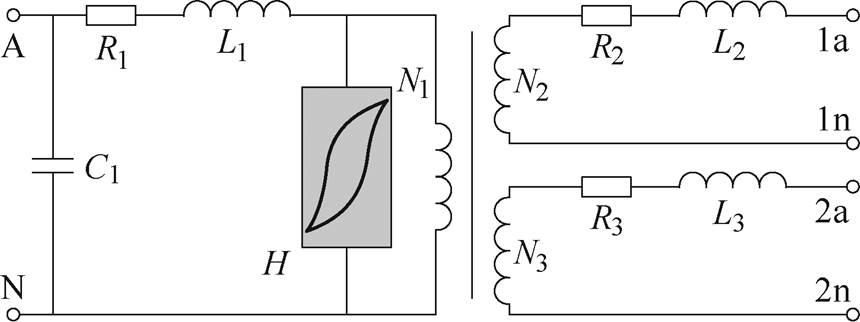
图7 PT设备的T型等效电路
Fig.7 T-type equivalent circuit of PT equipment
图7中,A-N为一次侧端口,对应的电压等级为35 kV;1a-1n与2a-2n分别为两个二次侧端口,对应的电压等级为100 V;C1为PT设备的杂散电容;H为PT铁心的磁滞;Rx与Lx为PT设备各个端口的漏阻抗。由于漏阻抗的数值一般较小,可以暂时将其忽略。将图7所有参数归算到二次侧,如图8所示。
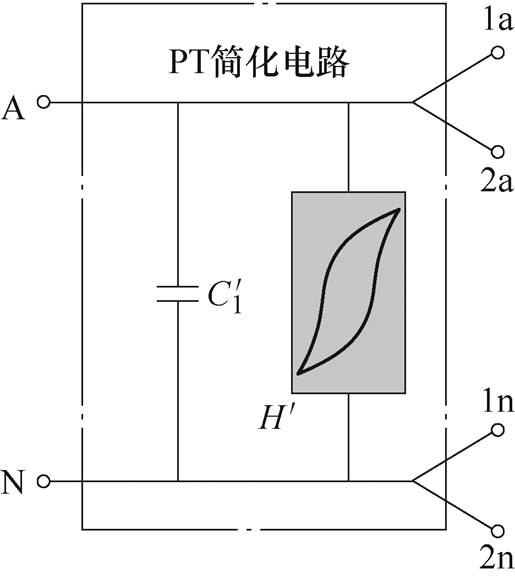
图8 PT简化等效电路(归算到二次侧)
Fig.8 PT simplified equivalent circuit (referred to the secondary side)
图8中, 为归算到二次侧的PT杂散电容;
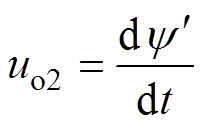
 为归算到二次侧的PT铁心磁滞。通过传统空载试验,提取PT铁心磁滞参数。记录端口电压uo2与端口电流io2的波形。根据式(3),可以计算出流过铁心的磁通,记为
 。以io2为横坐标,为纵坐标,即可绘制出归算到二次侧的磁滞曲线,如图9a所示;可将其归算到一次侧,如图9b所示。
 (3)
(3)
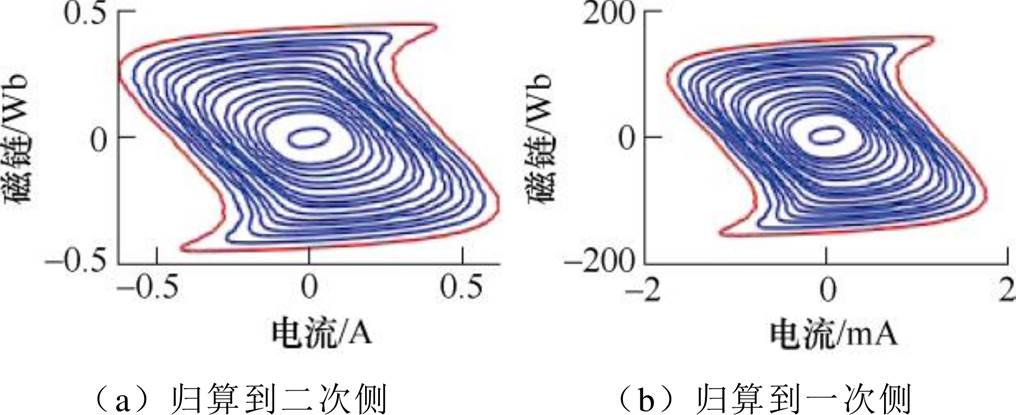
图9 通过空载试验获取的PT磁滞曲线
Fig.9 PT hysteresis loops obtained by no-load tests
图9中绘制的曲线虽然具有迟滞特性,但与实际情况有很大差别。测量结果可以为PT建模提供一定的参考,但无法满足精确建模的需求。产生这种误差的根本原因在于试验中测得的端口电流中除了励磁电流外,还含有容性电流,空载试验中的电压、电流、磁通(归算到二次侧)如图10所示。
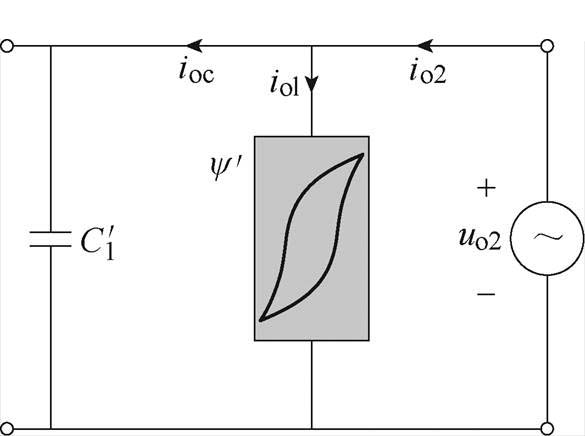
图10 空载试验中的电压、电流、磁通(归算到二次侧)
Fig.10 Voltage, current, and magnetic flux in no-load test (referred to the secondary side)
如图10所示,io2与uo2分别为PT端口电流与电压波形;iol为产生磁通的励磁电流;ioc为PT内部的容性电流分量。显然有
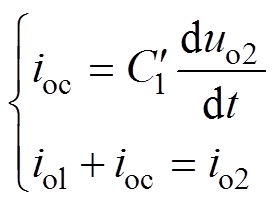 (4)
(4)
由此可见,获取杂散电容的准确数值,即可求取PT设备铁心的磁滞特性曲线,这对互感器的精确建模具有重要的意义。
为了测量互感器杂散电容的具体数值,将一个电感Lex串联至PT的1a-1n端口与变频电源之间,串联电感扫频试验原理如图11所示。
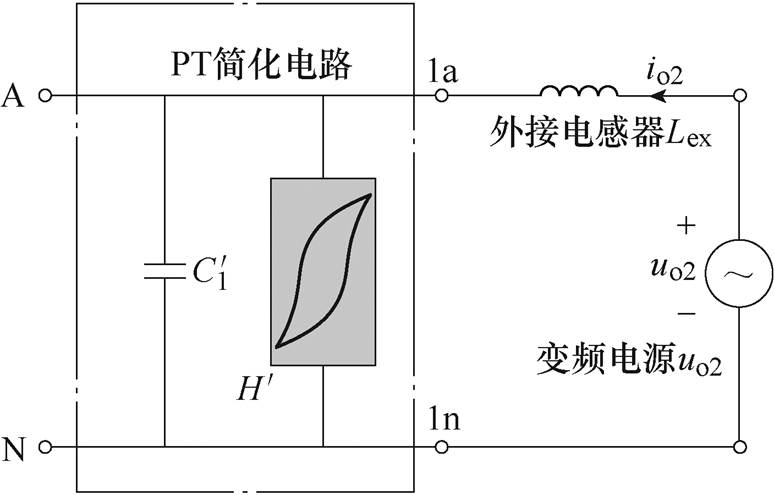
图11 串联电感扫频试验原理
Fig.11 The wiring diagram of frequency sweep test with a series inductance
根据估算结果,PT一次杂散电容C1的取值范围在50~150 pF以内,则归算到二次侧的杂散电容的取值范围为6~18 mF之间。为了保证谐振点的频率在变频电源工作频率30~300 Hz之间,串联电感的取值范围应当处于40~1 500 mH范围内。可以选取较小的串联电感,从而提高谐振频率,保证铁心工作在线性区域。为了避免谐振产生的过电流损坏互感器,将电源电压有效值设定为20 V,是额定电压的20 %。由于外加电压较低,可以认为互感器励磁电感处于线性工作区域,将此时铁心的等效电感记为 。串联扫频试验的等效电路如图12所示,图中,Rex为外接电感器的内阻。
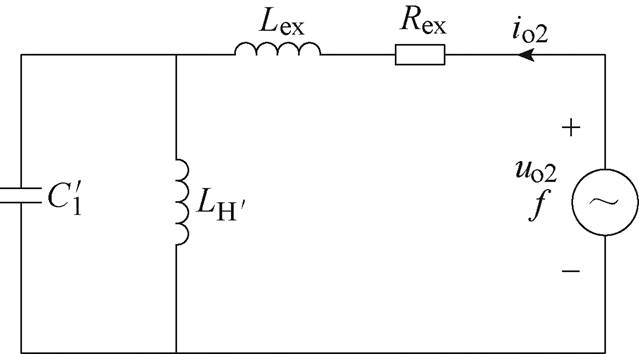
图12 串联电感扫频试验等效电路
Fig.12 The equivalent circuit of frequency sweep test with a series inductance
此时,将端口电压有效值记为Uo2,端口电流有效值记为Io2,电源频率记为f,角频率记为w,电路的等效阻抗记为Zo2。则易得
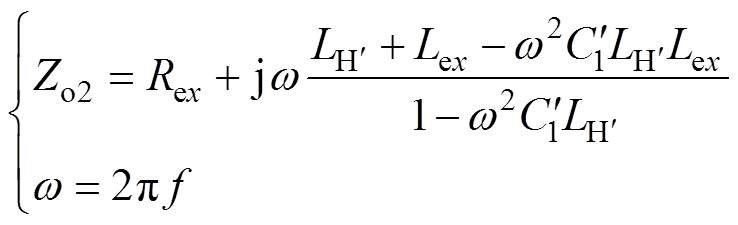 (5)
(5)
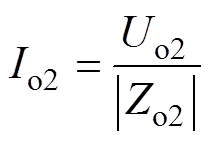 (6)
(6)
假设当频率为f1时,角频率记为w1,端口电流Io2达到最大值,此时等效阻抗Zo2取最小值,即其虚部为0,则有
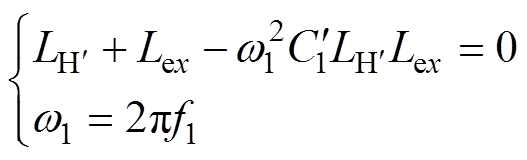 (7)
(7)
式中,Lex、Rex与f1均可直接通过测量获取数据,可视为已知量;与为PT内部参数,无法直接获取,视为未知量。此时,仅由一组方程,无法对多个未知量进行求解。可以通过改变Lex的数值,获取多组线性无关的方程。串联电感扫频试验电路如图13所示。
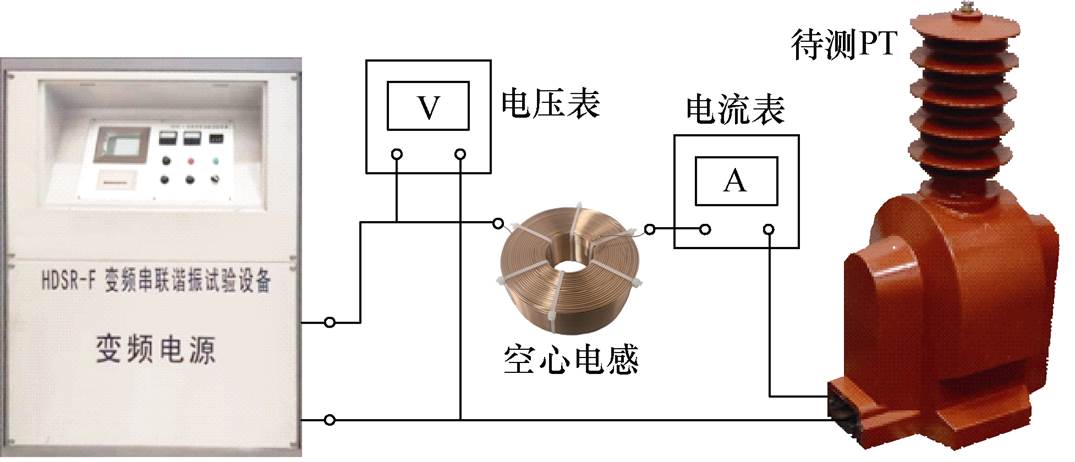
图13 串联电感扫频试验电路
Fig.13 Series inductor frequency sweep test circuit
选取空心电感作为串联电感,该类电感无需考虑铁心的饱和问题,能够获得更精确的测量结果。其电感Lex=113 mH,内阻Rex=8 W。在0~300 Hz范围内进行频率扫描,记录不同频率下的端口电流有效值Io2。在谐振点附近,将扫频的步进量调整为0.1 Hz,以获取更加精确的结果。串联电感扫频试验结果如图14所示。
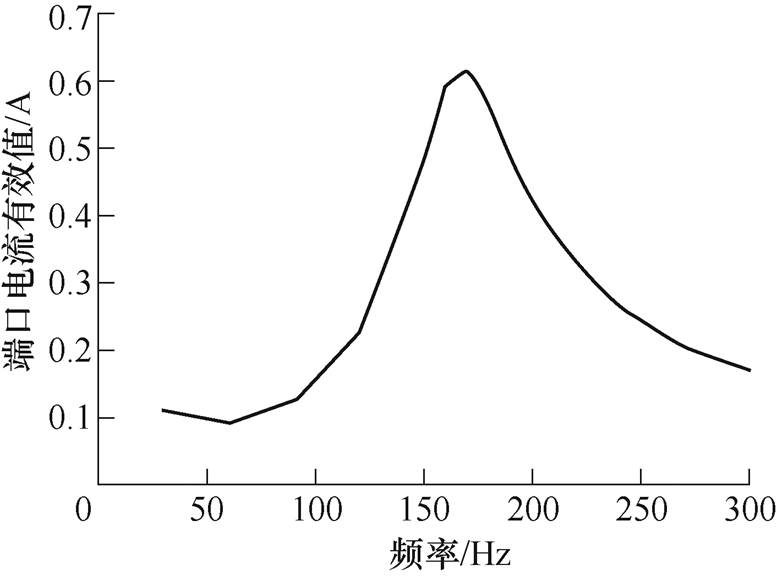
图14 串联电感扫频试验结果
Fig.14 The test results of frequency sweep test with a series inductance
由图14可得,当电源频率为170.0 Hz时,电流有效值达到最高,为619.5 mA。同理,更换电感,可以获得不同的频率点,电感参数与电流最高频率点见表4。
表4 电感参数与电流最高频率点
Tab.4 Series inductance parameters and the highest point of frequency sweep test
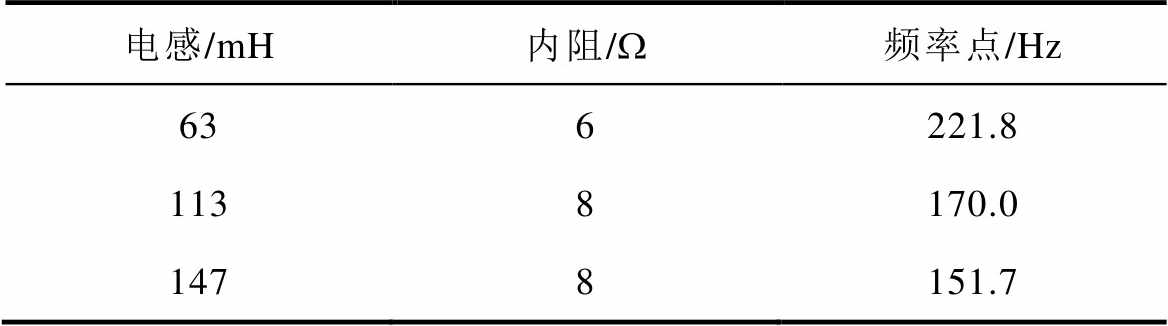
电感/mH内阻/W频率点/Hz 636221.8 1138170.0 1478151.7
将表4中的数据代入式(7)中,对超定方程组进行求解。可以解得=0.855 mH,=8.766mF。则归算到一次侧的杂散电容C1=71.56 pF。此时,根据式(4),即可在空载试验的数据基础上,计算出容性电流分量ioc以及励磁电流分量iol。以iol为横坐标,为纵坐标,即可绘制出归算到二次侧的PT磁滞曲线,如图15a所示;可将其归算到PT一次侧,如图15b所示。
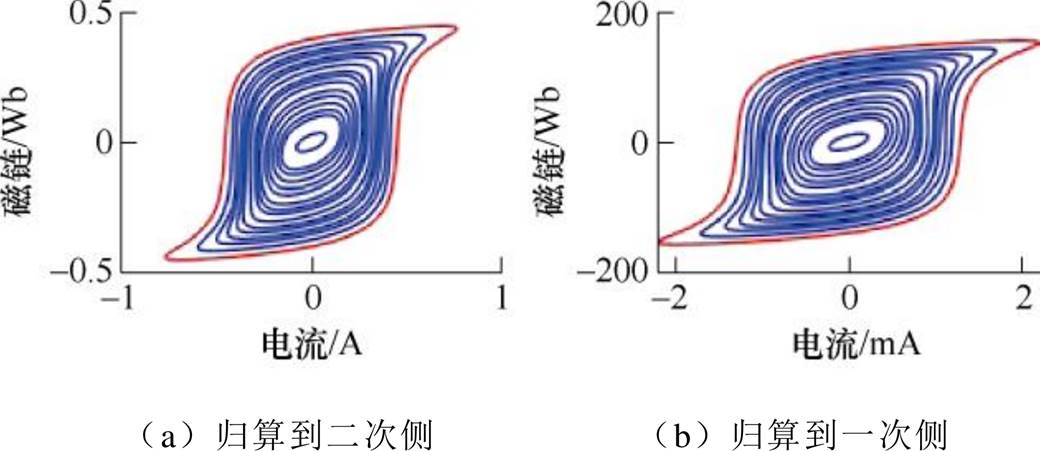
图15 分离杂散电容后的磁滞特性曲线
Fig.15 Hysteresis loops obtained after separating the stray capacitance
建立PT的p 型等效电路,如图16所示。
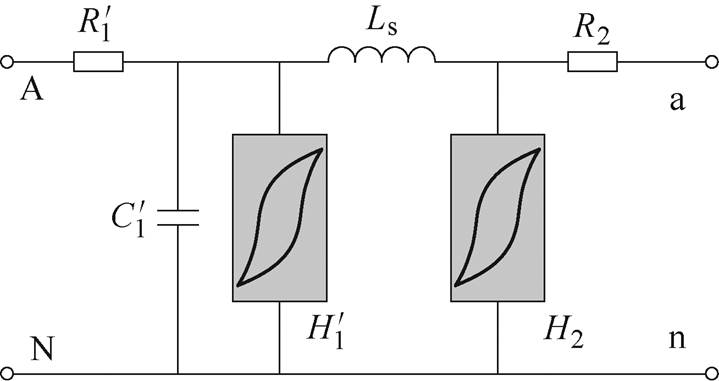
图16 PT的p 型模型(归算到二次侧)
Fig.16 The type p model of PT (referred to the secondary side)
如图16所示, 与R2分别为一次绕组与二次绕组的内阻。
 与H2分别为与一次绕组与二次绕组交链的磁通。Ls为PT产生的漏磁通。为互感器的杂散电容。图16中所有参数均被归算到二次侧。通过直流电阻测量仪测量PT的直流电阻,可得一次侧直流电阻Rdc1=5.16 kW,二次侧直流电阻Rdc2= 0.146 W,归算到二次侧的一次侧直流电阻
 = 0.044 W。进行短路试验,可以测得PT的短路电阻Rs=0.209 W,短路电感Ls=0.382 mH。可以根据一、二次侧的直流电阻,对绕组电阻进行分配[26],有
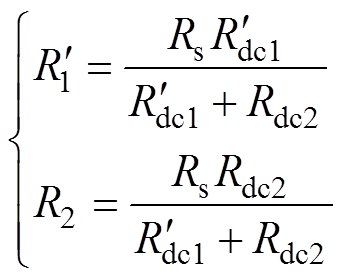 (8)
(8)
假设的励磁电流为 ,对应的磁链为
 ;H2的励磁电流为
 ,对应的磁链为
 [27],则有
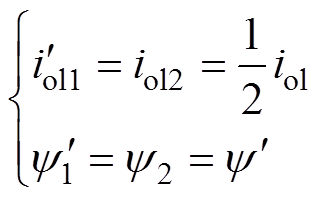 (9)
(9)
可以根据式(9)绘制与H2的磁滞曲线。此时,可以获取图16中所需的全部模型参数,见表5。
表5 p型等效电路参数
Tab.5 Parameters of the type p model
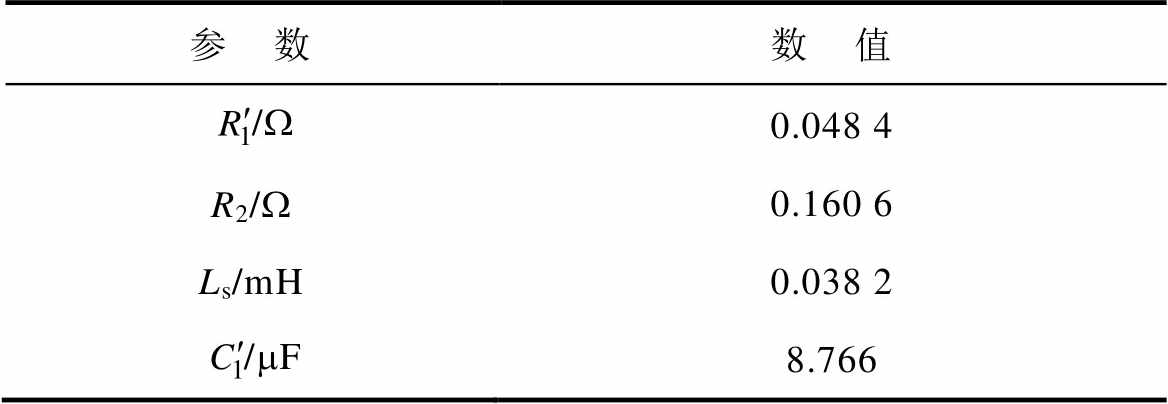
参 数数 值 /W0.048 4 R2/W0.160 6 Ls/mH0.038 2 /mF8.766
根据计算获取的杂散电容与铁心磁滞参数,在Simulink中搭建相应的仿真模型(PCH模型),如图17所示。
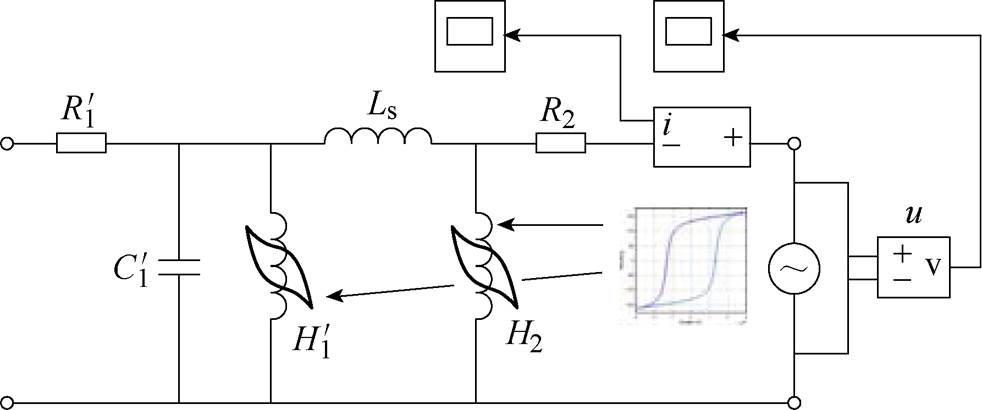
图17 PCH模型的仿真电路
Fig.17 The simulation circuit of PCH model
图17中,PT的一次侧端口开路,二次侧端口与变频电源相连。通过电表记录二次侧端口的电压与电流波形。搭建对应的试验电路,如图18所示。将变频电源的输出端与PT二次侧端口连接;使用示波器记录PT端口电压波形与电流波形。在试验中,变频电源将输出具有不同频率与有效值的标准正弦电压波形。
同时,分别搭建仅考虑铁心磁滞的仿真模型(PH模型),以及使用非线性电感表征铁心饱和的仿真模型(PRL模型),并将仿真与试验结果进行比较,以验证模型的可靠性。两种模型的等效电路如图19所示。
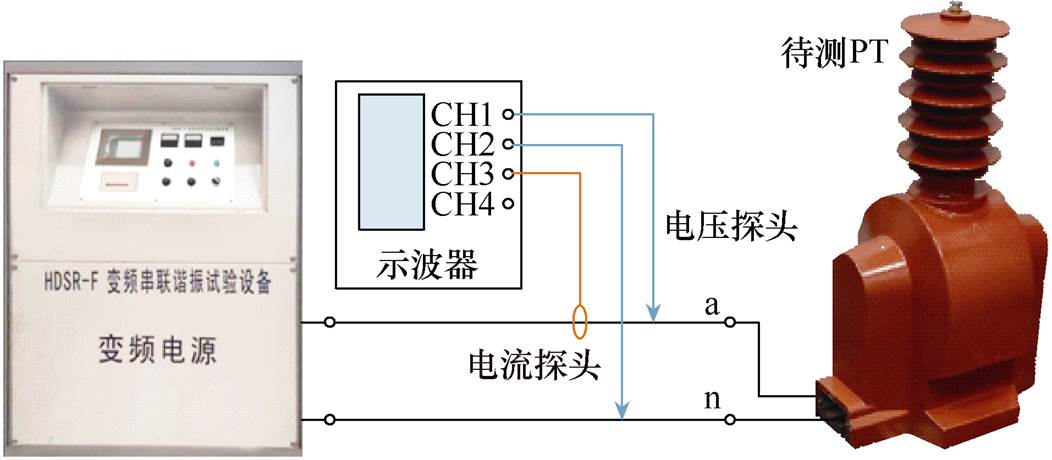
图18 用于验证仿真模型的试验电路
Fig.18 Test circuit used to verify the simulation model
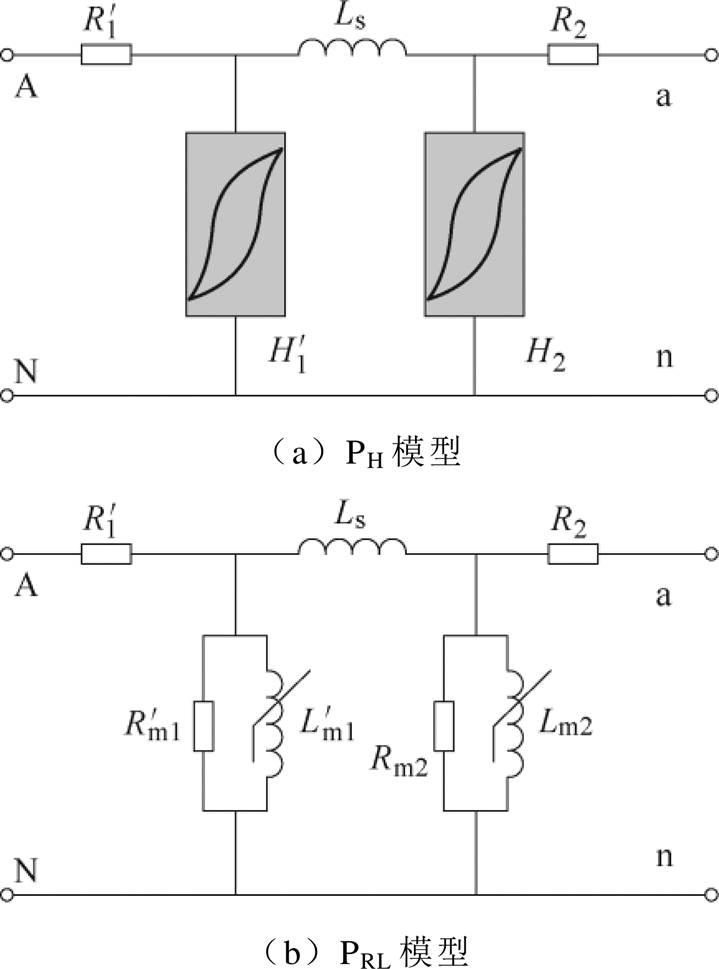
图19 PH与PRL模型的等效电路
Fig.19 The equivalent circuit of PH and PRL model
如图19所示,PH模型采用磁滞曲线表征铁心的饱和特性,且未考虑杂散电容对PT端口特性带来的影响。通常使用爱波斯坦线圈测量铁心的磁滞特性,以获取更精确的仿真结果[28]。PRL模型则使用非线性阻抗替代PH模型中的磁滞模块,使得建模过程更加简易。通常使用逐点递推法计算PRL模型的非线性电感[29]。搭建两种模型对应的仿真电路,如图20所示。
改变变频电源输出电压的频率与有效值,并记录端口电流波形的变化。将不同模型的仿真结果与试验获取的端口电流进行对比,如图21~图26所示。
如图23所示,仅有当电压有效值较小时,PRL模型的仿真结果较为准确。如图21所示,在频率较低时,PH模型的仿真结果较为准确;当频率升高,PH模型的仿真结论便有较大的误差。这是由于PH模型没有考虑到杂散电容的频率响应。而PCH模型的仿真与试验结果在不同电压频率与有效值下均有较高的吻合度。值得注意的是,某些情况下,PT端口电流将会在顶点附近出现明显的凹陷(见图21、图22和图25)。这是由于容性电流与励磁电流共同作用的结果,而仅有PCH模型可以还原这一现象,进一步验证了该模型的可靠性。
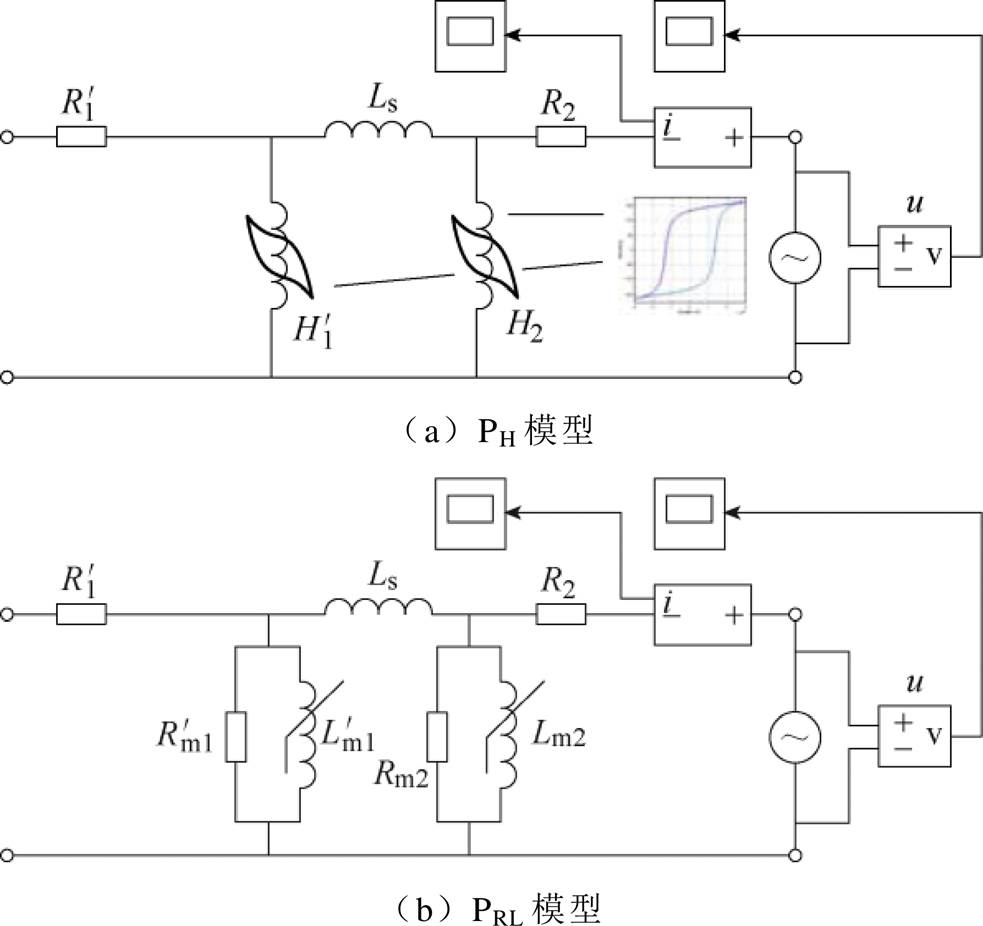
图20 PH与PRL模型的仿真电路
Fig.20 The simulation circuits of PH and PRL models
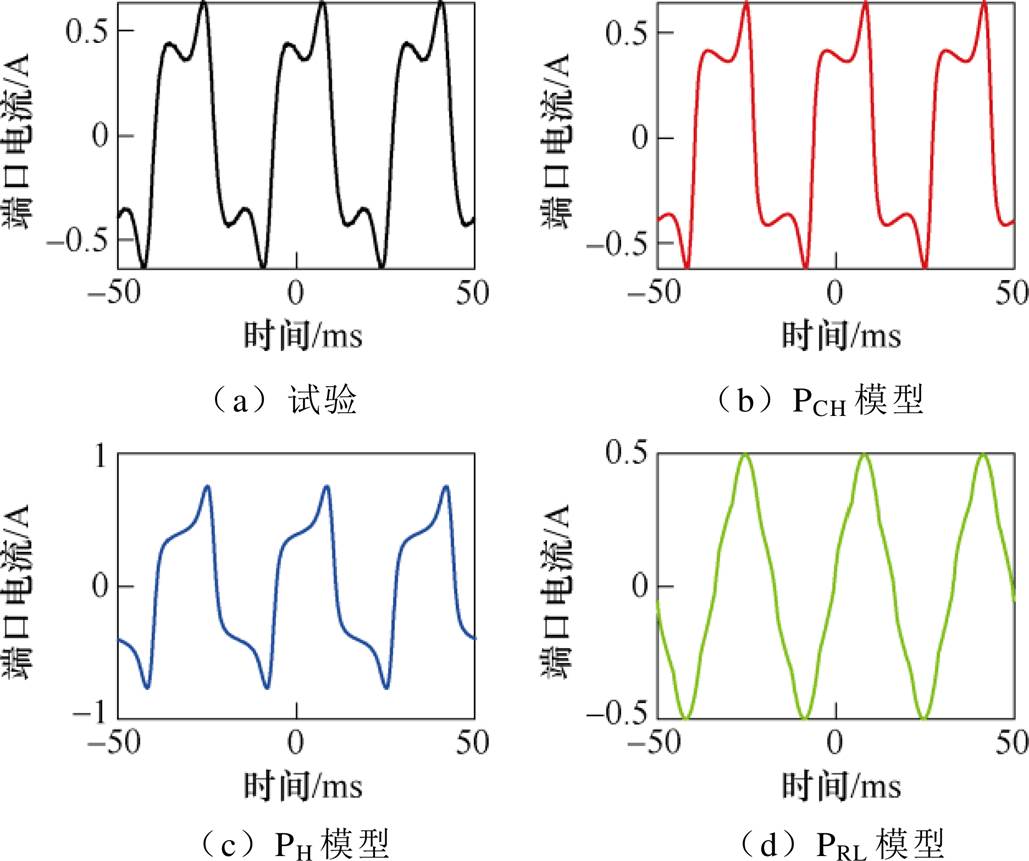
图21 仿真与试验波形对比(30 Hz, 60 V)
Fig.21 Comparison of waveforms (30 Hz, 60 V)
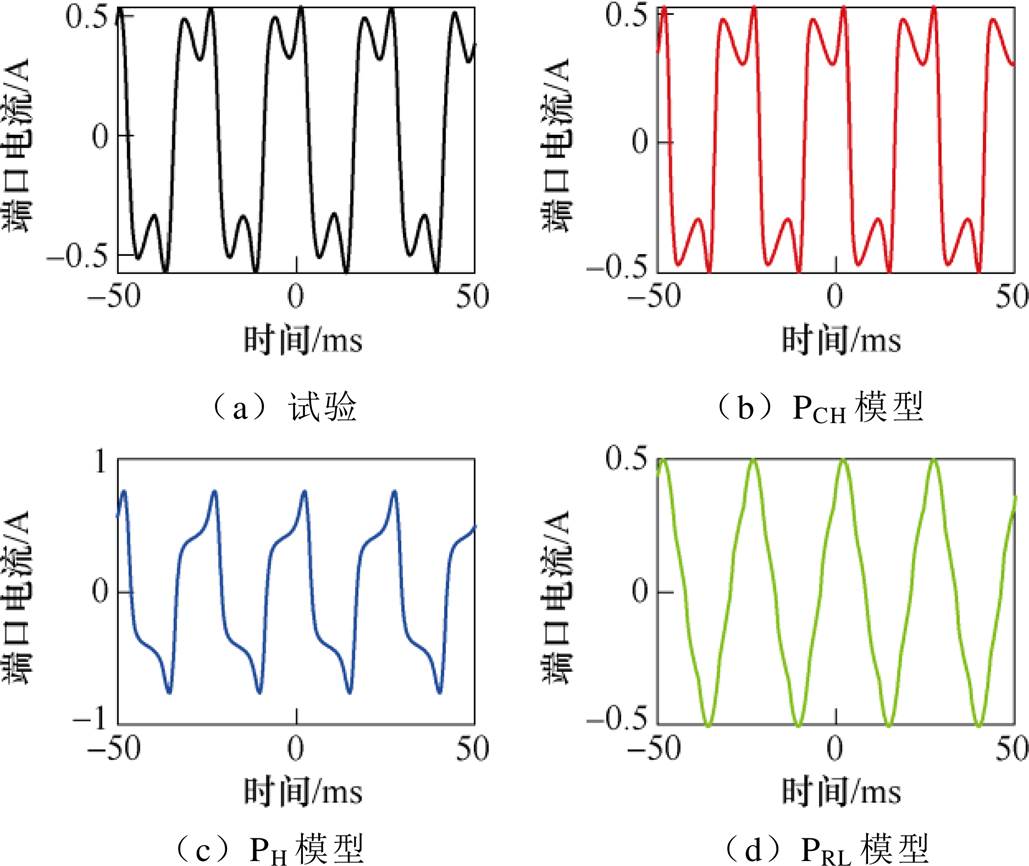
图22 仿真与试验波形对比(40 Hz, 80 V)
Fig.22 Comparison of waveforms (40 Hz, 80 V)
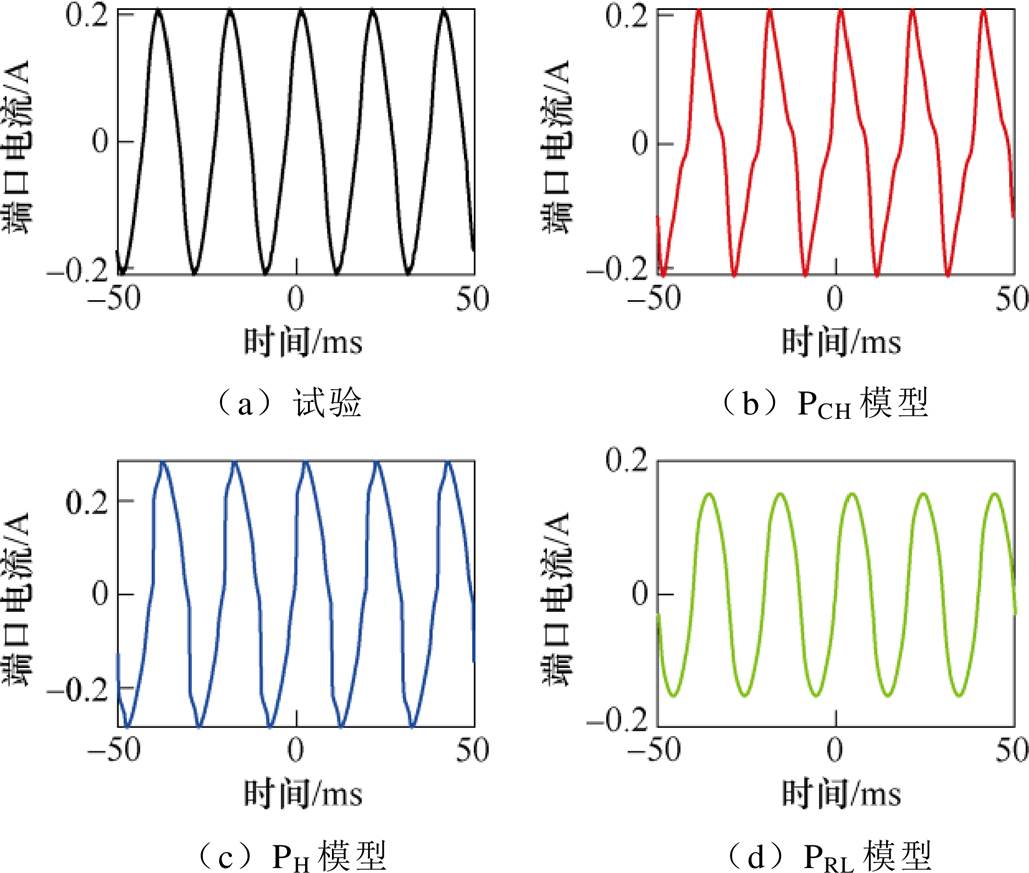
图23 仿真与试验波形对比(50 Hz, 30 V)
Fig.23 Comparison of waveforms (50 Hz, 30 V)
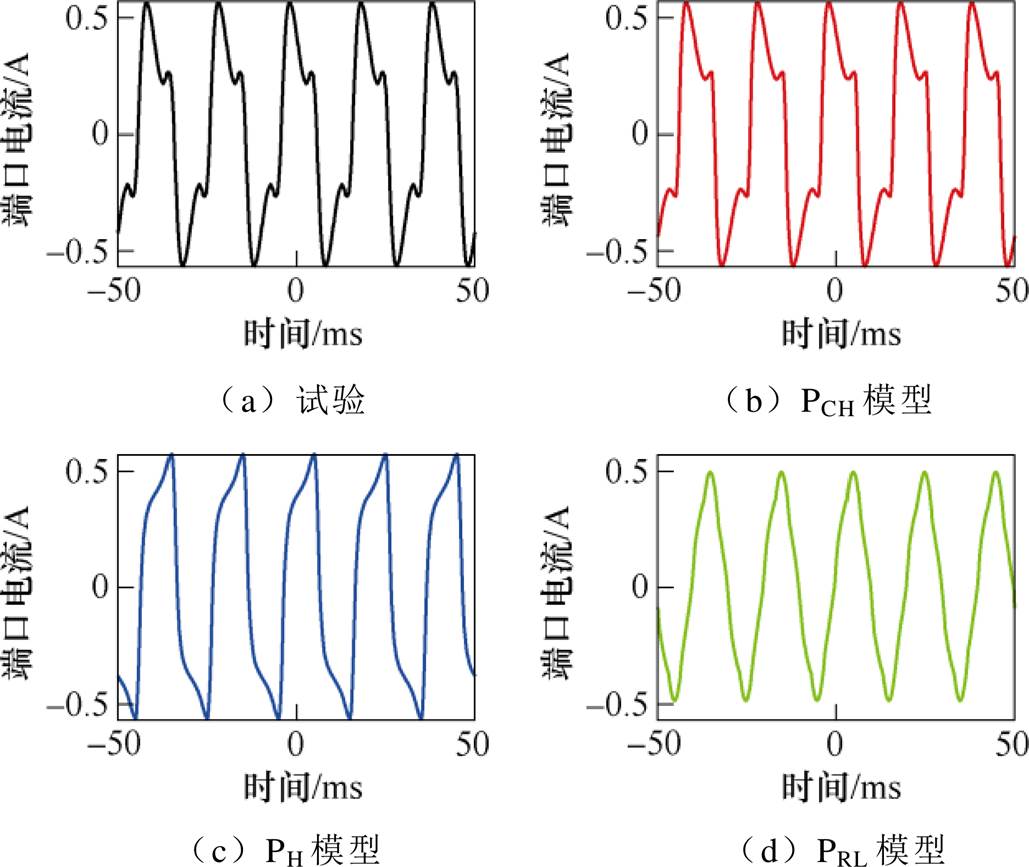
图24 仿真与试验波形对比(50 Hz, 90 V)
Fig.24 Comparison of waveforms (50 Hz, 90 V)
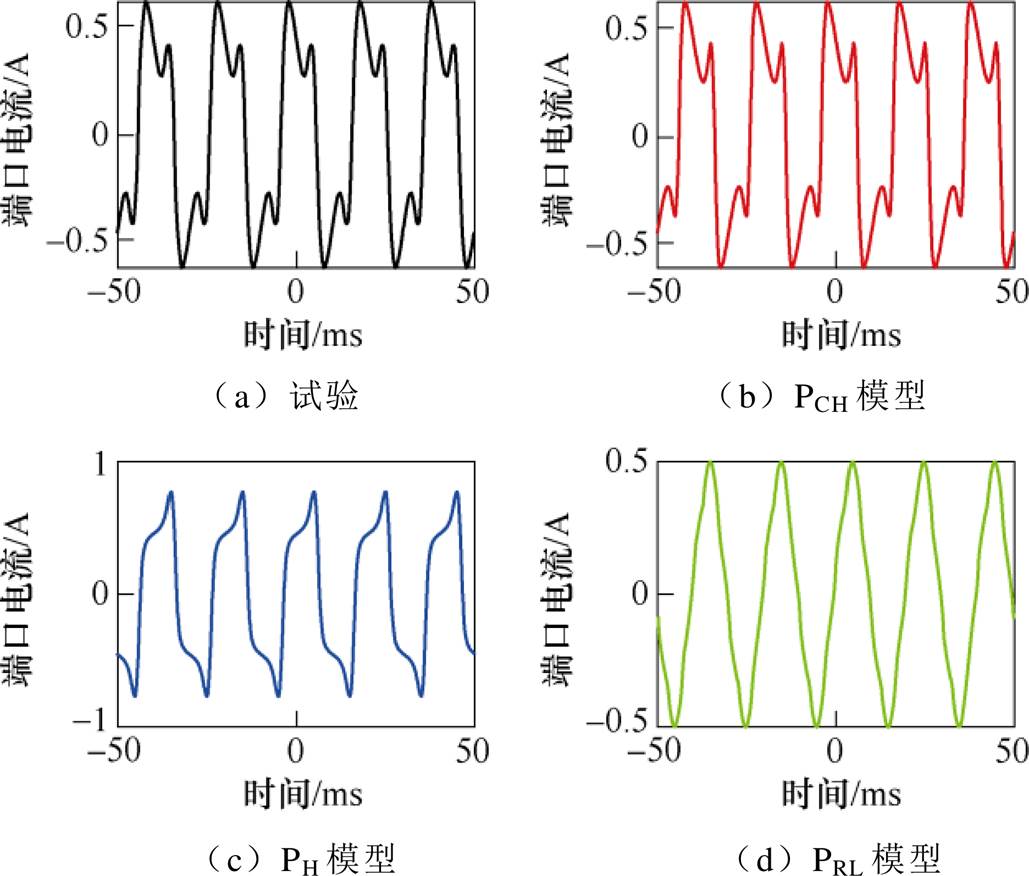
图25 仿真与试验波形对比(50 Hz, 100 V)
Fig.25 Comparison of waveforms (50 Hz, 100 V)
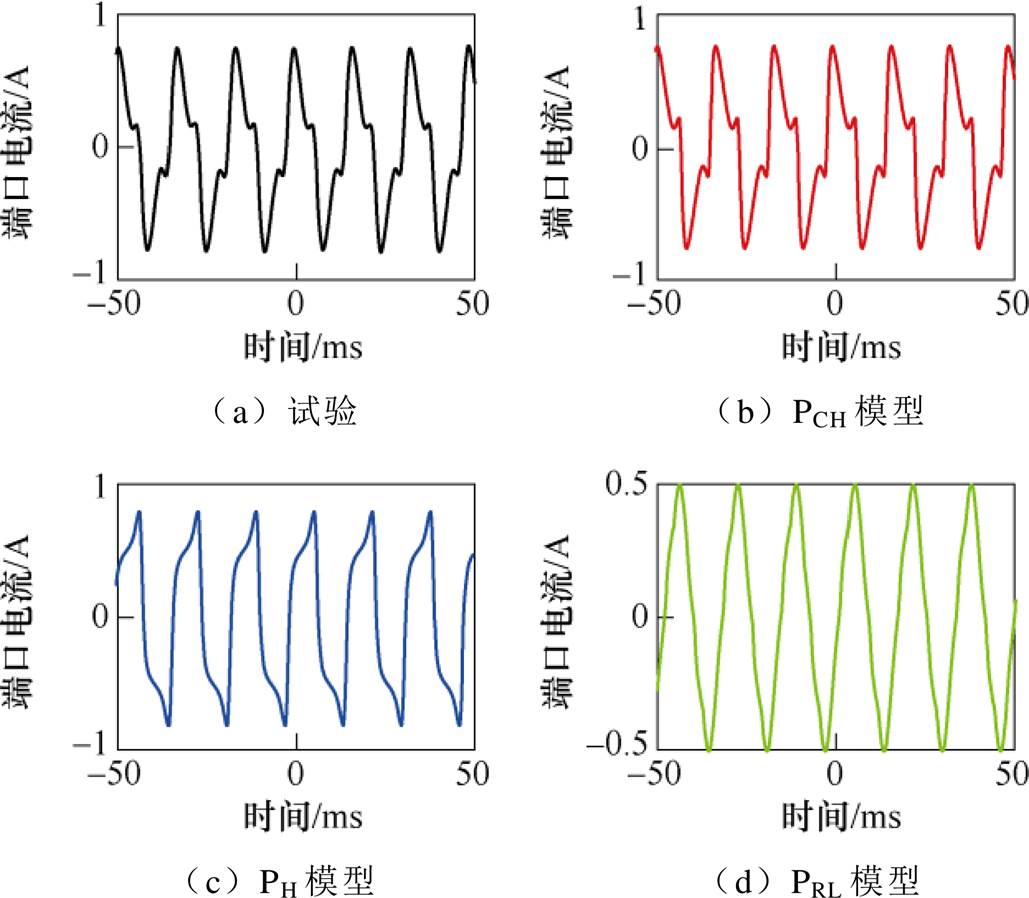
图26 仿真与试验波形对比(60 Hz, 120 V)
Fig.26 Comparison of waveforms (60 Hz, 120 V)
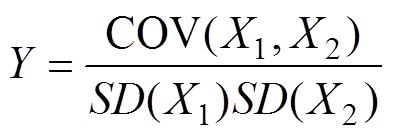
引入皮尔森相关系数[30-32],对模型的可靠性进行定量评估。假设X1、X2为待比较的两组数据,Y为这两组数据的相关系数,则有
 (10)
(10)
式中, 为两组数据的协方差;
 为一组数据的标准差。Y的变化范围在-1~1之间。当Y=-1时,表示两组数据完全负相关;当Y=0时,表示两组数据完全无关;当Y=1时,表示两组数据完全正相关。计算图23中仿真与试验波形的相似度,计算结果记录于表6中。
表6 仿真与试验结果的相似度
Tab.6 Similarity between the simulation and test results(%)

模型组别 123456 PCH95.896.395.396.295.495.7 PH92.582.890.188.684.266.6 PRL62.247.284.550.328.70.8
如表6所示,传统的PRL模型具有较低的仿真精度;考虑铁心磁滞的PH模型在频率较低时具有较高的仿真精度,而在频率升高时将会产生较大的误差;而本文构建的PCH模型具有良好的频率响应特性,不同频率下的仿真与试验结果的相关系数均保持在95 %以上。
基于工程上难以测量PT杂散电容与磁滞曲线的问题,本文通过串联电感的方式,降低了扫频试验的谐振频率点,对杂散电容进行计算。进而可以排除PT端口电流中的容性分量,实现对铁心磁滞曲线的准确绘制。结合短路试验与直流电阻测量结果,构建PT的p 型等效电路。仿真结果具有良好的频率响应特性,与试验结果的相关系数保持在95 %以上,优于现有其他仿真模型。该模型可以应用于电力系统铁磁谐振仿真中,获取更加精确的仿真结果,为消谐振方案的设计提供参考。
参考文献
[1] 朱学成. 220kV GIS电磁式电压互感器现场变频感应耐压试验[J]. 黑龙江科技信息, 2016(8): 115.
Zhu Xuecheng. Field frequency conversion induction withstand voltage test of 220kV GIS electromagnetic voltage transformer[J]. Heilongjiang Science and Technology Information, 2016(8): 115.
[2] Dalessandro L, da Silveira C F, Kolar J W. Self- capacitance of high-voltage transformers[J]. IEEE Transactions on Power Electronics, 2007, 22(5): 2081-2092.
[3] de Grève Z, Deblecker O, Lobry J. Numerical modeling of capacitive effects in HF multiwinding transformers—part I: a rigorous formalism based on the electrostatic equations[J]. IEEE Transactions on Magnetics, 2013, 49(5): 2017-2020.
[4] de Grève Z, Deblecker O, Lobry J. Numerical modeling of capacitive effects in HF multiwinding transformers—part II: identification using the finite- element method[J]. IEEE Transactions on Magnetics, 2013, 49(5): 2021-2024.
[5] Liu Xiaojing, Wang Youhua, Zhu Jianguo, et al. Calculation of capacitance in high-frequency trans- former windings[J]. IEEE Transactions on Magnetics, 2016, 52(7): 1-4.
[6] Liu Chen, Qi Lei, Cui Xiang, et al. Wideband mechanism model and parameter extracting for high- power high-voltage high-frequency transformers[J]. IEEE Transactions on Power Electronics, 2016, 31(5): 3444-3455.
[7] 宋晓婷. 高频高压变压器分布参数测量和绕组结构设计[D]. 大连: 大连理工大学, 2013.
[8] 赵翠. 换流变压器阀侧线端杂散电容的计算[D]. 北京: 华北电力大学, 2015.
[9] Eslamian M. Combined analytical and FEM methods for parameters calculation of detailed model for dry- type transformer[J]. Simulation Modelling Practice and Theory, 2010, 18(3): 390-403.
[10] Blache F, Keradec J P, Cogitore B. Stray capacitances of two winding transformers: equivalent circuit, measurements, calculation and lowering[C]//Pro- ceedings of 1994 IEEE Industry Applications Society Annual Meeting, Denver, CO, USA, 2002: 1211-1217.
[11] Cogitore B, Keradec J P, Barbaroux J. The two- winding transformer: an experimental method to obtain a wide frequency range equivalent circuit[J]. IEEE Transactions on Instrumentation and Measure- ment, 1994, 43(2): 364-371.
[12] 刘晨, 齐磊, 崔翔, 等. 高压高频变压器寄生电容实验提取方法[J]. 华北电力大学学报(自然科学版), 2017, 44(1): 1-8.
Liu Chen, Qi Lei, Cui Xiang, et al. An experimental method for extracting parasitic capacitances of high- voltage high-frequency transformers[J]. Journal of North China Electric Power University (Natural Science Edition), 2017, 44(1): 1-8.
[13] Zhou Yuan, Yang Cuiru, Sima Wenxia, et al. A model considering deep saturation of the iron core for 10kV potential transformers[C]//2018 IEEE International Conference on High Voltage Engineering and Appli- cation (ICHVE), Athens, Greece, 2019: 1-4.
[14] Wang Yang, Liu Zhizhen. Establishment of core dynamic hysteresis model under DC flux[C]//2015 IEEE International Conference on Applied Super- conductivity and Electromagnetic Devices (ASEMD), Shanghai, China, 2016: 334-335.
[15] Almeida A A, Perassa L S, Rodrigues D L, et al. Excess loss localization on the hysteresis curve[J]. IEEE Transactions on Magnetics, 2014, 50(4): 1-4.
[16] Németh Z. Analysis of Epstein frame by finite element method[J]. Przegląd Elektrotechniczny, 2019, 1(6): 25-28.
[17] 杨北超, 范学鑫, 王瑞田, 等. 考虑铁心非线性的三相立体卷铁心变压器建模及空载特性分析[J]. 电工技术学报, 2022, 37(9): 2263-2274.
Yang Beichao, Fan Xuexin, Wang Ruitian, et al. Modeling and no-load characteristics analysis of 3D wound core transformer considering core nonlinear- rity[J]. Transactions of China Electrotechnical Society, 2022, 37(9): 2263-2274.
[18] 刘永来. 考虑铁心渐变饱和特性的单相双绕组变压器模型研究[D]. 重庆: 重庆大学, 2019.
[19] 司马文霞, 刘永来, 杨鸣, 等. 考虑铁心深度饱和的单相双绕组变压器改进p模型[J]. 中国电机工程学报, 2018, 38(24): 7131-7140, 7439.
Sima Wenxia, Liu Yonglai, Yang Ming, et al. An improved p model for single-phase two winding transformers considering deep saturation of the iron core[J]. Proceedings of the CSEE, 2018, 38(24): 7131-7140, 7439.
[20] Sima Wenxia. Low-frequency model for single-phase transformers based on the three-component Preisach model considering deep saturation[J]. International Journal of Electrical Power & Energy Systems, 2019, 110: 107-117.
[21] 杨鸣, 熊钊, 司马文霞, 等. 电磁式电压互感器“低频过电压激励-响应”逆问题求解[J]. 电工技术学报, 2021, 36(17): 3605-3613.
Yang Ming, Xiong Zhao, Sima Wenxia, et al. Solution of the inverse problem of “low-frequency overvoltage excitation to response” for electromagnetic potential transformers[J]. Transactions of China Electro- technical Society, 2021, 36(17): 3605-3613.
[22] Shen Zeliang, Wang Jingang, Yan Xiaojun, et al. A method for extracting stray capacitance and hysteresis curves of potential transformers based on frequency referring[J]. IEEE Transactions on Power Delivery, 2022, 37(3): 1897-1905.
[23] Biela J, Kolar J W. Using transformer parasitics for resonant converters—a review of the calculation of the stray capacitance of transformers[J]. IEEE Transa- ctions on Industry Applications, 2008, 44(1): 223- 233.
[24] 庞天宇. 分布电容对高频变压器特性影响的研究[D]. 天津: 河北工业大学, 2017.
[25] 孟涛, 安彦桦, 贲洪奇. 输入串联型变换器集成变压器的分布电容影响机制与绕组布局方法[J]. 电工技术学报, 2021, 36(24): 5272-5282.
Meng Tao, An Yanhua, Ben Hongqi. Stray capa- citances influences and windings layout of the integrated-transformer in the input-series converter[J]. Transactions of China Electrotechnical Society, 2021, 36(24): 5272-5282.
[26] 司马文霞, 刘永来, 杨鸣, 等. 考虑铁心深度饱和的单相双绕组变压器改进p模型[J]. 中国电机工程学报, 2018, 38(24): 7131-7140, 7439.
Sima Wenxia, Liu Yonglai, Yang Ming, et al. An improved p model for single-phase two winding transformers considering deep saturation of the iron core[J]. Proceedings of the CSEE, 2018, 38(24): 7131-7140, 7439.
[27] 刘永来. 考虑铁心渐变饱和特性的单相双绕组变压器模型研究[D]. 重庆: 重庆大学, 2019.
[28] Sima Wenxia. Saturable reactor hysteresis model based on Jiles-Atherton formulation for ferrore- sonance studies[J]. International Journal of Electrical Power & Energy Systems, 2018, 101: 482-490.
[29] 汪伟, 汲胜昌, 李彦明. 用非线性电阻模拟变压器损耗进行铁磁谐振过电压研究[J]. 西安交通大学学报, 2009, 43(10): 109-113.
Wang Wei, Ji Shengchang, Li Yanming. Ferrore- sonance simulation with nonlinear resistance mode- ling for transformer power losses[J]. Journal of Xi'an Jiaotong University, 2009, 43(10): 109-113.
[30] 纪德洋, 金锋, 冬雷, 等. 基于皮尔逊相关系数的光伏电站数据修复[J]. 中国电机工程学报, 2022, 42(4): 1514-1523.
Ji Deyang, Jin Feng, Dong Lei, et al. Data repairing of photovoltaic power plant based on Pearson correlation coefficient[J]. Proceedings of the CSEE, 2022, 42(4): 1514-1523.
[31] 任明, 夏昌杰, 余家赫, 等. 绝缘子沿面放电多光谱脉冲演化特性及诊断方法研究[J]. 电工技术学报, 2023, 38(3): 806-817.
Ren Ming, Xia Changjie, Yu Jiahe, et al. Multi- spectral pulse evolution of insulator surface dis- charges and its diagnosis approach[J]. Transactions of China Electrotechnical Society, 2023, 38(3): 806- 817.
[32] 张骞, 边晓燕, 徐鑫裕, 等. 基于SVD-Prony及主成分回归的次同步振荡阻尼特性影响因素研究[J]. 电工技术学报, 2022, 37(17): 4364-4376.
Zhang Qian, Bian Xiaoyan, Xu Xinyu, et al. Analysis of influencing factors on damping characteristics of subsynchronous oscillation based on singular value decomposition Prony and principal component regression[J]. Transactions of China Electrotechnical Society, 2022, 37(17): 4364-4376.
Abstract The low-frequency responses of potential transformers (PT) are essential in power system protection. Due to the complex winding structure and large transformation ratio, the stray capacitance will significantly impact the dynamic performance of the PT. Many studies have analyzed the distribution of the electric field and magnetic field energy of the PT at low frequencies to determine its modeling method of it. However, it is difficult to obtain the stray capacitance value of a PT without its detailed internal structure parameters, which makes it challenging to build an accurate low-frequency simulation model.
Firstly, the electric field energy distribution for two typical winding structures was analyzed, and the corresponding stray capacitance values could be calculated. The capacitance calculation method explained the generation mechanism of the PT and could provide references for the design progress. However, most users of the PT are not involved in the design progress and need help understanding its detailed internal structure parameters. Therefore, a non-destructive experiment method is necessary for the stray capacitance evaluation. Secondly, the equivalent model of PT stray capacitance distribution at low frequency was built, and the low-frequency dynamic responses under electromagnetic field coupling of the core and coil were analyzed. The obtained model can provide support for the experimental designs. Finally, a series of tests were carried out to obtain the specific value of PT stray capacitance. By connecting the inductance in series between the PT and the frequency conversion power supply port, the resonance point of the sweep frequency test was reduced to the low-frequency range, and the value of the stray capacitance was accurately calculated. Since this method requires a narrow scanning frequency band and a low scanning frequency, the hardware requirements for power supply and measuring equipment are reduced, and the loss problem caused by high-frequency testing is avoided. Furthermore, the capacitive and excitation current components in the PT port current could be separated, and the hysteresis curve could be accurately drawn.
Based on the problem that it is difficult to measure the PT stray capacitance and hysteresis curve in engineering, this paper reduced the resonant frequency point of the sweep frequency test using series inductance and calculated the stray capacitance. Furthermore, the capacitive component in the current of the PT port could be excluded, and the accurate drawing of the hysteresis curve of the iron core could be realized. Combined with the short-circuit test and DC resistance measurement results, the p-type equivalent circuit of PT was constructed. The simulation results had good frequency response characteristics. The Pearson correlation coefficient was introduced to study the accuracy of the simulation model, and the correlation coefficient with the test results remained above 95 %. Due to the accurate description of the inductive and capacitive coupling, the model can be applied to the ferromagnetic resonance simulation of a power system to obtain more accurate simulation results and provide a reference for the design of the anti-resonance scheme.
keywords:Potential transformer, stray capacitance, hysteresis loop, frequency scanning
DOI: 10.19595/j.cnki.1000-6753.tces.220131
中图分类号:TM451
国家电网有限公司科技资助项目(SGCQDK00SBJS2000041)。
收稿日期 2022-01-24
改稿日期 2022-04-25
沈泽亮 男,1996年生,博士研究生,研究方向为高压试验技术。E-mail: 20143796@cqu.edu.cn
汪金刚 男,1979年生,教授,博士生导师,研究方向为智能传感设备。E-mail: jingang_023@163.com(通信作者)
(编辑 崔文静)