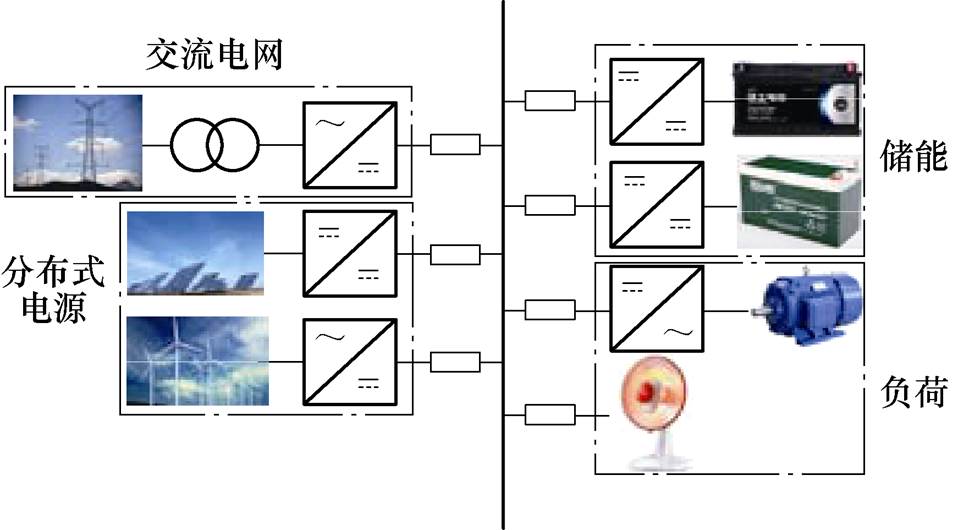
图1 典型直流微电网结构
Fig.1 Typical configuration diagram of a DC microgrid
摘要 针对直流微电网下垂控制变流器并联系统中变流器间内部参数差异引发的并联稳定性问题,该文采用基于变流器输出阻抗的频域方法进行研究。首先,该文建立单台下垂控制Buck变流器的输出阻抗模型并分析其特征。然后,依据该输出阻抗特征,基于变流器输出阻抗的稳定性分析方法揭示下垂控制变流器并联系统的振荡机理。在此基础上,对变流器输出阻抗进一步简化,结合并联系统振荡机理提出并联系统关键参数的稳定边界。最后,搭建下垂控制Buck变流器并联系统实验平台,通过实验验证了所提振荡机理及稳定边界的正确性。
关键词:下垂控制 输出阻抗 变流器并联系统 稳定边界
直流微电网是未来智能配用电系统的重要组成部分,对于推进节能减排、实现能源可持续发展、积极响应“碳达峰、碳中和”战略具有重要意义[1-2],其典型结构如图1所示,多个微源采用变流器接入系统母线。直流微电网通常采用分层控制策略,其中下垂控制作为初级控制用来实现各变流器间功率分配并维持系统母线电压稳定。然而,下垂并联变流器间相互作用易引发母线电压振荡失稳,严重威胁直流电网安全稳定运行。因此,直流微电网稳定性至关重要。
图1 典型直流微电网结构
Fig.1 Typical configuration diagram of a DC microgrid
近年来,国内外学者分别从大信号[3-5]和小信 号[6-9]两个角度对直流微电网稳定性展开了广泛的研究,本文则从小信号角度对其进行研究。
直流微电网小信号稳定性研究可以分为特征值分析和阻抗分析两类。文献[6-10]建立了直流微电网状态空间平均模型,通过变流器控制参数、下垂系数和负载类型等单一参数变化时系统的特征值根轨迹,对直流微电网进行了小信号稳定性分析。特征值分析考虑了变流器之间的差异对并联系统稳定性的影响,但其建模和计算过程复杂。
阻抗分析法只需要研究各变流器模块端口特性,能从根本上简化分析过程。文献[11-14]采用变流器阻抗比判据分析了直流并联系统母线电压的稳定性,文献[5]进一步提出了基于并联阻抗的改进稳定性判据。在此基础上,文献[15]通过观察电源、负荷等效输出/输入阻抗伯德图在谐振频率处的相频频率特性,将其近似等效为RL串联电路,求出并联总阻抗的阻尼系数和谐振频率,获得了系统的稳定条件。文献[16]在文献[15]的基础上,给出了输出阻抗等效电感和电阻的解析表达式,并基于所提降阶模型和并联阻抗的稳定性判据,得到新的稳定性判据,且分析了直流电压控制单元详细控制参数对等效电阻、等效电感以及稳定性判据的影响。然而,文献[16]将多台并联电源变流器等效为一台电源变流器,并未考虑并联变流器之间的差异性,同时当多台直流电压控制单元控制参数不同时,无法得到全系统二阶降阶模型。综上所述,现有直流微电网阻抗分析只关注电源和负载之间的相互作用对系统稳定性的影响,而忽略了电源之间的差异对系统稳定性的影响。电源之间差异会导致输出阻抗存在差异,当输出阻抗差异达到一定程度时可引发振荡带来稳定性问题。
针对以上现有研究的局限性,本文以下垂控制Buck变流器并联系统为研究对象,研究了变流器之间参数差异对系统稳定性的影响。首先,推导了单台下垂控制Buck变流器输出阻抗模型并分析了关键参数如电感、电容和控制参数对输出阻抗特征的影响;其次,依据输出阻抗特征,并基于变流器输出阻抗的并联系统稳定性分析方法揭示了下垂控制变流器并联系统的振荡机理;然后,通过对输出阻抗进行合理简化,依据并联系统振荡机理求解出并联系统关键参数的稳定边界;最后,通过硬件实验验证了理论分析的正确性。
本文研究的直流变流器并联系统示意图如图2所示,变流器分别记作CONV1和CONV2。由于本文只研究电源之间相互作用对系统稳定性的影响,进而可以忽略负载动态,因此可采用电流源作为负载。
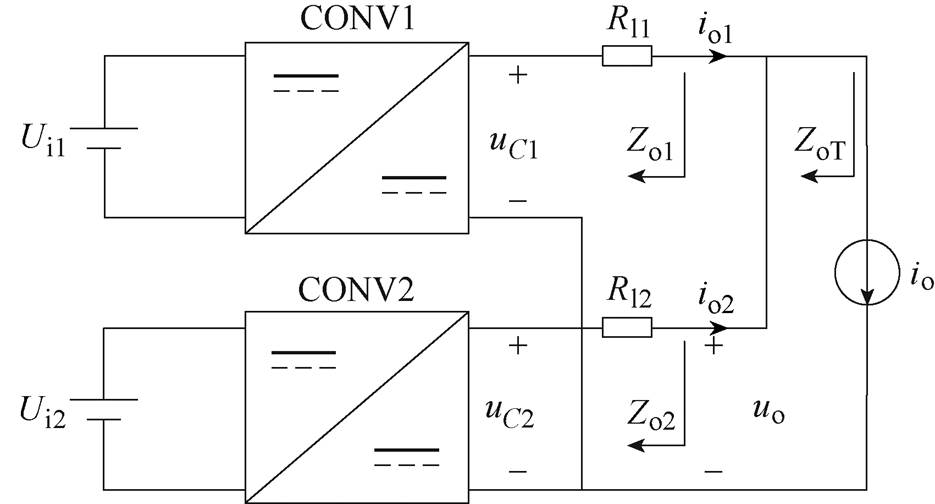
图2 下垂控制DC-DC变流器并联系统示意图
Fig.2 Schematic diagram of droop-controlled parallel DC-DC converters
下垂控制Buck变流器的主电路和控制基本结构如图3所示。主电路中,Ui为直流输入电压;Lf、Cf分别为输出LC滤波器的滤波电感和滤波电容;RL、RC分别为滤波电感和滤波电容的等效串联电阻;Rl为输出线路阻抗;io为恒流型负载电流。
控制系统由外部传统下垂控制和内部电流模式控制两部分组成。外部为下垂控制,Rd为传统下垂系数,直流电压通过下垂控制输出电容两端电压基准 。内部为电流模式控制,采用比例积分补偿器Gu调节电容两端电压uC,以跟踪直流参考电压,采用比例补偿器Gi调节电感电流iL,以跟踪电流基准
 。其中,d为占空比。
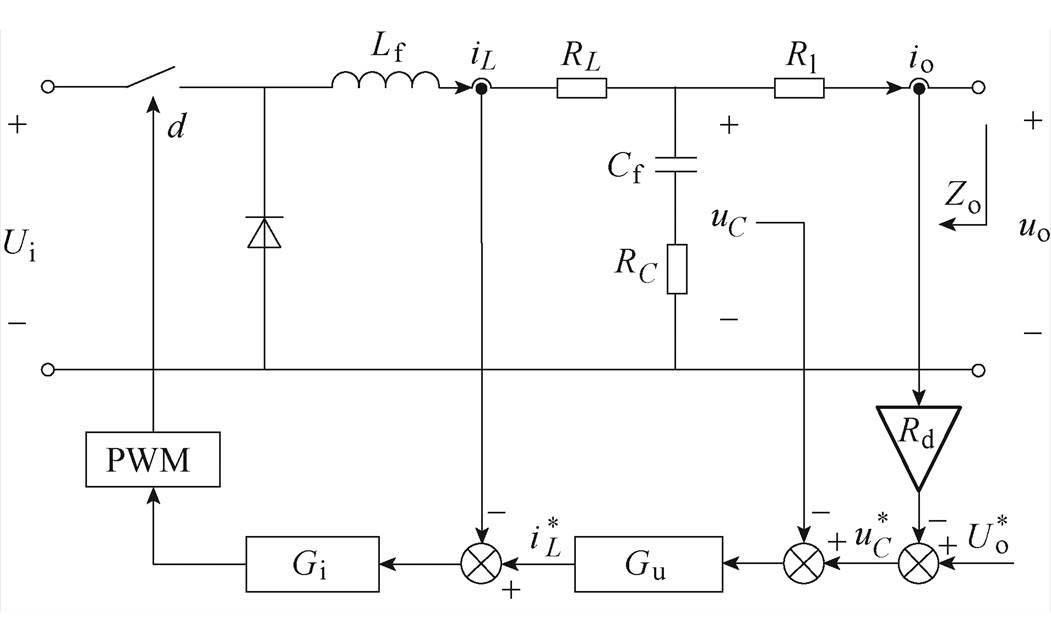
图3 下垂控制Buck变流器原理
Fig.3 Schematic diagram of the droop-controlled Buck converter
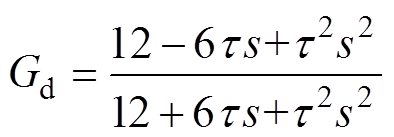
Ts为开关周期,Tsm为采样周期。单更新模式下,采样周期和开关周期一致。数字PWM控制可近似为一个延时环节,延时时间t =1.5Tsm。本文用二阶Pade近似表达式[17]表示延时环节Gd。
1.1.1 主电路建模
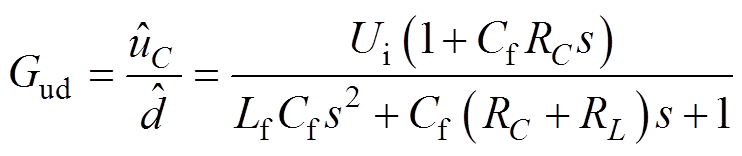
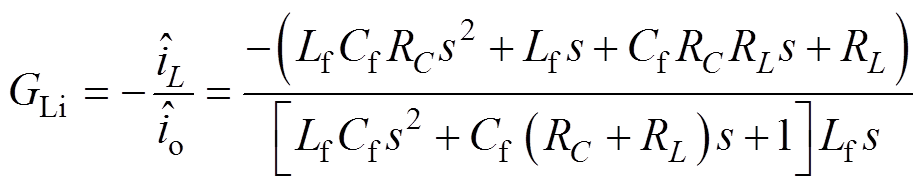
Buck变流器主电路的传递函数表达式分别为
 (1)
(1)
 (2)
(2)
 (3)
(3)
 (4)
(4)
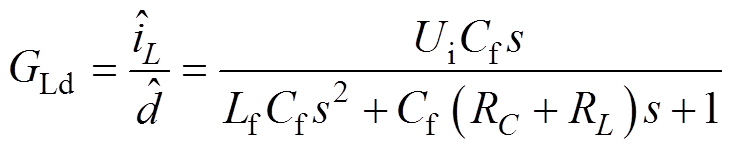
式中,上标“ ”表示变量的小信号形式,变量的大写表示其稳态工作点;GLd为占空比到电感电流的传递函数;Gud为占空比到电容两端输出电压的传递函数;Zop为不包含线路阻抗的直流变流器开环输出阻抗;GLi为输出电流到电感电流的传递函数。
1.1.2 控制回路建模
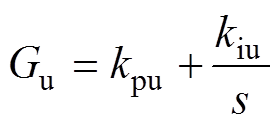
将以上主电路模型与控制系统连接起来,可得如图4所示的Buck变流器的小信号模型系统框图,图中,电压调节器Gu、电流调节器Gi和控制系统延时Gd的传递函数分别为
 (5)
(5)
 (6)
(6)
 (7)
(7)
式中,kpu和kpi分别为电压和电流控制器的比例系数;kiu为电压控制器的积分系数。
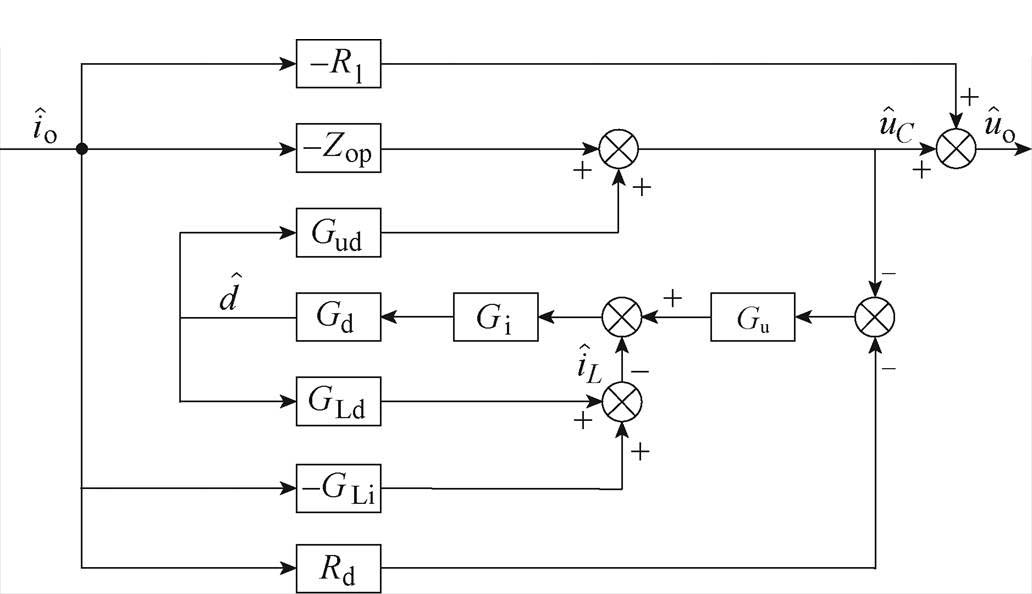
图4 下垂控制Buck变流器小信号模型框图
Fig.4 Block diagram of the small-signal model of the droop-controlled Buck converter
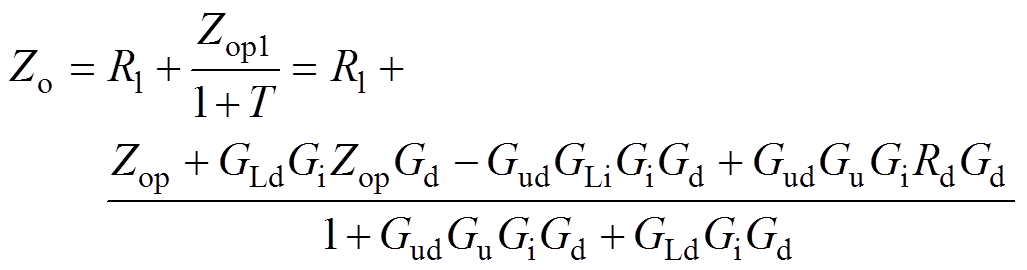
由图4可得输入到输出的传递函数,即下垂控制Buck变流器输出阻抗Zo为
 (8)
(8)
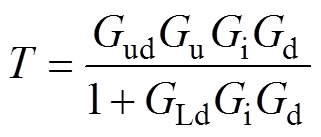
式中,T为系统的环路增益;Zop1为等效开环输出阻抗,它们的传递函数分别为
 (9)
(9)
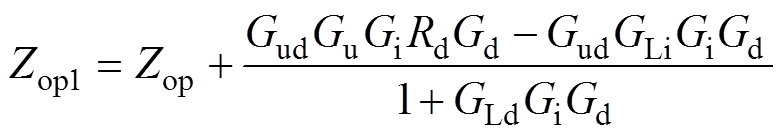 (10)
(10)
下垂控制Buck变流器CONV1和CONV2的参数见表1。将表1中下垂控制Buck变流器CONV1参数代入式(8)可得到输出阻抗Zo1理论模型伯德图如图5所示,其与仿真模型中采用Saber扫频得到的输出阻抗伯德图一致,证明了建模的正确性。
通过对单台Buck变流器输出阻抗模型进行特征分析,发现电压控制器参数、电流控制器参数、电容、电感等关键参数均对输出阻抗有影响。
表1 下垂控制Buck变流器CONV1和CONV2的参数
Tab.1 Parameters of droop-controlled Buck converters CONV1 and CONV2
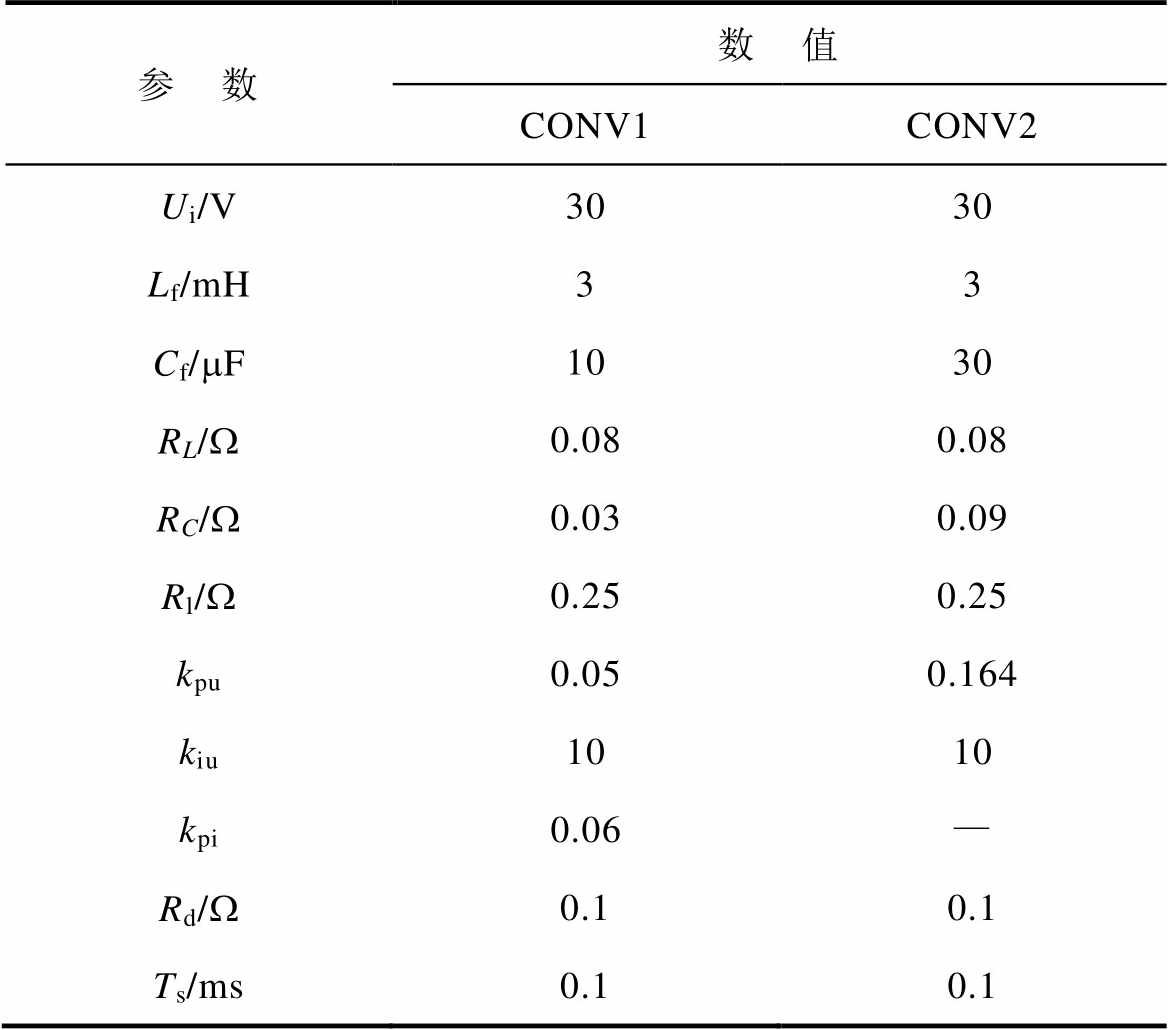
参 数数 值 CONV1CONV2 Ui/V3030 Lf/mH33 Cf/mF1030 RL/W0.080.08 RC/W0.030.09 Rl/W0.250.25 kpu0.050.164 kiu1010 kpi0.06— Rd/W0.10.1 Ts/ms0.10.1
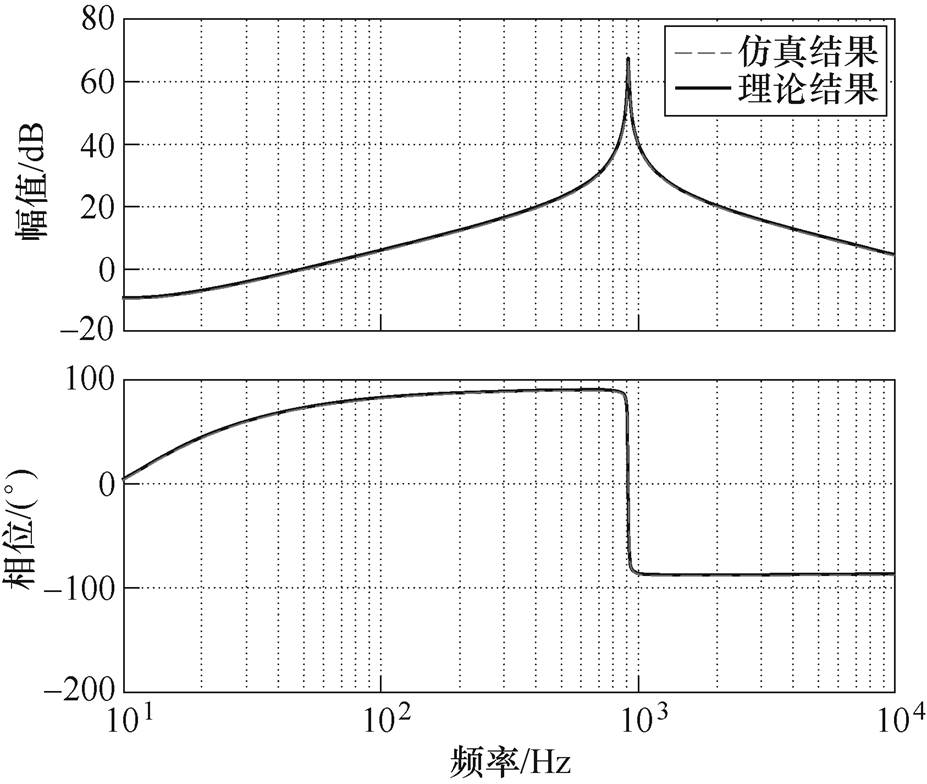
图5 下垂控制Buck变流器输出阻抗Zo1伯德图
Fig.5 Bode plot of output impedance Zo1 of droop-controlled Buck converter
图6给出了部分主电路参数和控制参数取不同值时的下垂控制Buck变流器CONV1输出阻抗Zo1伯德图。图6a中,当Cf增加时,谐振频率减小,谐振峰值减小;图6b中,当Lf增加时,谐振频率减小,谐振峰值增大;图6c和图6d中,当kpu或kiu增加时,谐振频率不变,谐振峰值增大;图6e中,当kpi增加时,谐振频率增大,谐振峰值会先减小后增大;图6f中,当Rd增加时,谐振频率不变,谐振峰值不变。
综上所述,下垂控制Buck变流器输出阻抗幅频存在谐振峰,在谐振峰频率处相位出现跳变;同时该频率主要受电流调节器比例系数kpi、滤波电感Lf和滤波电容Cf影响。
第1节建立了下垂控制Buck变流器的输出阻抗模型,同时对闭环输出阻抗特征进行了分析,接下来将介绍并联系统稳定性分析方法和振荡机理。
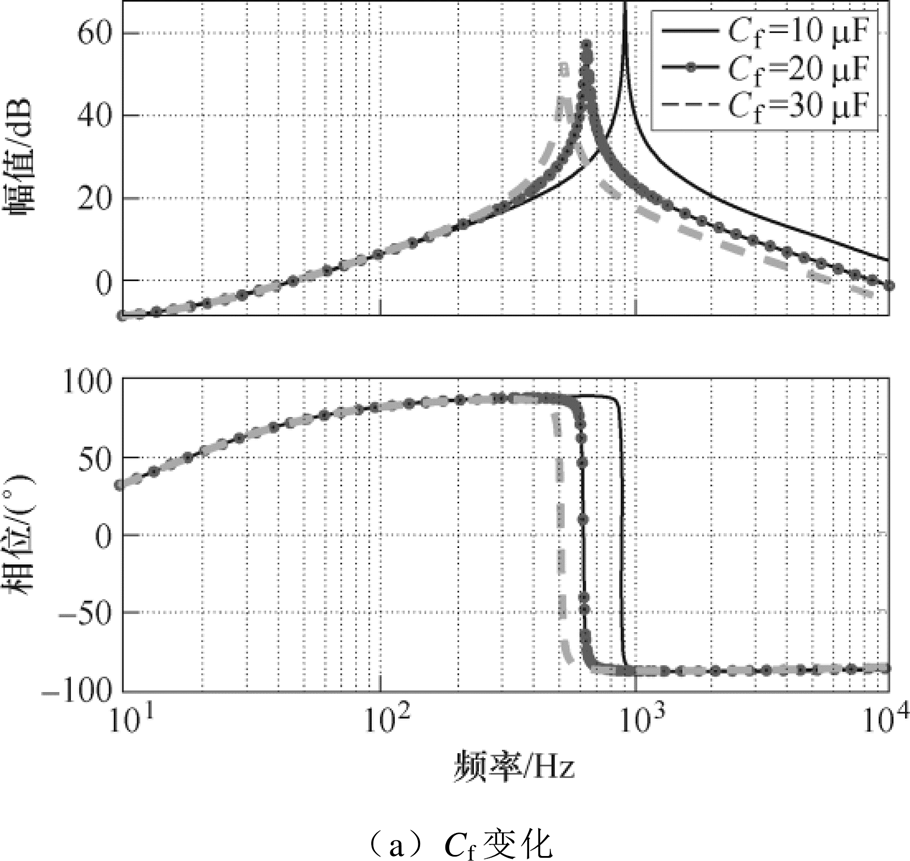
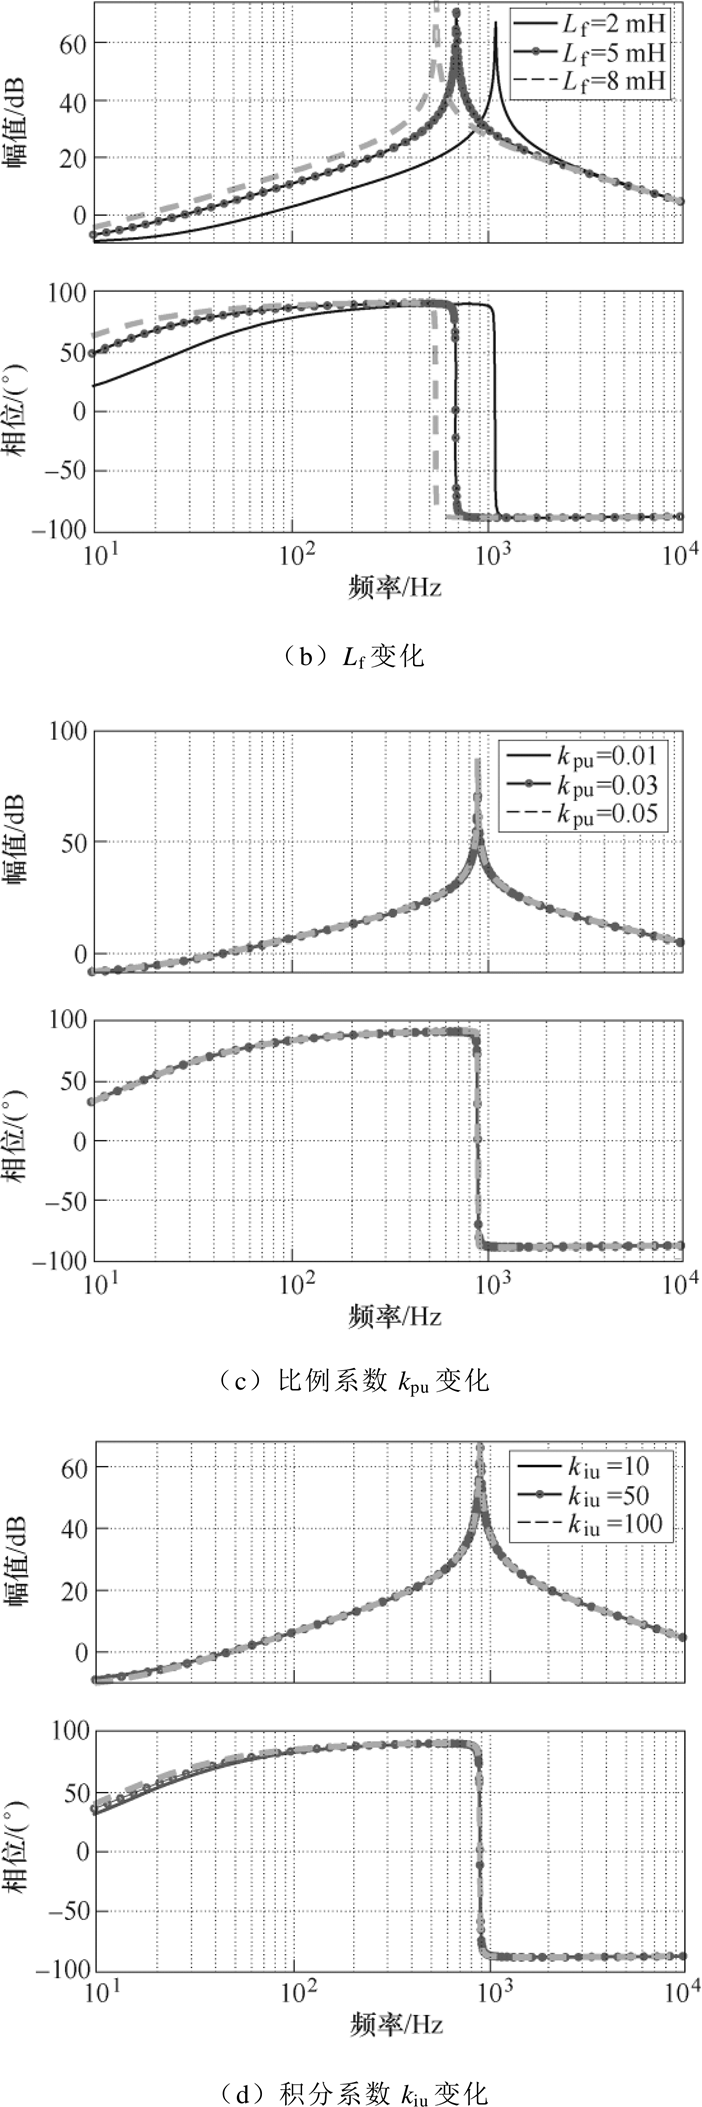

图6 主电路参数及控制参数变化时输出阻抗Zo1伯德图
Fig.6 Bode plots of output impedance Zo1 with varied main circuit parameters and control parameters
依照图2中各变流器输出阻抗并联关系,可得并联系统总输出阻抗如式(11)所示。当各变流器稳定且输出阻抗Zo1和Zo2不含右半平面零点(Right Half plane Zero, RHZ)时,式(12)所示的并联系统等效环路增益Te将不含右半平面极点(Right Half plane Pole, RHP),因此可以依据奈奎斯特判据[18]来判断系统稳定性。
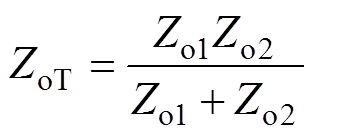 (11)
(11)
 (12)
(12)
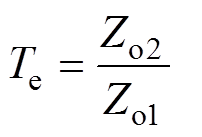
对于Buck、Boost、Buck-Boost变流器,它们输出阻抗没有RHZ[19]。以表1中参数为例,图7a和图8a分别描绘了输出阻抗Zo1和Zo2的RHP,当kpi增大时,极点从左半平面移到右半平面,说明系统由稳定变得不稳定。图7b和图8b分别描绘了Zo1和Zo2的RHZ,当kpi增大时,零点从左半平面移到右半平面。

图7 比例系数kpi增大时输出阻抗Zo1的零极点
Fig.7 Pole-zero map of output impedance Zo1 when the proportional coefficientkpi increases
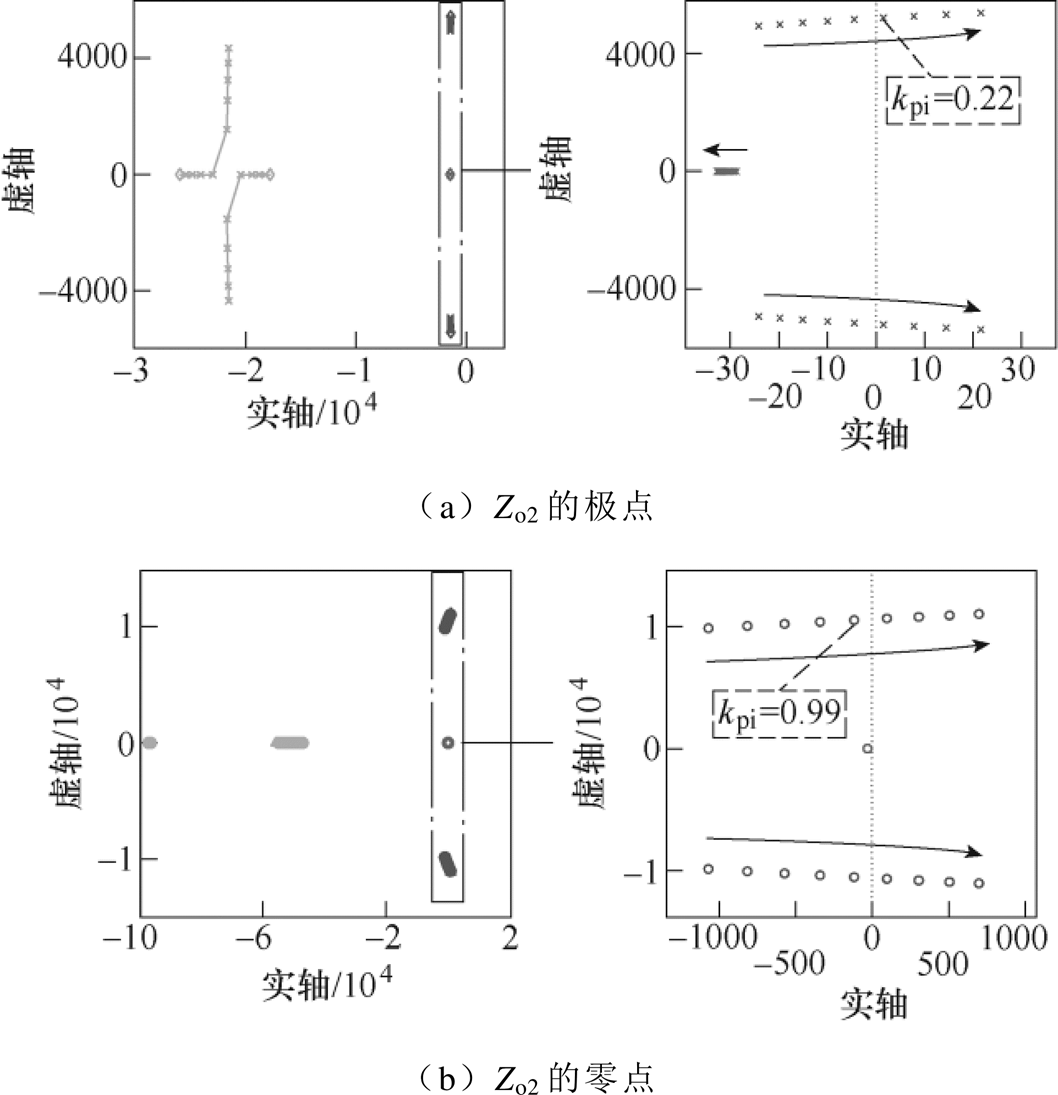
图8 比例系数kpi增大时输出阻抗Zo2的零极点
Fig.8 Pole-zero map of output impedance Zo2 when the proportional coefficientkpi increases
因此,对变流器CONV1而言,当kpi<0.07时,系统稳定;当kpi<1.02时,系统不存在RHZ。对CONV2而言,当kpi<0.21时,系统稳定;当kpi<0.99时,系统不存在RHZ。所以单个变流器稳定时均不存在RHZ,满足对并联系统进行下一步稳定性分析的前提。
综上所述,在下垂控制Buck变流器并联系统中,若单个变流器均能稳定运行,依据奈奎斯特判据,并联系统稳定的充要条件为式(12)所示的等效环路增益Te在复平面上围绕(-1+j0)的次数为0。该充要条件等效为输出阻抗幅频曲线相交时对应的相频曲线相位差小于180 °。
下垂并联系统稳定性取决于等效环路增益,即变流器输出阻抗比值。由下垂控制Buck变流器输出阻抗特征可得,当电流调节器比例系数kpi等参数变化时,输出阻抗幅值谐振峰将发生偏移。因此,当两台下垂控制Buck变流器电流调节器比例系数kpi等参数存在一定差异时,它们的输出阻抗幅值谐振峰位置将存在偏差,如图9所示。
由图9可以看出,变流器CONV1输出阻抗Zo1的谐振峰位于变流器CONV2输出阻抗Zo2谐振峰的左侧,进而Zo1谐振峰右侧将与Zo2谐振峰左侧相交,对应的频率为fosc;与此同时输出阻抗Zo1的相位将先于Zo2发生跳变,在频率fosc处相频曲线间的相位差为Dj。此时并联系统稳定性取决于Dj:当Dj<180 °时,并联系统稳定;当Dj>180 °时,并联系统不稳定。
由于下垂控制Buck变流器输出阻抗在谐振峰处的相位跳变可超过180 °,因此图9中相频曲线相位差Dj 可大于180 °,进而引发系统振荡,振荡时母线电压频率为fosc,下垂控制并联系统振荡母线电压波形示意图如图10所示。
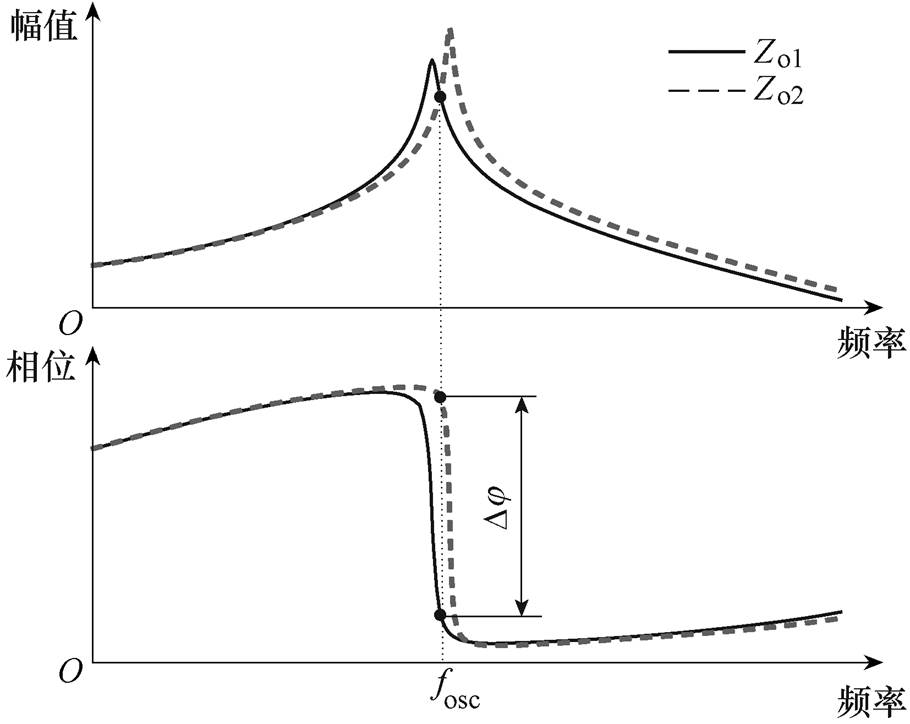
图9 参数不一致时两台下垂控制Buck变流器输出阻抗示意图
Fig.9 Sketches of output impedances of two droop-controlled Buck converters when the parameters are inconsistent
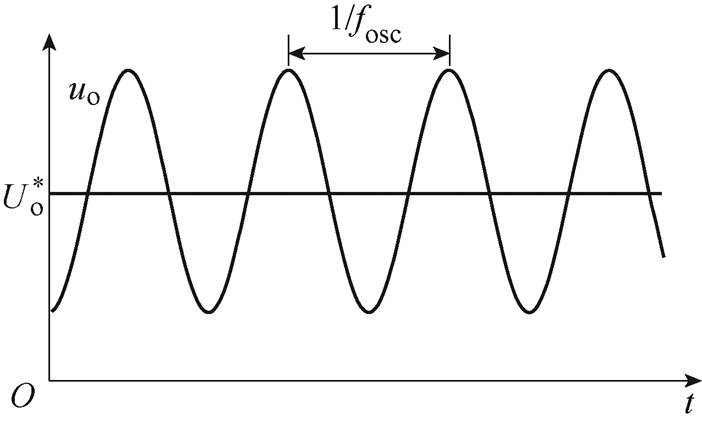
图10 下垂控制并联系统振荡母线电压波形示意图
Fig.10 Sketch of the bus voltage waveform in droop-controlled parallel converters with oscillation
本节将对输出阻抗进行简化,依据振荡机理和稳定性判据,求解出并联系统关键参数的稳定边界。
3.1.1 忽略寄生参数和数字控制延时
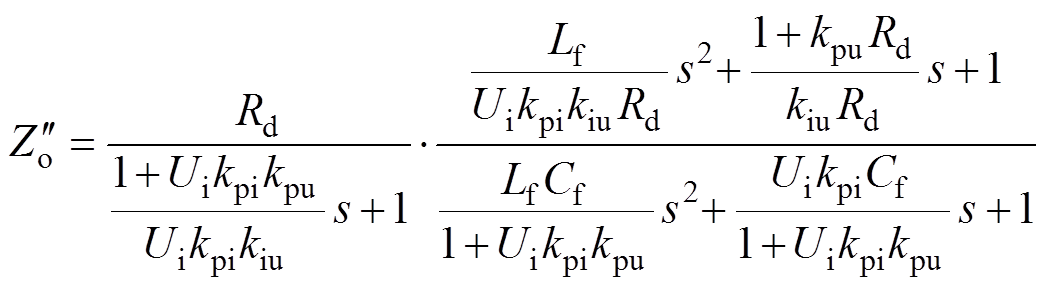
为获得输出阻抗主导零极点解析表达式,本文不仅忽略了主电路寄生参数,还忽略了数字控制延时以降低模型阶数,可得简化后的输出阻抗为
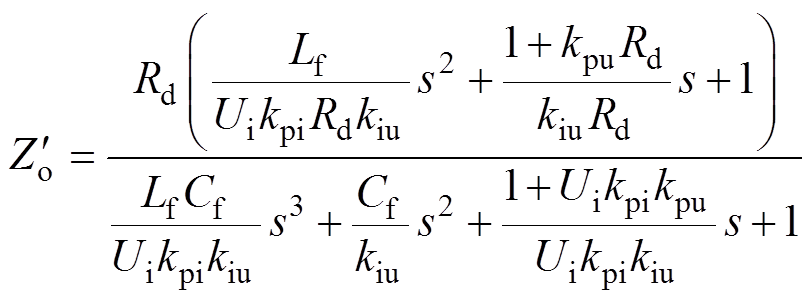 (13)
(13)
下面以表1变流器CONV1的参数为例讨论RC、RL、Rl等寄生参数和数字控制延时对闭环输出阻抗谐振峰的影响。图11绘制了寄生参数及数字控制延时取不同值时的输出阻抗伯德图,从图中看出,随着寄生参数减小,谐振峰增大。因此,忽略寄生参数,会使谐振峰增大即阻尼系数减小,使并联系统的参数稳定域缩小,是确保并联系统稳定的充分条件。
而随着数字控制延时降低,输出阻抗的谐振峰减小,即忽略数字控制延时会使阻尼系数增大,使并联系统的参数稳定域增大。因此,在忽略数字控制延时的基础上,要进一步修正阻尼系数。
3.1.2 修正阻尼系数
基于一元多项式因式分解方法,对于式(13),若参数取值满足式(14)和式(15),则可以得到因式分解如式(16)所示。

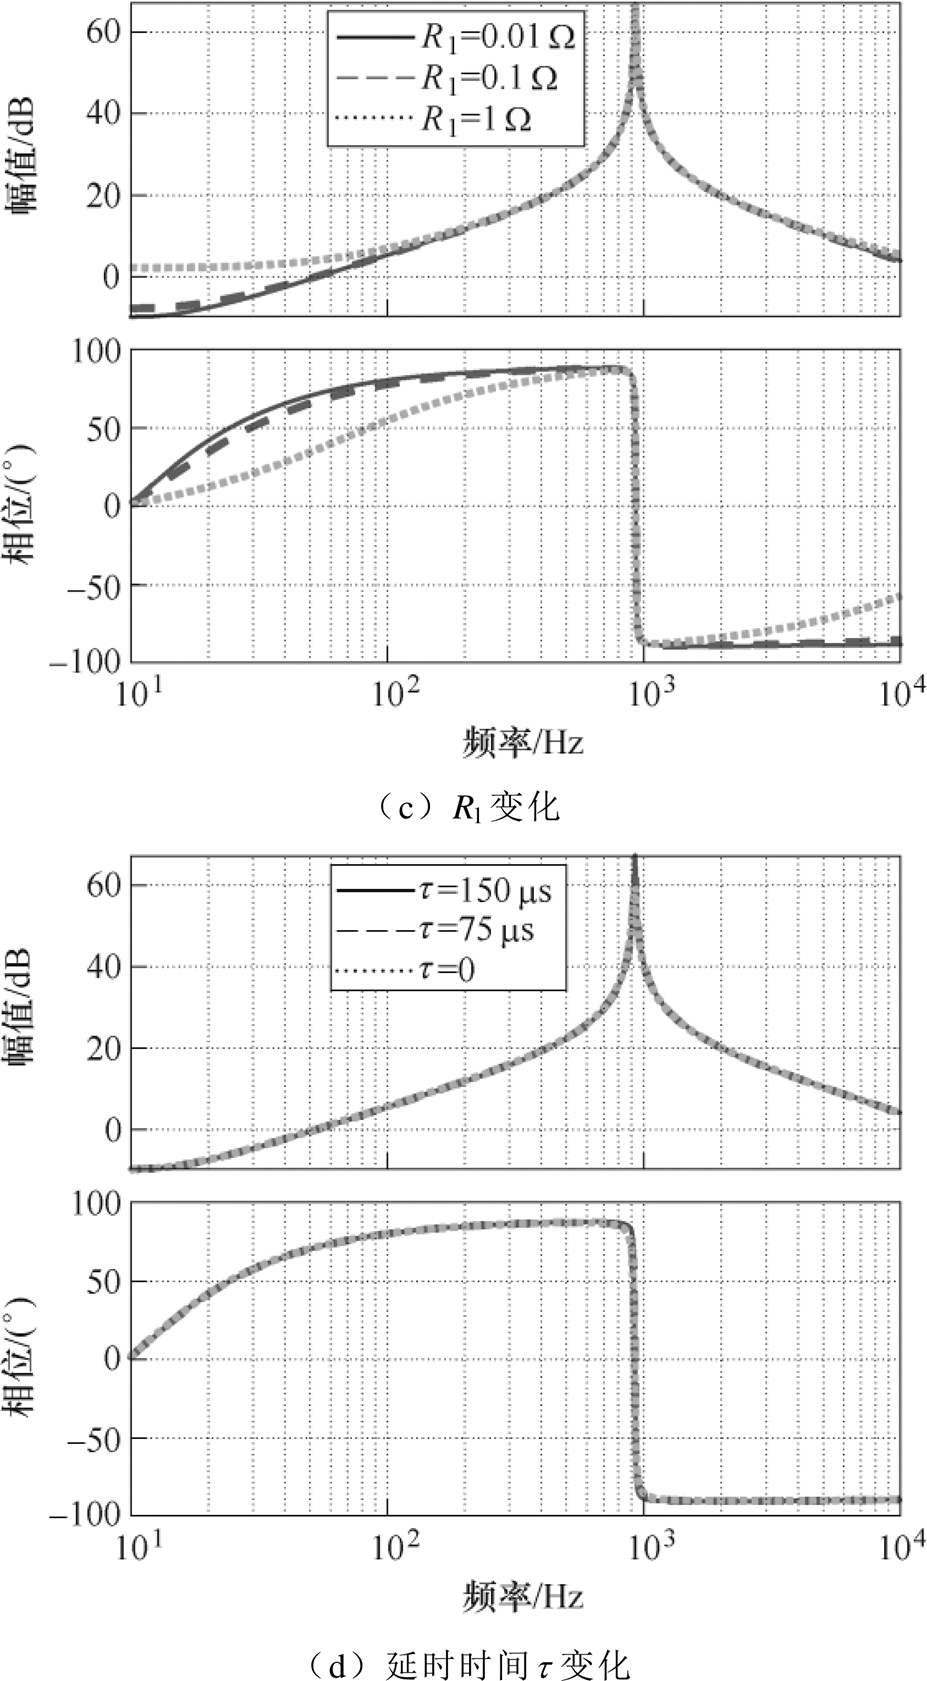
图11 寄生参数和数字延时变化时输出阻抗Zo1伯德图
Fig.11 Bode plot of output impedance Zo1 with varied parasitic parameters and switching frequency
 (14)
(14)
 (15)
(15)
 (16)
(16)
由于忽略数字控制延时后阻尼系数增大,影响了模型准确性,因此需要对式(16)进行修正。
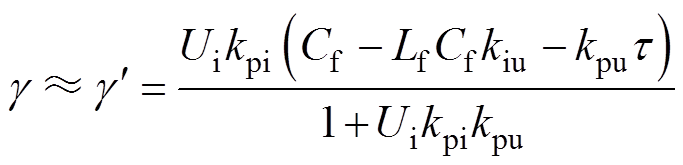
令修正后的输出阻抗传递函数 等于未忽略延时的阻抗传递函数,从而求出修正后传递函数为
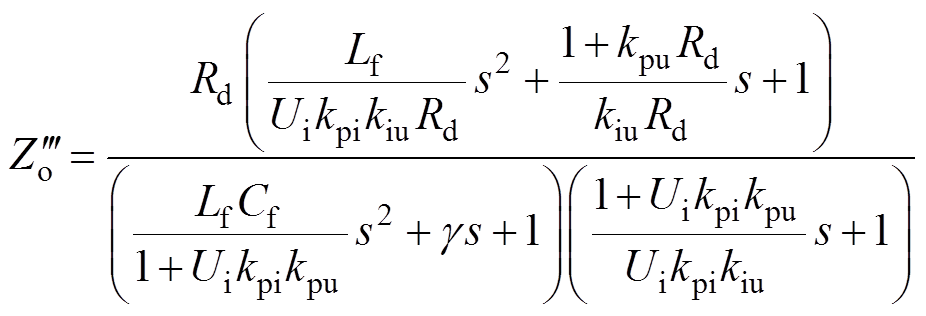 (17)
(17)
式中, 为等效阻尼系数。
因利用上述方法求得的g 随频率变化,无法得到零极点解析式,因此需要一个常值来代替谐振频率处的值。绘制输出阻抗Zo、等效阻尼系数及其分子分母s3项系数之比 的伯德图如图12所示,可以看出,幅值与谐振频率处幅值很接近,故用来近似代替谐振频率处的值,其表达式为
 (18)
(18)
因式分解后输出阻抗 和阻尼系数修正后输出阻抗的相对误差曲线分别如图13和图14所示,从图中可以看出,简化后最大相对误差小于5 %,并且阻尼系数修正后相对误差明显降低,提升了简化模型的准确性。此外,阻尼系数修正后,并联系统参数稳定域不超出实际系统,可获得系统稳定充分条件,因此该简化模型可用于下文稳定性分析。
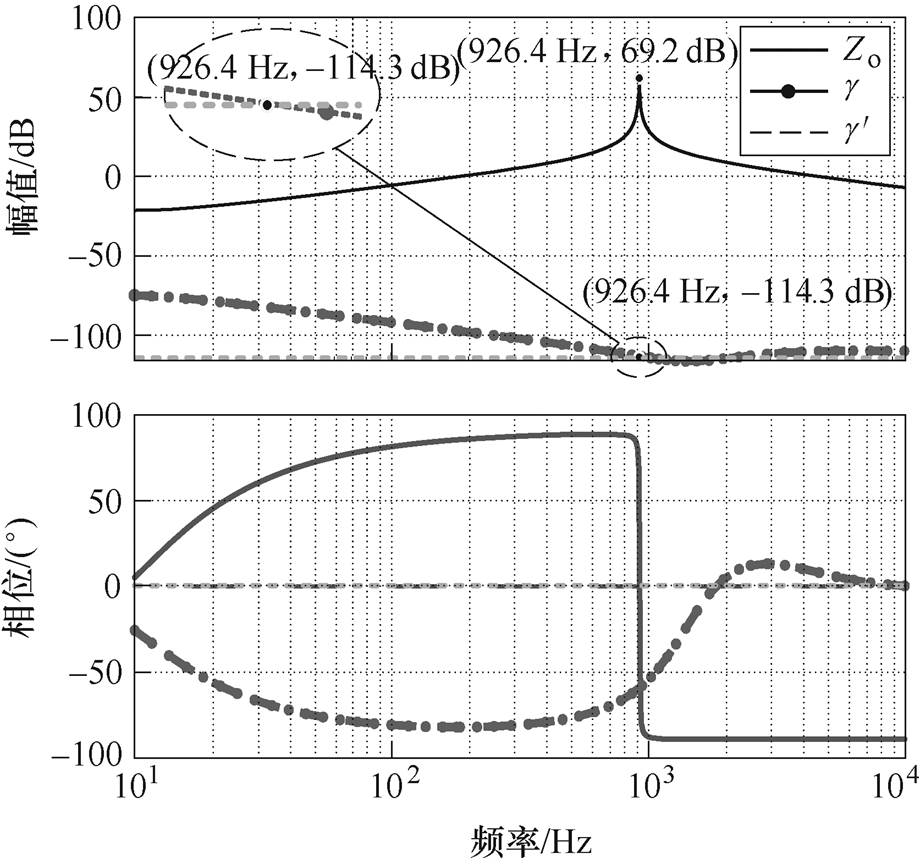
图12 输出阻抗Zo、等效阻尼系数 和近似阻尼系数
 的伯德图
的伯德图
Fig.12 Bode plots of output impedance Zo, equivalent damping coefficient and approximated damping coefficient
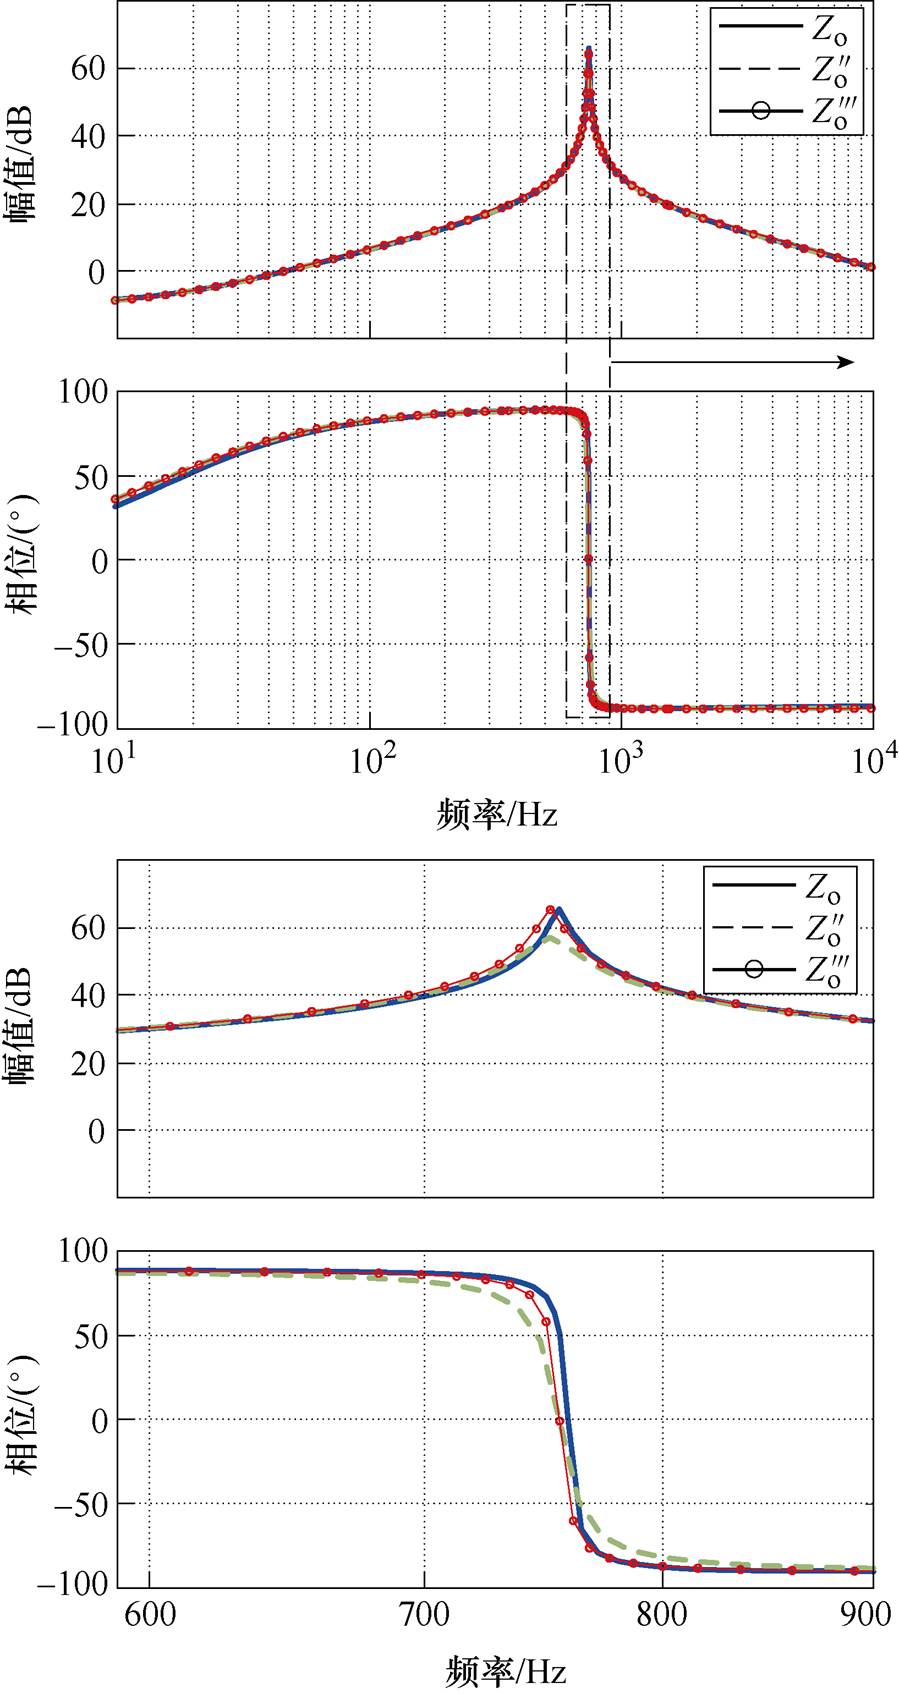
图13 简化前后输出阻抗伯德图
Fig.13 Bode plots of output impedances before and after simplification
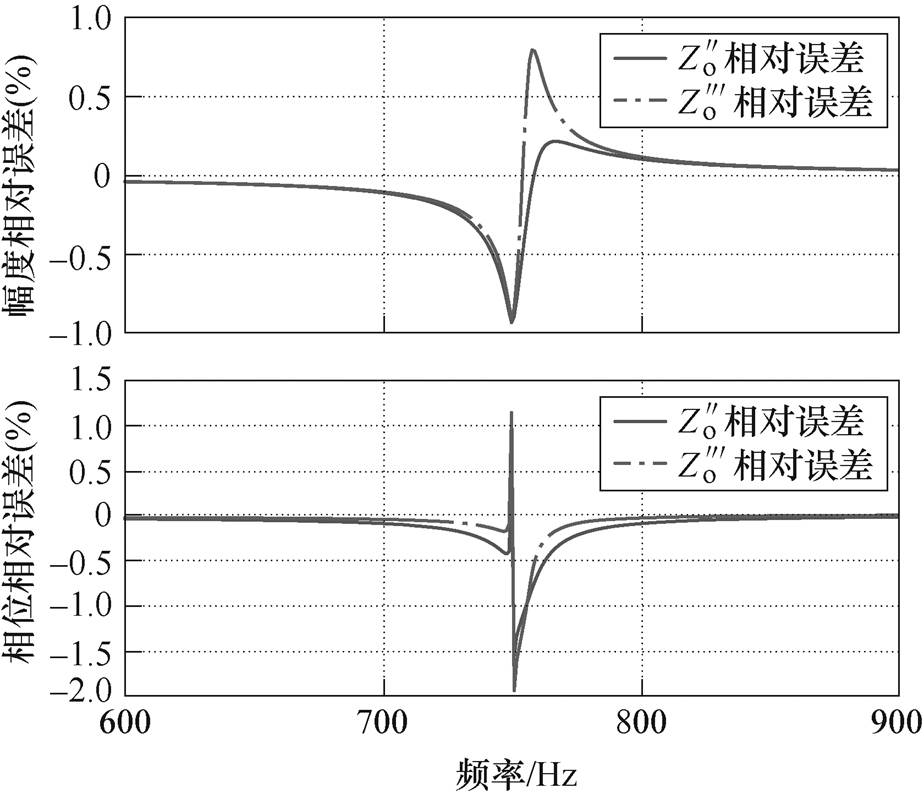
图14 简化后输出阻抗相对误差曲线
Fig.14 Relative error plots of simplified output impedances
3.1.3 折线近似
因为分析并联系统稳定性时,需比较变流器CONV1和CONV2的输出阻抗在增益相同时的相位差。然而输出阻抗中含有多个变流器参数,为复杂高阶函数,很难通过直接比较它们相位来得到稳定边界表达式。故要采用分段折线近似法简化输出阻抗,以减少其幅频、相频曲线在每个频率段包含的系统参数个数。这是得到直流变流器并联系统稳定性判据表达式,找到系统稳定性与变流器参数的关系的有效方法。
本文采用如图15所示的三转折点法对幅频曲线进行近似,即在原伯德图Zo谐振峰附近引入A(0.5w3/(2p), )、B(0.9w3/(2p),
 )、C(1.1w3/(2p),
  )、E(2w3/(2p),
  )四个点,用线段AB和它的延长线,以及线段CE和它的延长线代替在这个区间的原伯德图,进而得到折线近似后的伯德图
 。其中,谐振频率为w3/(2p)。相比于传统近似方法[20],三转折点法改善了谐振峰附近幅频特性的贴合度,会减小幅频交点频率的误差。
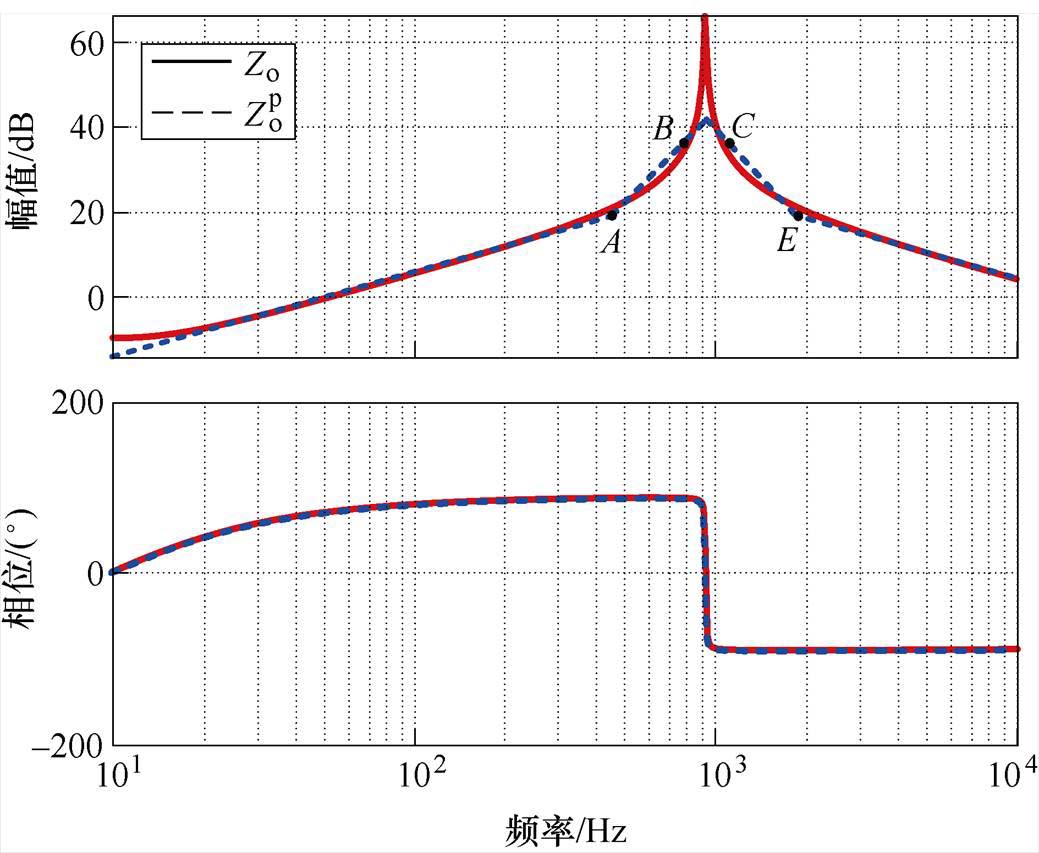
图15 折线近似前后下垂控制Buck变流器输出阻抗伯德图
Fig.15 Bode plots of the output impedance of the Buck converter with droop control before and after the polyline approximation
利用三转折点法对式(17)进一步简化,得到幅频和相频表达式分别为
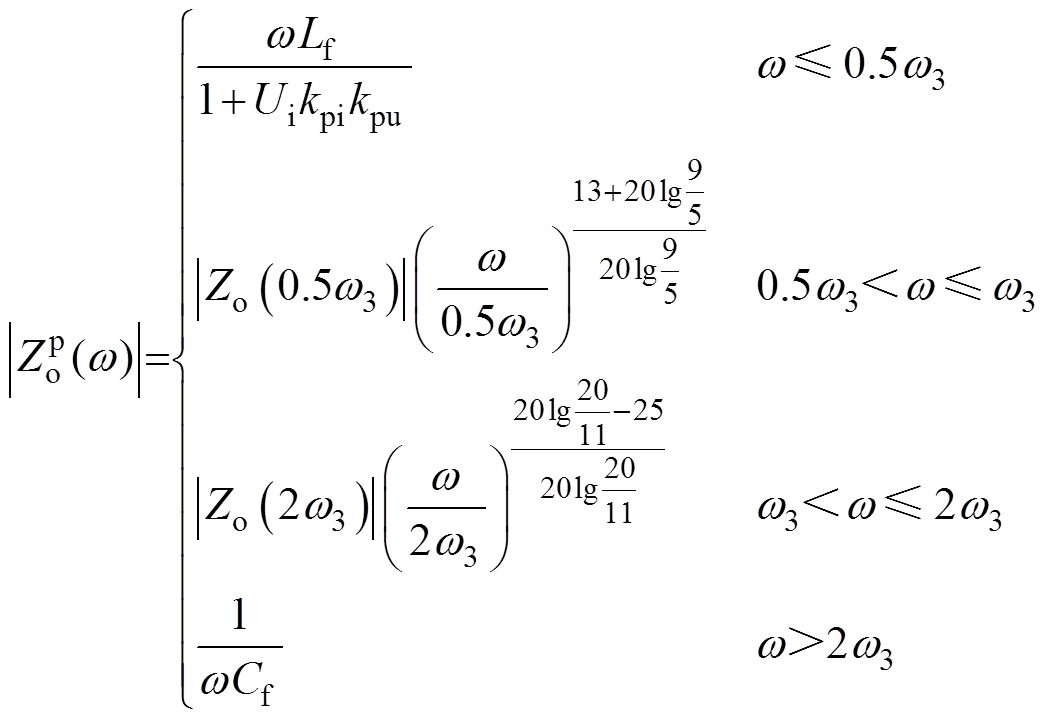 (19)
(19)
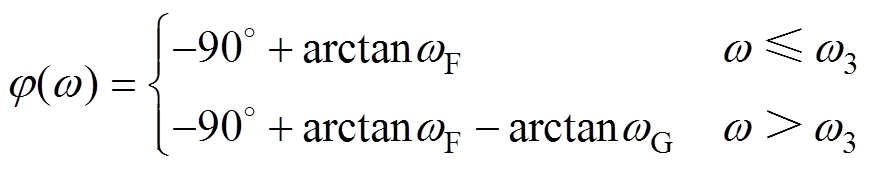 (20)
(20)
式中,w3、wF与wG的表达式分别为
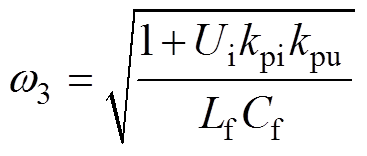 (21)
(21)
 (22)
(22)
 (23)
(23)
图15将未简化的和折线近似后的输出阻抗频率特性进行对比,可以看出二者误差很小。
图16给出了的4个频段的幅频曲线, 表示图中的第k个频率段的幅频曲线。从图中可以看出,
 的前两个频率段的幅频曲线和
 的后两个频率段的幅频曲线可能会产生有较大相位差的幅频交点,这分别与表2的a、b、c、d四种相交情况相对应。根据振荡机理,需求出四种相交情况下和的幅频交点频率fosc,将求得结果列入表2中。

图16 并联系统稳定边界求解示意图
Fig.16 Sketch for solving the stability boundary of parallel converters
表2 并联变流器输出阻抗幅频交点频率
Tab.2 Output impedance amplitude-frequency intersection frequency of parallel converters
序号幅频交点频率fosc a b c d
依据相位表达式(20),将和在交点频率处相位进行作差,然后进行化简,可得交点频率处的相位差正切值表达式为
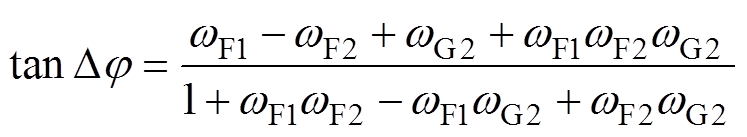 (24)
(24)
将表1变流器CONV1参数代入式(22)对应得到wF1,将表1变流器CONV2的参数分别代入式(22)和式(23)对应得到wF2和wG2。
将求得的交点频率代入式(24),若tanDj<0,则系统稳定;否则,系统不稳定。
当下垂控制Buck变流器CONV1和CONV2输出阻抗谐振频率存在偏差且谐振峰值越大时,它们的相位差就越大,并联系统越容易不稳定。由输出阻抗特征分析可得,其谐振频率主要取决于滤波电容Cf、电流调节器比例系数kpi等参数。
当变流器CONV1参数固定,变流器CONV2的电流调节器比例系数kpi2和滤波电容Cf2变化并确保其单独运行稳定时,将表1中其他参数代入表2中,变流器输出阻抗交点如表2中情况c所示,进而求解得到交点频率。在此基础上依据式(24)可得相位差正切值tanDj 关于kpi2/kpi1和Cf2/Cf1的曲面,如图17a所示。使图17a中的曲面与tanDj=0的平面相交,可得图17b中的系统临界稳定曲线。显然,该曲线的右下方对应的参数值会使系统不稳定,左上方对应的参数值会使系统稳定。所以电容相差越小,且当kpi1取值固定时,kpi2取值越大,系统更容易不稳定。
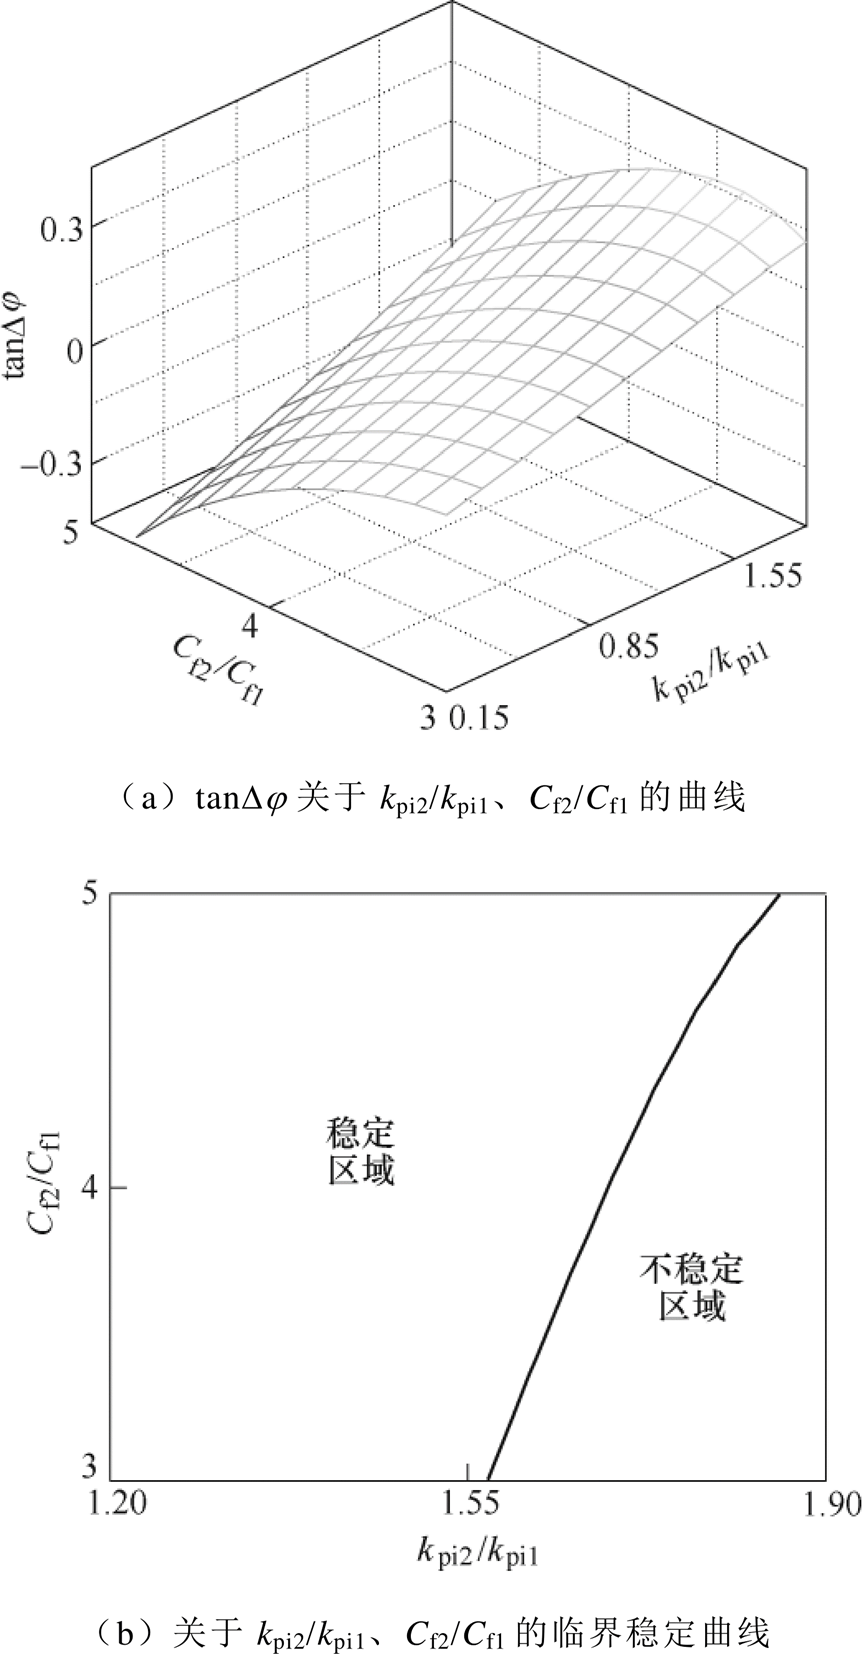
图17 kpi2/kpi1与Cf2/Cf1变化时并联系统稳定情况
Fig.17 Stability situation of parallel converters with Variation of ratios kpi2/kpi1 and Cf2/Cf1
依照图17,并将变流器CONV2的滤波电容Cf2设置为表1中对应取值,可得:当kpi2<0.095时,Dj <180 °,并联系统稳定;当kpi2=0.1时,Dj ≈ 181 °,并联系统不稳定,此时振荡频率为781 Hz。并联系统关于kpi的稳定边界见表3。
表3 并联系统关于kpi的稳定边界
Tab.3 Stability boundary regarding to kpi of parallel system

工况kpi2相位差Dj/(°) 10.05177 20.08178 30.09179 40.1181
上述已求得并联系统关于kpi2的稳定边界,接下来将对其进行实验验证。
为了对所提出的并联系统稳定边界进行实验验证,搭建了两个Buck变流器并联的实验平台,实验平台如图18所示。
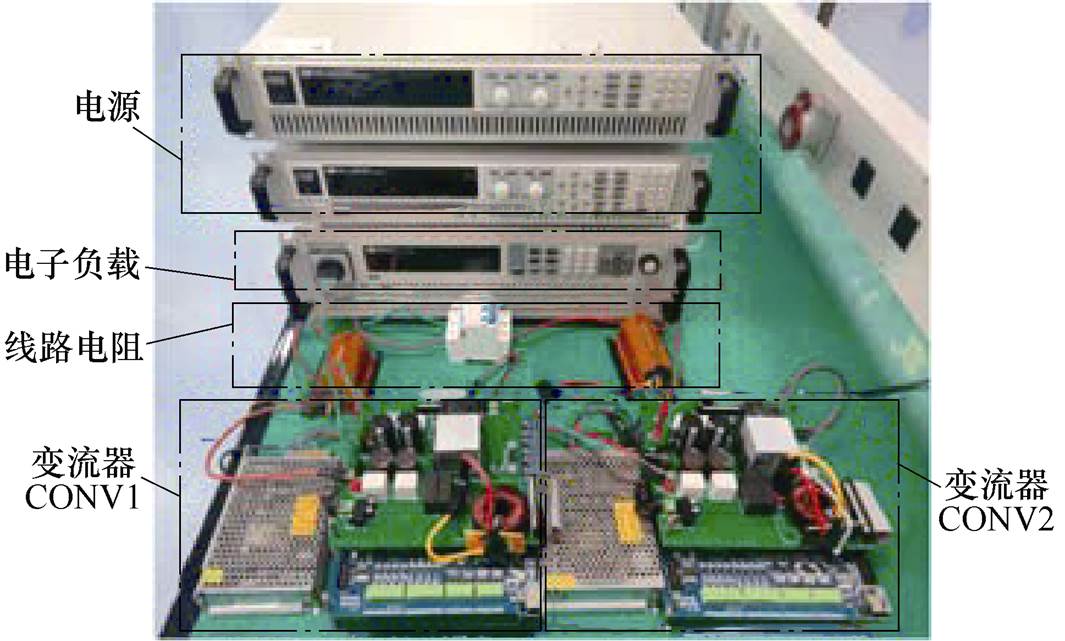
图18 Buck变流器并联系统实验平台
Fig.18 Experimental platform for the parallel Buck converters
两台变流器分别单独运行,对应参数值见表1,端口输出参考电压值为15 V,电流负载为2 A。其时域波形如图19所示,可以看出此时直流电压能控制在15 V,变流器单独运行稳定。
图20a和图20b给出了稳定情况下并联系统的时域波形,端口输出参考电压值为15 V,电流负载为2 A。然后增大kpi2到0.09和0.1,如图20c和图20d所示,并联系统由稳定变为不稳定,直流电压开始振荡,振荡频率为780 Hz。
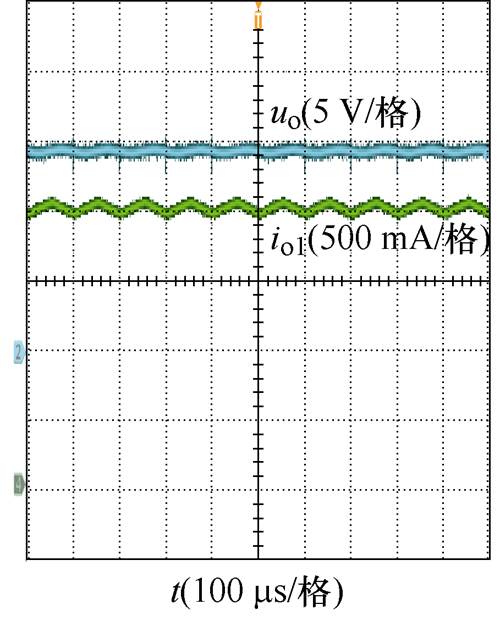
(a)CONV1
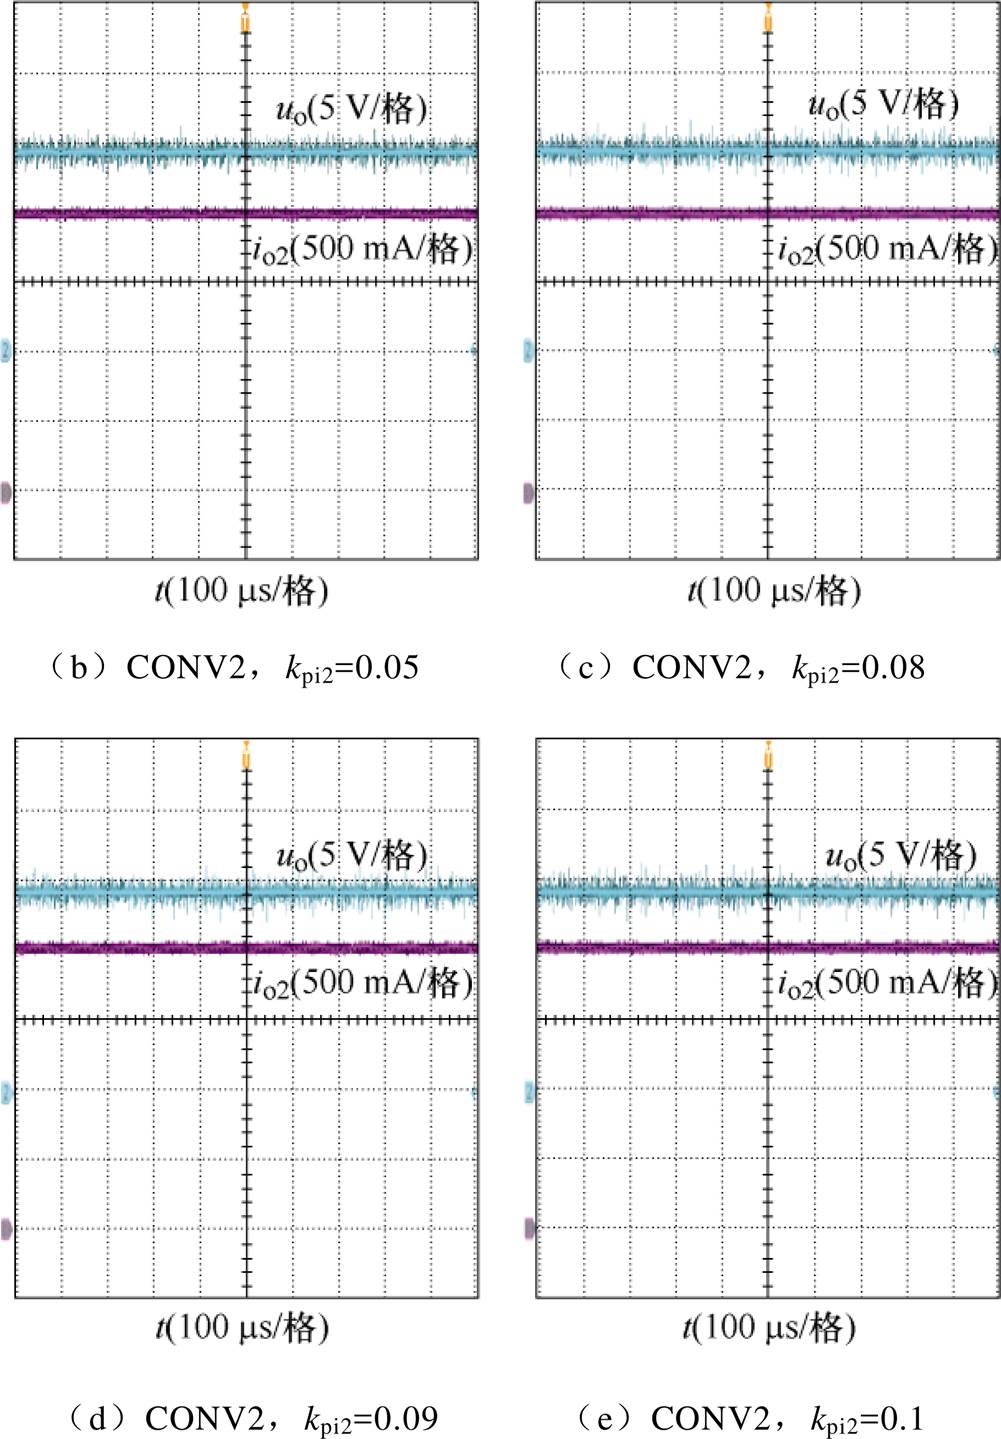
图19 各变流器单独运行时的实验波形
Fig.19 Experimental waveforms of individual converters operate standalone
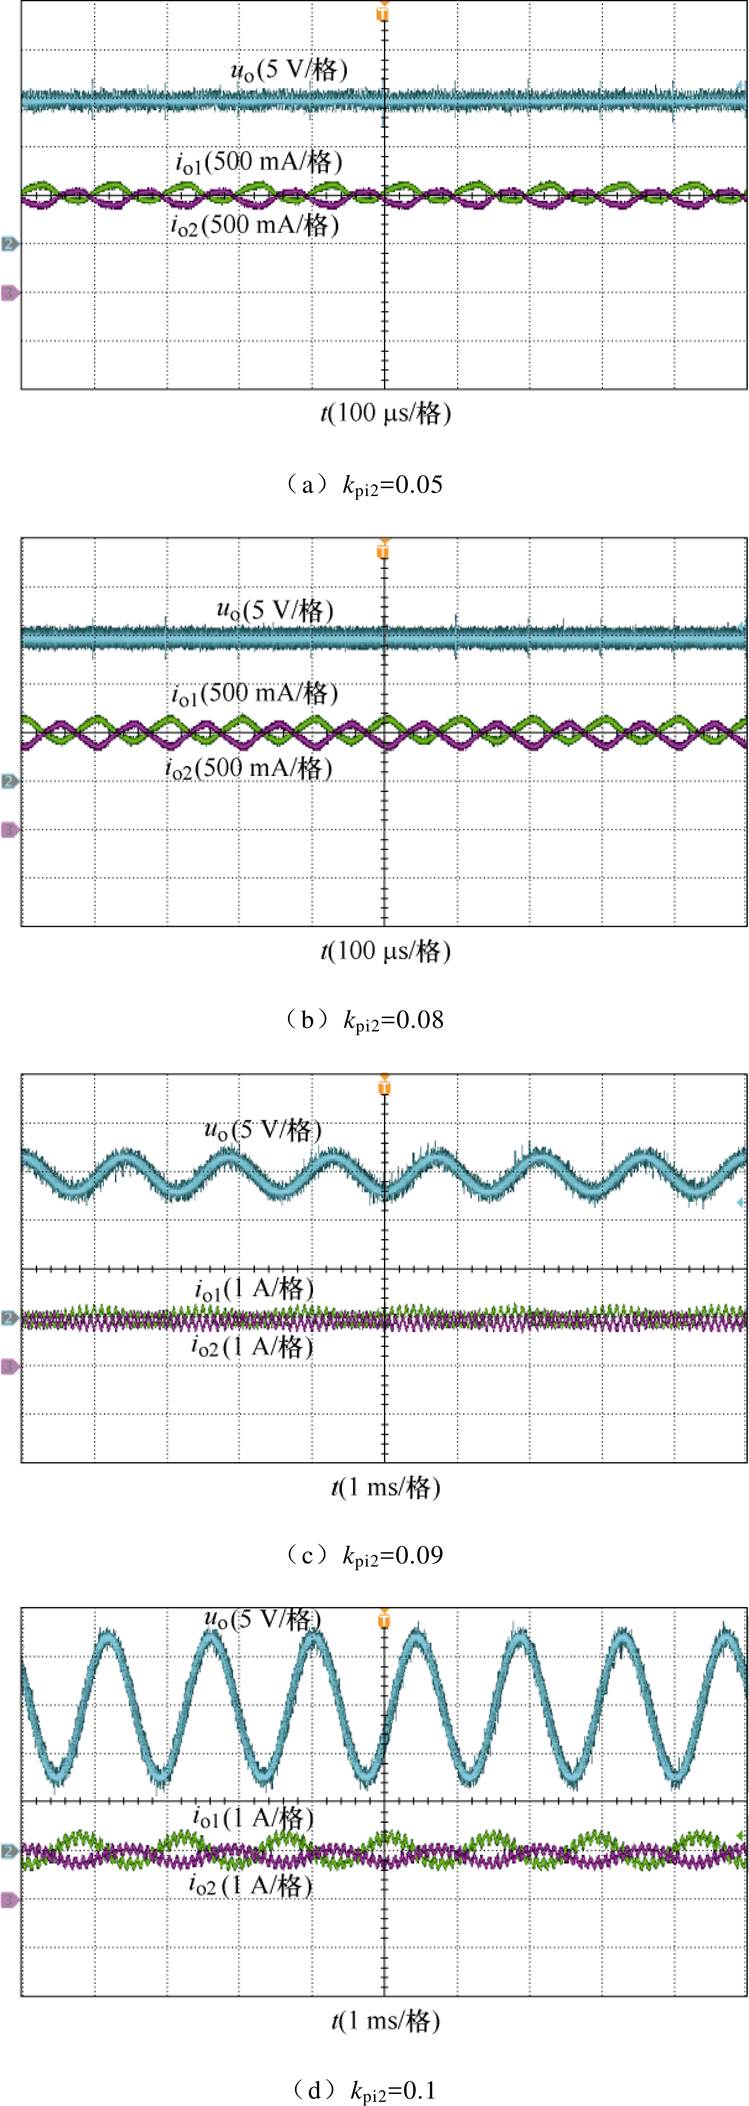
图20 不同工况下并联系统实验波形
Fig.20 Experimental waveforms of parallel converters under different working conditions
考虑实验平台与理论分析参数之间存在的细微差异,临界稳定时kpi2的理论值与实验值也存在细微差异,但规律趋势吻合,且误差在可接受范围内,因此振荡频率与理论分析基本一致,验证了所提振荡机理及稳定边界的正确性。
本文以直流微电网中下垂控制Buck变流器并联系统为研究对象,聚焦Buck变流器之间差异对并联系统稳定性的影响。首先,本文建立了单台下垂控制输出阻抗的小信号模型,进而通过分析发现,输出阻抗幅频存在谐振峰,在谐振峰频率处相位出现跳变,且该频率主要受电流调节器比例系数、滤波电容、滤波电感等关键参数影响。其次,本文结合基于变流器输出阻抗的并联系统稳定性分析方法,依据以上输出阻抗特征揭示了电流调节器比例系数kpi等关键参数不一致时导致输出阻抗幅频曲线谐振峰偏移引发系统振荡的机理。该振荡机理同样适用于三台及以上下垂控制Buck变流器并联系统稳定性分析。最后,本文对输出阻抗进行简化,得到其分段解析式,进而提出了关于变流器关键参数变流器并联系统稳定边界,硬件实验验证了理论分析的正确性。本文提出的下垂并联系统振荡机理及稳定边界为直流微电网系统稳定性分析和设计提供重要理论依据。
参考文献
[1] 宋强, 赵彪, 刘文华, 等. 智能直流配电网研究综述[J]. 中国电机工程学报, 2013, 33(25): 9-19, 5.
Song Qiang, Zhao Biao, Liu Wenhua, et al. An overview of research on smart DC distribution power network[J]. Proceedings of the CSEE, 2013, 33(25): 9-19, 5.
[2] 杨新法, 苏剑, 吕志鹏, 等. 微电网技术综述[J]. 中国电机工程学报, 2014, 34(1): 57-70.
Yang Xinfa, Su Jian, Lü Zhipeng, et al. Overview on micro-grid technology[J]. Proceedings of the CSEE, 2014, 34(1): 57-70.
[3] 滕昌鹏, 王玉斌, 周博恺, 等. 含恒功率负载的直流微网大信号稳定性分析[J]. 电工技术学报, 2019, 34(5): 973-982.
Teng Changpeng, Wang Yubin, Zhou Bokai, et al. Large-signal stability analysis of DC microgrid with constant power loads[J]. Transactions of China Elec- trotechnical Society, 2019, 34(5): 973-982.
[4] 刘宿城, 李中鹏, 刘晓东, 等. 直流微网中下垂控制稳定性及灵敏度分析[J]. 电气自动化, 2019, 41(1): 16-18, 50.
Liu Sucheng, Li Zhongpeng, Liu Xiaodong, et al. Analysis of stability and sensitivity of droop control in the DC micro-grid[J]. Electrical Automation, 2019, 41(1): 16-18, 50.
[5] 支娜, 张辉, 肖曦, 等. 分布式控制的直流微网系统级稳定性分析[J]. 中国电机工程学报, 2016, 36(2): 368-378.
Zhi Na, Zhang Hui, Xiao Xi, et al. System-level stability analysis of DC microgrid with distributed control strategy[J]. Proceedings of the CSEE, 2016, 36(2): 368-378.
[6] 施婕, 郑漳华, 艾芊. 直流微电网建模与稳定性分析[J]. 电力自动化设备, 2010, 30(2): 86-90.
Shi Jie, Zheng Zhanghua, Ai Qian. Modeling of DC micro-grid and stability analysis[J]. Electric Power Automation Equipment, 2010, 30(2): 86-90.
[7] 朱晓荣, 李铮, 孟凡奇. 基于不同网架结构的直流微电网稳定性分析[J]. 电工技术学报, 2021, 36(1): 166-178.
Zhu Xiaorong, Li Zheng, Meng Fanqi. Stability analysis of DC microgrid based on different grid structures[J]. Transactions of China Electrotechnical Society, 2021, 36(1): 166-178.
[8] 杨道培, 丁志刚, 曹炜. 基于下垂控制的直流微电网小扰动稳定性分析[J]. 电气技术, 2015, 16(7): 20-26.
Yang Daopei, Ding Zhigang, Cao Wei. Small signal stability analysis of DC micro-grid based on droop control[J]. Electrical Engineering, 2015, 16(7): 20-26.
[9] 郭力, 冯怿彬, 李霞林, 等. 直流微电网稳定性分析及阻尼控制方法研究[J]. 中国电机工程学报, 2016, 36(4): 927-936.
Guo Li, Feng Yibin, Li Xialin, et al. Stability analysis and research of active damping method for DC microgrids[J]. Proceedings of the CSEE, 2016, 36(4): 927-936.
[10] Li Xialin, Guo Li, Zhang Shaohui, et al. Observer- based DC voltage droop and current feed-forward control of a DC microgrid[J]. IEEE Transactions on Smart Grid, 2018, 9(5): 5207-5216.
[11] 黄远胜, 刘和平, 苗轶如, 等. 基于并联虚拟电阻的级联DC-DC变换器稳定控制方法[J]. 电工技术学报, 2020, 35(18): 3927-3937.
Huang Yuansheng, Liu Heping, Miao Yiru, et al. Cascaded DC-DC converter stability control method based on paralleling virtual resistor[J]. Transactions of China Electrotechnical Society, 2020, 35(18): 3927-3937.
[12] 黄旭程, 刘亚丽, 陈燕东, 等. 直流电网阻抗建模与振荡机理及稳定控制方法[J]. 电力系统保护与控制, 2020, 48(7): 108-117.
Huang Xucheng, Liu Yali, Chen Yandong, et al. Impedance-based modeling, stability analysis and virtual damping approach in DC grid[J]. Power System Protection and Control, 2020, 48(7): 108- 117.
[13] 彭方成, 范学鑫, 王瑞田, 等. 大容量DC-DC变流器输出阻抗特性分析及应用[J]. 电工技术学报, 2021, 36(16): 3422-3432.
Peng Fangcheng, Fan Xuexin, Wang Ruitian, et al. Analysis and application of output impedance characteristics of high-capacity DC-DC converter[J]. Transactions of China Electrotechnical Society, 2021, 36(16): 3422-3432.
[14] 姚雨迎, 张东来, 徐殿国. 级联式DC/DC变换器输出阻抗的优化设计与稳定性[J]. 电工技术学报, 2009, 24(3): 147-152.
Yao Yuying, Zhang Donglai, Xu Dianguo. Output impedance optimization and stability for cascade DC/DC converter[J]. Transactions of China Elec- trotechnical Society, 2009, 24(3): 147-152.
[15] Rashidirad N, Hamzeh M, Sheshyekani K, et al. High-frequency oscillations and their leading causes in DC microgrids[J]. IEEE Transactions on Energy Conversion, 2017, 32(4): 1479-1491.
[16] 李鹏飞, 郭力, 王洪达, 等. 直流微电网高频振荡稳定问题的降阶建模及分析[J]. 电力自动化设备, 2021, 41(5): 65-72.
Li Pengfei, Guo Li, Wang Hongda, et al. Reduced- order modeling and analysis of high-frequency oscillation stability in DC microgrid[J]. Electric Power Automation Equipment, 2021, 41(5): 65-72.
[17] 刘春喜, 陈鹏荣, 高姬, 等. 中频逆变器数字控制延时的线性化近似[J]. 电源学报, 2015, 13(3): 55-61.
Liu Chunxi, Chen Pengrong, Gao Ji, et al. An approximation method of digital control delay in inverter[J]. Journal of Power Supply, 2015, 13(3): 55-61.
[18] 沈传文, 肖国春, 于敏. 自动控制理论[M]. 西安: 西安交通大学出版社, 2007.
[19] 侯丹. 基于阻抗测量的多模块互联电力电子系统稳定性分析与判断[D]. 西安: 西安交通大学, 2010.
[20] 邵京一, 邵钟武. 波特图折线近似法的改进[J]. 华东石油学院学报, 1984, 81(1): 118-125.
Shao Jingyi, Shao Zhongwu. An improved broken- line approximation method of Bode diagram[J]. Journal of China University of Petroleum, 1984, 81(1): 118-125.
Analysis of Oscillation Mechanism and Stability Boundary of Droop-Controlled Parallel Converters Based on Output Impedances of Individual Converters in DC Microgrids
Abstract DC microgrids are of great significance for fully using renewable energy and actively responding to the carbon peaking and carbon neutrality goals. In DC microgrids, power electronics converters are usually connected to the electrical power generation units and the DC bus. These converters interact with each other through parallel connections, which increases the instability risk of the system. However, existing research regarding the system stability of DC microgrids only focuses on the influence of the interaction between the source subsystem and the load subsystem. It does not consider the difference among parallel converters in the source subsystem and thus ignores the influence of the difference among the source converters on the system stability. The difference among the source converters will cause the difference in their output impedances, which will introduce the system oscillation. Therefore, this paper focuses on the influence of the interaction among the Buck converters on the system stability, analyzes the oscillation mechanism of the parallel converters, and proposes a solution for the stability boundary.
Firstly, the small-signal model of the output impedance of the single Buck converter under droop control is established in this paper, and the accuracy of the output impedance is verified by the frequency sweep in SABER. Secondly, the controller, main circuit, and parasitic parameters are analyzed to the output impedance model established, revealing the oscillation mechanism of the droop-controlled Buck converters in parallel. Thirdly, through qualitative analysis, the output impedance is further simplified. Fourthly, the stability boundary regarding the key parameters of the parallel converters is calculated by combining the oscillation mechanism revealed and the stability criterion. Finally, the experimental platform of parallel Buck converters is built to verify the correctness and effectiveness of the theoretical analysis.
The experimental results of the parallel converters show that when the proportional coefficient kpi2 is less than 0.09, the time domain waveform of the parallel converters is stable. Then increase the proportional coefficient kpi2 to 0.09 and 0.1, the output voltage oscillates, and the parallel system becomes unstable. The oscillation period is 1.3 ms, corresponding to the theoretical analysis of 781 Hz. Due to the slight difference between the parameters of the experimental platform and the theoretical analysis, the theoretical value of kpi2 is also slightly different from the experimental value when it is critically stable. However, the error is within an acceptable range, and the oscillation frequency is consistent with the theoretical analysis, which verifies the effectiveness and correctness of the proposed oscillation mechanism and stability boundary.
The following conclusions can be drawn. This paper takes the parallel droop-controlled Buck converters as the research object, and the influence of the difference among Buck converters on the system stability is investigated. The output impedance of the Buck converter is characterized as follows. The amplitude-frequency curve has a resonance peak, and a phase mutation appears at the resonance peak frequency. The resonance peak frequency is mainly affected by key parameters such as the filter inductance Lf, the filter capacitor Cf and the current controller proportional coefficient kpi. The mechanism of system oscillation is revealed when the key parameters, including filter inductances Lf and current controller parameters kpi, of the converters are inconsistent and cause the phase difference between the output impedance of converters at the intersection frequency of amplitude-frequency curves exceeds 180 °. Finally, a segmented analytical formula of the output impedance and the stability boundary of the key parameters of the system is proposed. The experiments verify the correctness of the theoretical analysis.
keywords:Droop control, output impedance, parallel converters system, stability boundary
DOI: 10.19595/j.cnki.1000-6753.tces.220363
中图分类号:TM46
国家重点研发计划资助项目(2018YFB1503101)。
收稿日期 2022-03-14
改稿日期 2022-09-22
王晴 女,1997年生,硕士,研究方向为直流微网小信号建模与稳定性分析。E-mail: 1576550782@qq.com
刘 增 男,1984年生,副教授,博士生导师,研究方向为分布式发电系统中储能变流器并联与并网控制、交直流电力电子系统小信号建模与稳定性分析、大容量隔离型直流变流系统设计与高性能控制。E-mail: zengliu@xjtu.edu.cn(通信作者)
(编辑 陈 诚)