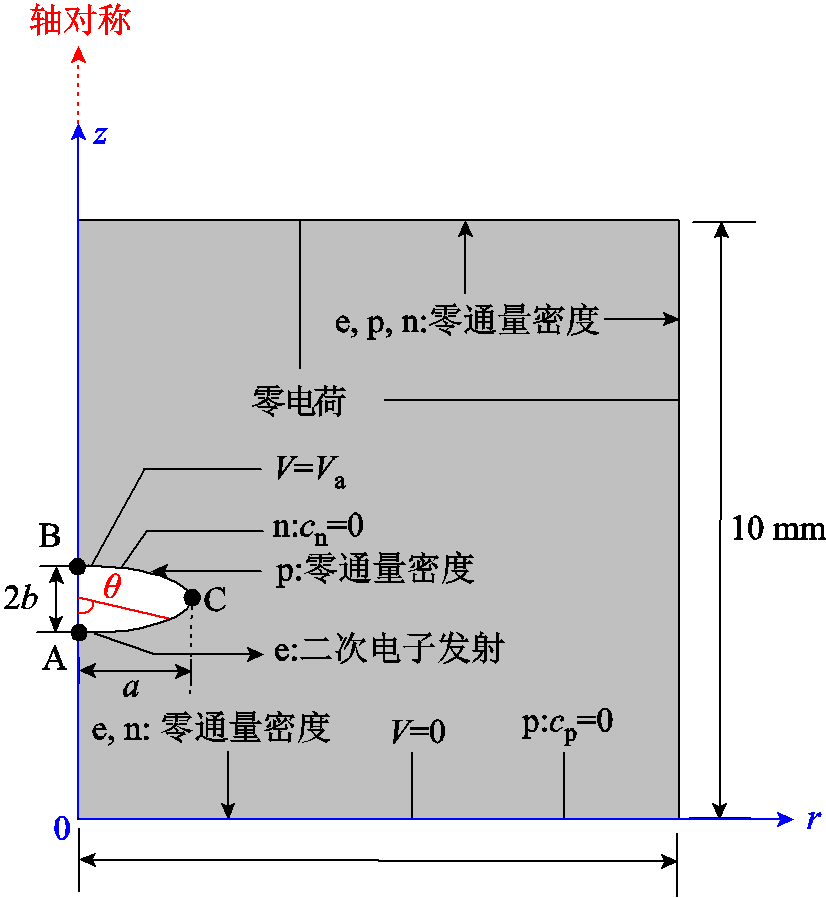
图1 仿真模型及其边界条件
Fig.1 Simulation model and its boundary conditions
摘要 电晕放电的研究对深入理解高压电气设备内部各种缺陷的电晕放电机理有着重要的意义。耦合流体动力学方程和泊松方程,建立了椭球电极的负电晕放电模型,应用有限元方法分析了放电电流脉冲和正离子数密度分布,首次通过数值仿真分析了椭球电极环模式放电。研究了不同施加电压及电极形状对椭球电极负电晕放电的影响机理。结果表明,施加的电压、电极形状对椭球电极负电晕放电电流脉冲数、脉冲波形特性及放电脉冲模式等有很大的影响。
关键词:负电晕放电 放电模式 数值仿真小椭球电极
随着输电距离的增加[1-2]及输电线路电压等级的提高,电力系统对输电设备绝缘性能的要求也在逐渐提高[3-4]。电晕放电是一种常见的局部放电,可能出现在变压器、断路器、气体绝缘开关设备(Gas Insulated Switchgear, GIS)等重要的输电设备中,对设备的绝缘性能造成严重损坏[5-7]。及时掌握电晕放电特性有利于电气设备的安全稳定运行[8]。因此,对电晕放电的研究,尤其是对其特性和机理的研究有非常重要的意义。
电晕放电是一种发生在极不均匀电场中的自持放电[9-10]。电晕放电分为正电晕放电和负电晕放电,国内外学者对电晕放电做了大量研究。早在1939年,G. W. Trichel通过实验的方法研究了棒-板电极之间的负电晕放电电流,发现负电晕放电期间会出现电流振荡脉冲,并将这类脉冲命名为Trichel脉冲[11]。文献[12]中,作者通过实验观察了气体混合物中不同气体成分在负电晕放电中的作用。徐建源等通过实验和有限元的方法研究分析了针-板电极下SF6气体的电晕放电特性[13]。文献[14]中,作者通过实验获得的粒子图像,探索了离子风与不同放电模式之间的关系。文献[15]中,作者首次提出基于流体动力学模型和泊松方程对空气中的电晕放电进行理论研究。在文献[16]中,作者通过数值仿真的方法研究了不同曲率半径下针-板电极的负电晕放电。文献[17]中,作者通过数值仿真的方法研究了小型球形电极负电晕放电的机理。文献[18-19]中,作者通过数值仿真的方法研究了不同形状尖端电极的负电晕放电机理。
上述文献并没有针对小型椭球形电极的负电晕放电的研究。然而,这类电晕放电对电气设备的绝缘性能也有较大的危害。例如带电的微粒污染物在变压器等电气设备的高压腔内运动可能会产生电晕放电甚至击穿放电,现实中,这类带电微粒很少有规则的球状,因此,本文对小型椭球形电极的负电晕放电进行了研究。由于这类椭球形电极体积很小,引线可能会影响其附近的电场分布,这类电极电晕放电的特性和机理难以通过实验的方法进行研究。本文通过数值仿真模型对椭球形电极的负电晕放电进行研究。
本文使用二维轴对称仿真模型对椭球电极的负电晕放电进行研究。仿真模型及其边界条件如图1所示。图1所示模型的仿真区域是一个边长为10 mm的方形空气域。仿真域的底部是一个半径为10 mm的接地平面电极。椭球电极位于接地电极正上方3.3 mm处,即A点到接地电极的距离(间隙距离)为3.3 mm。在图1中,e代表电子,p代表正离子,n代表负离子,cn为负离子浓度,cp为正离子浓度,Va为施加电压,a和b为椭球电极的几何尺寸。
图1 仿真模型及其边界条件
Fig.1 Simulation model and its boundary conditions
在图1中,边界条件“零通量密度”表示为
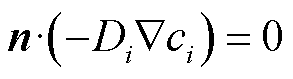 (1)
(1)
式中,i代表带电粒子,包括电子、正离子和负离子; 为带电粒子i的扩散系数;
 为带电粒子i的浓度;
 代表Nabla算子;
 为垂直于边界面指向外的法向单位矢量。
边界条件“二次电子发射”表示为
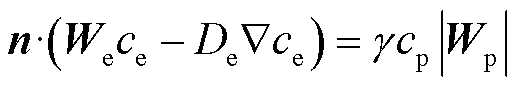 (2)
(2)
式中, 为电子迁移速度的矢量;
 为正离子的迁移速度矢量;
 为二次电子发射系数,根据文献[20],取=0.004。
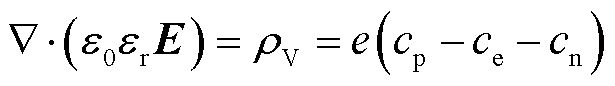
边界条件“零电荷”表示为
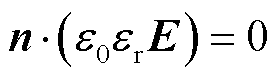 (3)
(3)
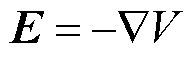
式中, 为真空中的介电常数;
 为相对介电常数;
 为电场强度矢量。
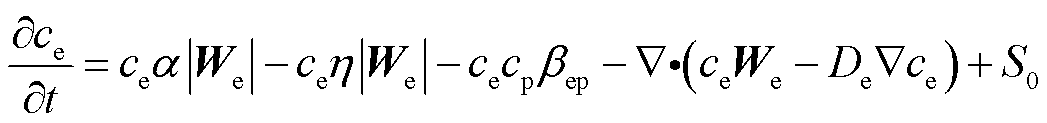
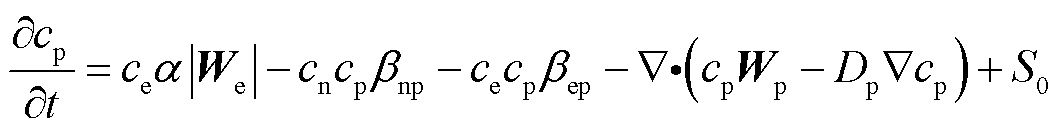
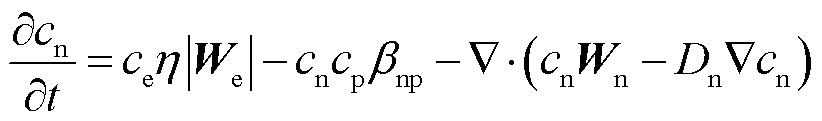
由于光电离对所研究问题的影响较小[21-22],因此,本模型通过流体动力学方程与泊松方程的耦合来描述大气等离子体的输运过程。模型的控制方程为
 (4)
(4)
 (5)
(5)
 (6)
(6)
 (7)
(7)
 (8)
(8)
式中,t为时间;α和η分别为电离系数和附着系数; 为电子和正离子之间的复合系数;
 为负离子和正离子之间的复合系数;e为电子的电荷量;V为电位;
 为自然电离产生的电子与正离子的速率;其他参数的含义与式(1)~式(3)中参数的含义相同。在本文所搭建的模型中,主要参数的值由文献[23-24]得到,具体结果见表1。
表1 模型参数值
Tab.1 Values of parameters of the model
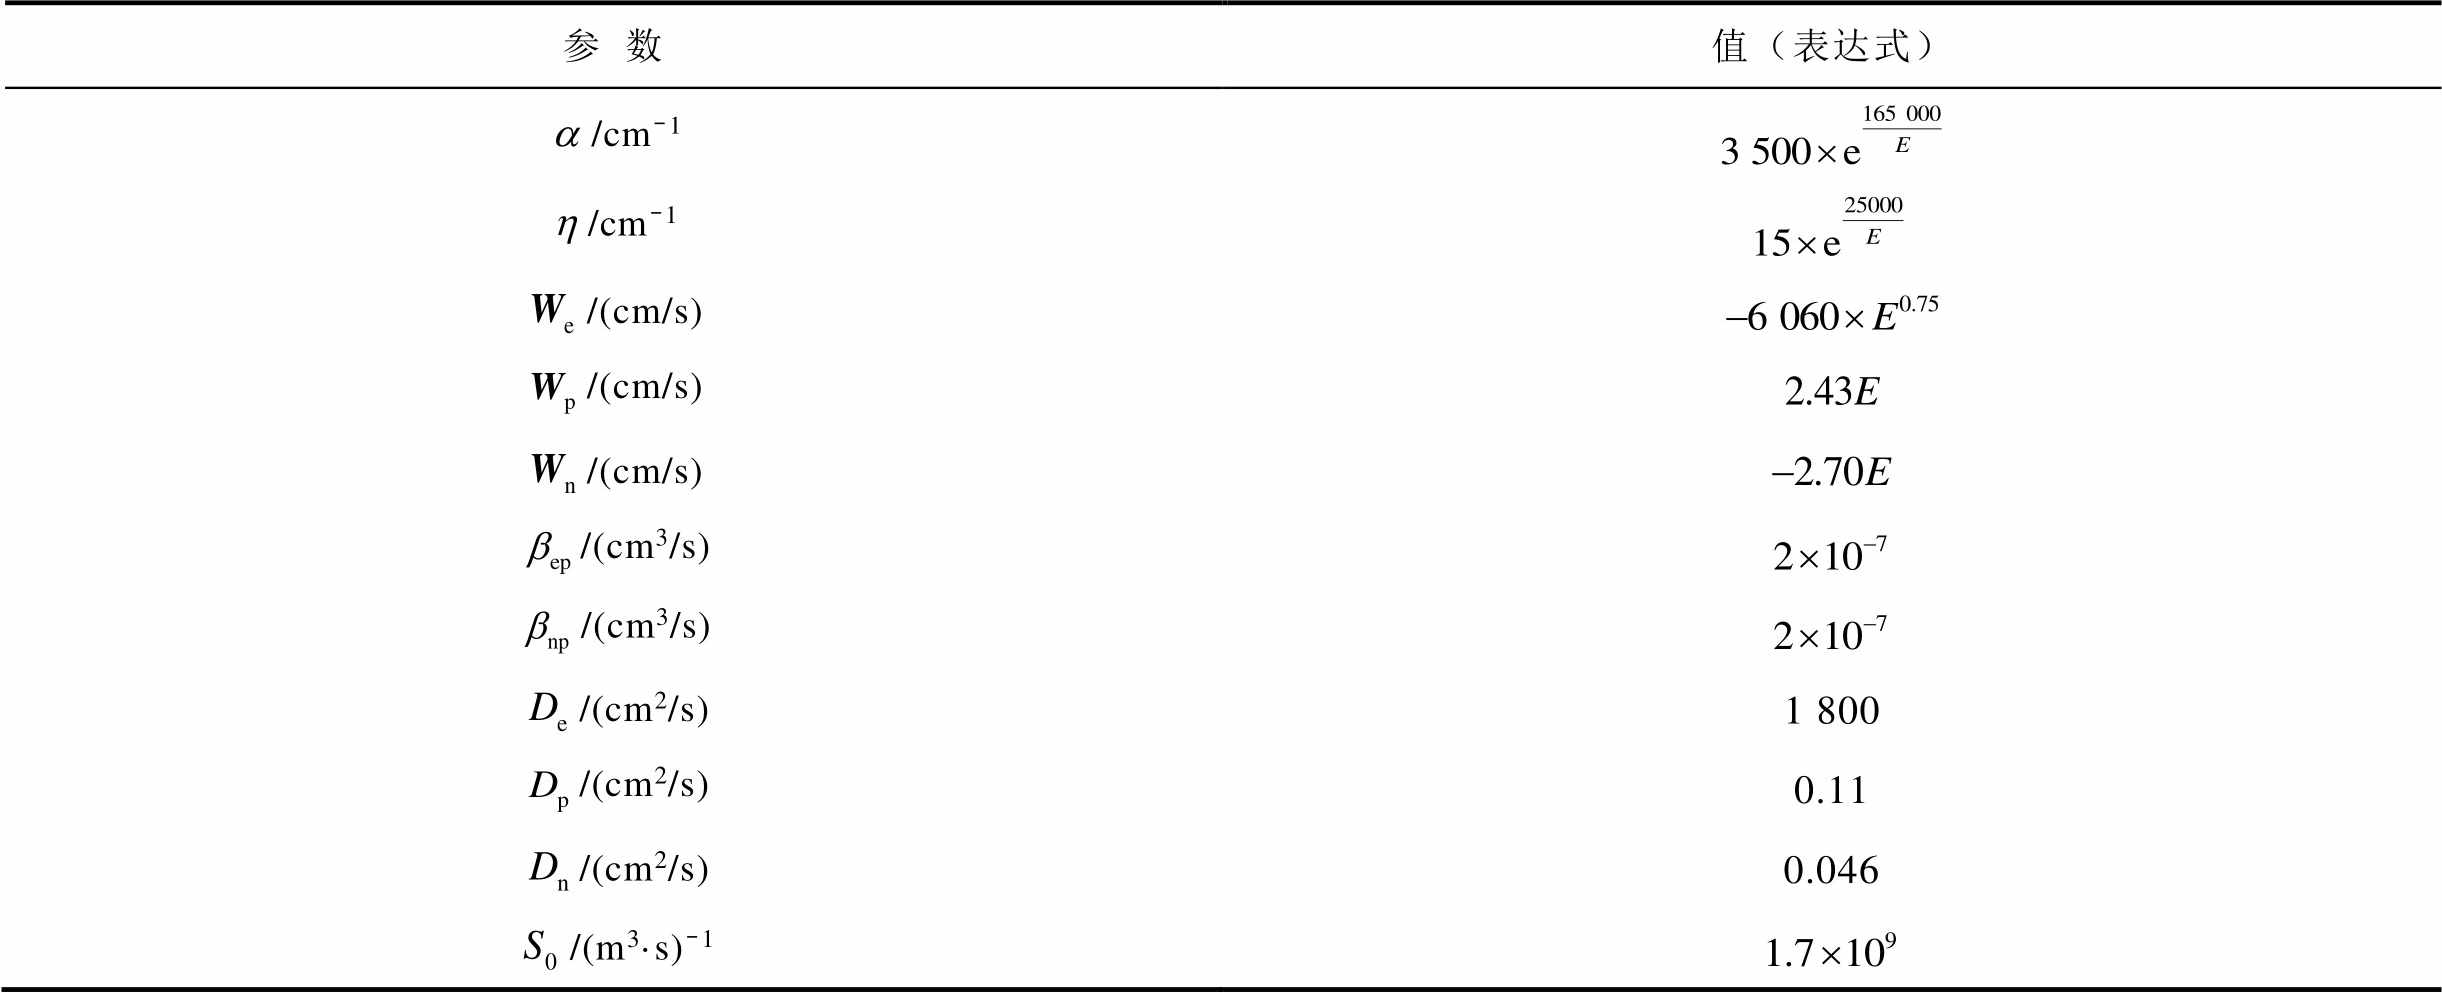
参数值(表达式) /cm-1 /cm-1 /(cm/s) /(cm/s) /(cm/s) /(cm3/s) /(cm3/s) /(cm2/s)1 800 /(cm2/s)0.11 /(cm2/s)0.046 /(m3·s)-1
负离子的初始密度为零。假设电子和正离子的初始密度分布满足峰值cmax为1016 m-3,宽度s为25 μm的高斯分布[25],即
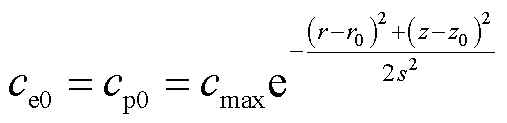 (9)
(9)
式中,(r0,z0)为图1中A点的坐标。
负电晕放电期间的电流可由式(10)计算得到。
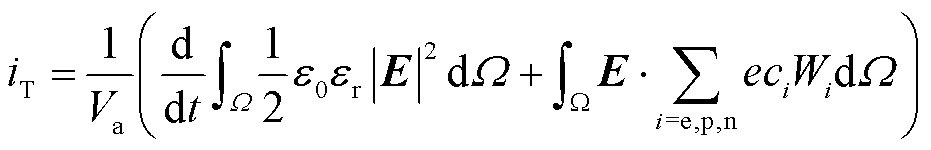 (10)
(10)
式中, 为负电晕放电电流;
 为施加在椭球电极的电压。
以上公式均通过有限元方法求解。在仿真过程中,假设环境条件:室温为300 K、1个标准大气压。不考虑温度、湿度等因素对放电的影响。
图1所示,θ为角度,假设椭球电极两半轴a和b长度分别为0.35 mm和0.25 mm,对其施加直流电压,椭球电极电位为-4.2 kV。在20 000 ns的时间内,负电晕放电期间出现的电流脉冲如图2所示。图2中各个脉冲上方的数字为该脉冲的编号,注释为各个脉冲电流出现位置所对应的椭球电极的角度。
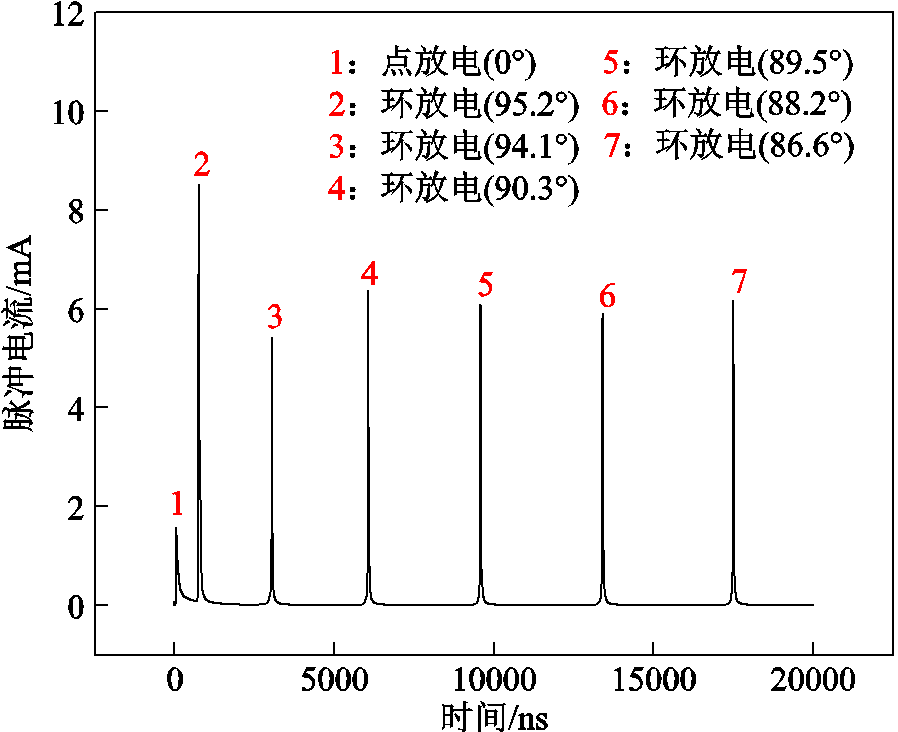
图2 负电晕放电期间出现的电流脉冲
Fig.2 Current pulses during negative corona discharge
根据文献[26-27],电晕放电是在点模式和环模式之间切换的。发生在图1所示A点或B点的电晕放电为点模式放电,发生在A点和B点之间的电晕放电为环模式放电。
由图2可知,上述研究的椭球电极(a=0.35 mm,b=0.25 mm)的负电晕放电期间,只有电流脉冲1是出现在椭球电极0°位置(A点)的点放电脉冲,其他电流脉冲都是出现在椭球电极90°位置(C点)附近的环放电脉冲。所有的环放电脉冲电流的幅值均大于点放电脉冲电流。
图3所示为电流脉冲1的波形。在15~54 ns之间,脉冲电流急剧升高,在54 ns时刻升高到峰值1.5 mA。在54~500 ns之间,脉冲电流先急剧下降,然后缓慢下降到0.1 mA并保持稳定。
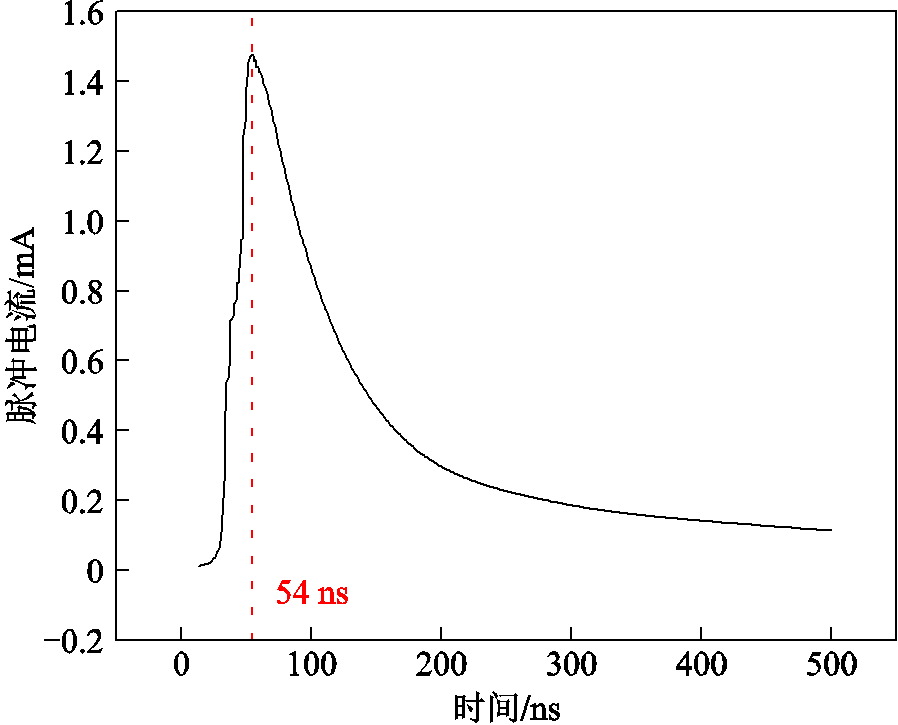
图3 电流脉冲1的波形
Fig.3 The waveform of current pulse 1
图4所示为电流脉冲1在不同时刻的正离子数密度的分布。图4a是电流脉冲1发生前的正离子数密度,图4b是电流脉冲1发生时的正离子数密度分布。图4c是电流脉冲1达到峰值时的正离子数密度分布。
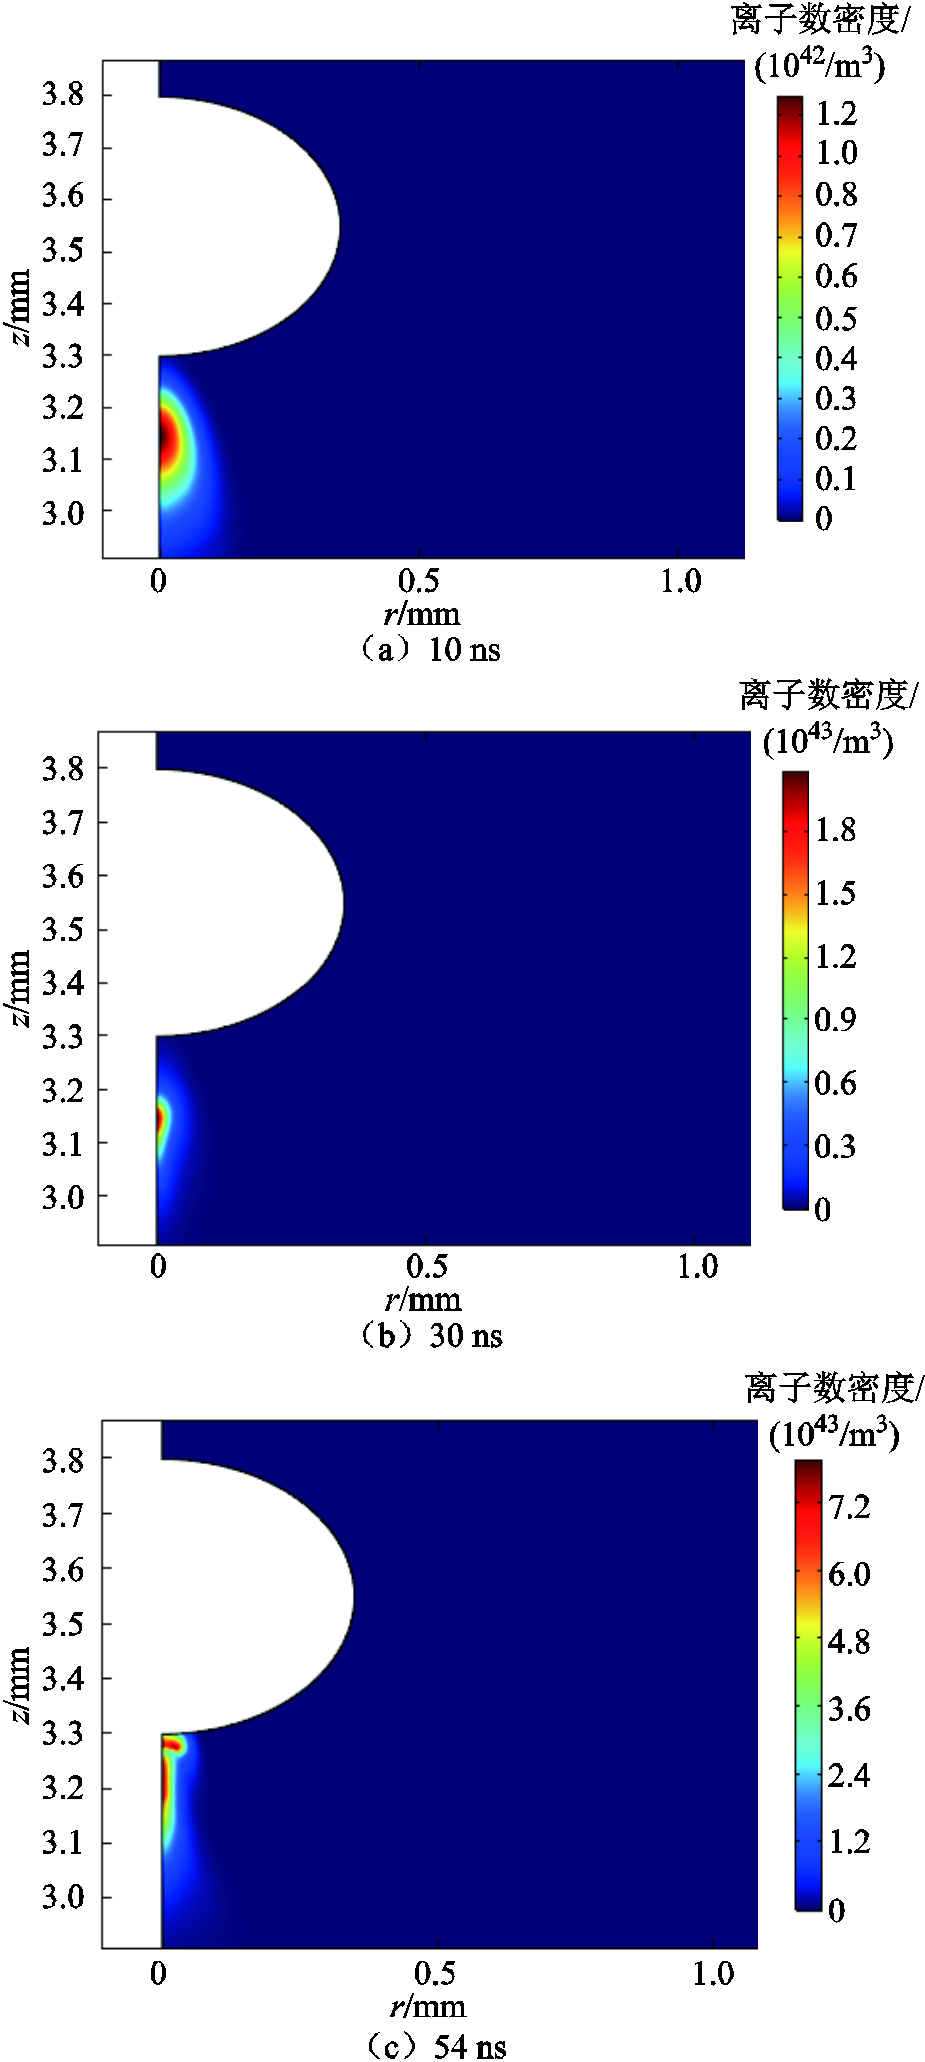
图4 电流脉冲1不同时刻正离子数密度的分布
Fig.4 The distribution of positive ion concentrations under different moments of the current pulse 1
如图4a所示,初始时刻的正离子大多都分布在椭球电极0°位置(A点)附近,并且比较集中。所以第一个放电脉冲发生在此位置。如图4b所示,随着电子崩的发展,正离子数密度在增大,电流脉冲也逐渐形成。如图4c所示,由于电子碰撞电离产生的正离子继续在椭球电极0°位置积聚,使该位置正离子浓度进一步增大,在放电脉冲电流达到幅值时,正离子数密度达到最大。所以,脉冲电流出现时,椭球电极0°位置附近正离子浓度远大于电流脉冲出现前该位置的正离子的浓度。
图5所示为电流脉冲2的波形。在700~760 ns之间,脉冲电流急剧升高,在760 ns时刻升高到峰值8.5 mA。在760~1 000 ns之间,脉冲电流先急剧下降,然后缓慢下降到0.1 mA并保持稳定。
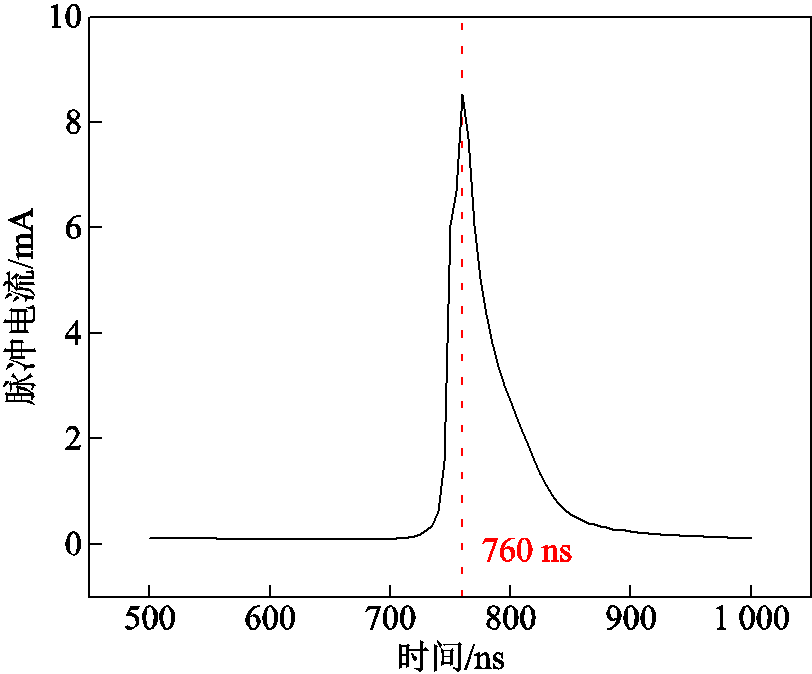
图5 电流脉冲2的波形
Fig.5 The waveform of current pulse 2
图6所示为脉冲电流2在不同时刻的正离子浓度的分布。图6a是脉冲电流2发生前的正离子浓度,图6b是脉冲电流2发生时的正离子浓度分布。图6c是脉冲电流2达到幅值时的正离子浓度分布。
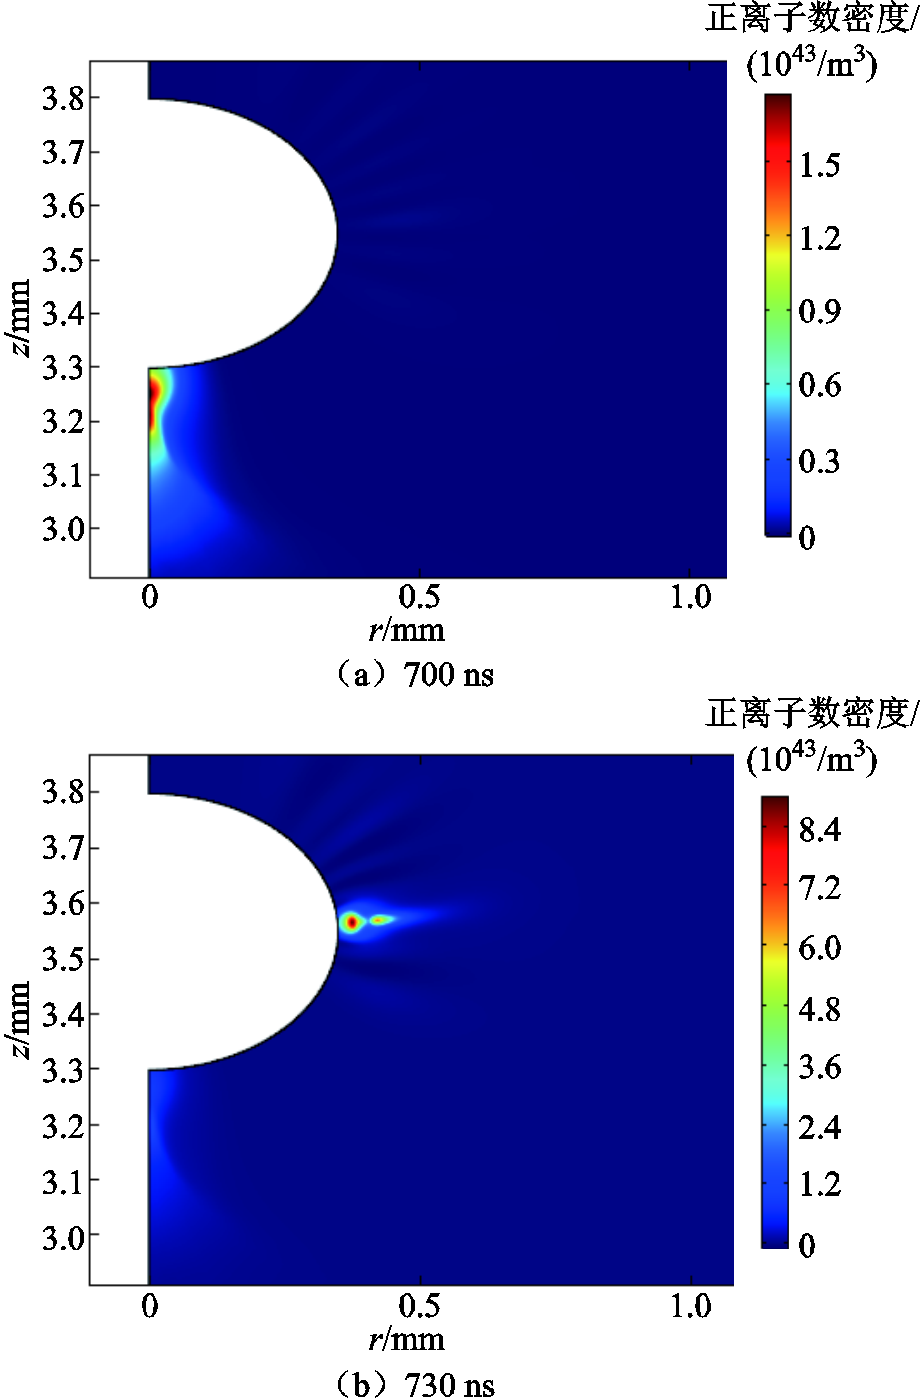
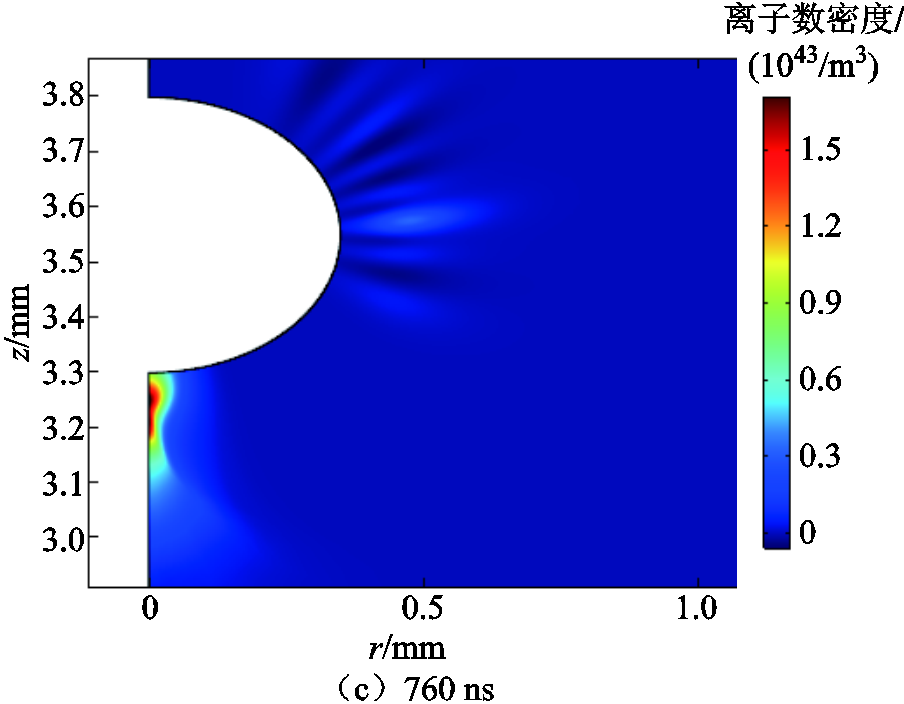
图6 电流脉冲2不同时刻正离子浓度的分布
Fig.6 The distribution of positive ion concentrations under different moments of the current pulse 2
如图6a所示,700 ns时刻的正离子集中分布在椭球电极0°位置(A点)附近。如图6b所示,730 ns时刻的正离子大多分布在椭球电极0°位置(A点)附近,少量的正离子分布在椭球电极90°位置(C点)附近,说明此时已有少部分正离子已经从A点扩散到了C点。如图6c所示,760 ns时刻的正离子大多分布在90°位置附近,并且比较集中,说明此时A点附近的正离子全部扩散到了C点。
图7所示为2号脉冲发生时椭球电极周边的电场强度。电流脉冲1结束后,在出现电流脉冲的A点附近负离子浓度很高,并且移动缓慢,使得椭球电极0°位置(A点)附近电场强度下降,从而抑制A点附近电子崩的形成,无法形成新的电流脉冲。而C点附近的电场强度在1号脉冲结束后逐渐增加,促进形成新的电子崩,最终导致在椭球电极92.8°位置形成2号环模式放电脉冲,因此760 ns时刻的正离子大多分布在90°位置附近,此时的电子、正离子是由新的电子崩产生。
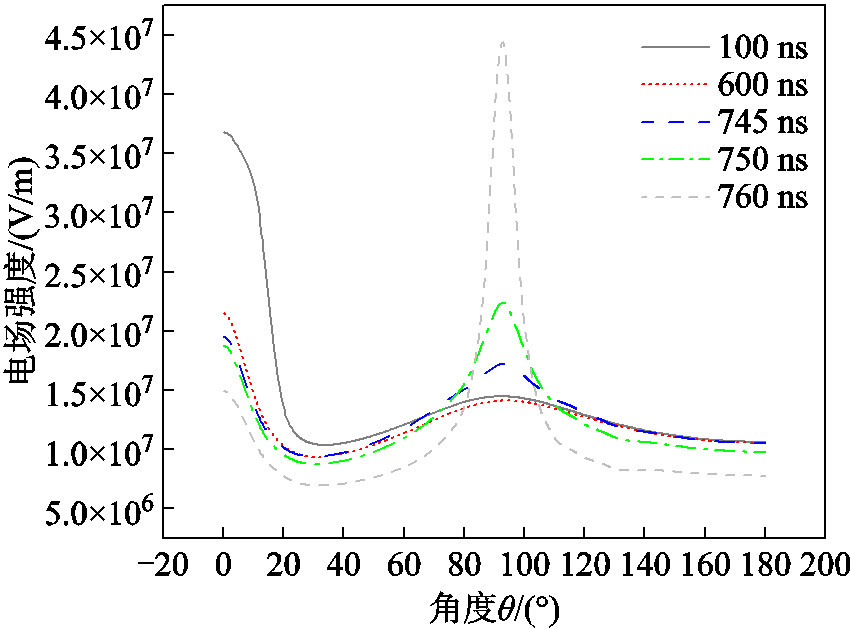
图7 不同时刻椭球电极附近电场强度分布
Fig.7 Electric field intensity distribution around the ellipsoid electrode under different moments
在了解了椭球电极的负电晕放电机理后,发现若改变施加在椭球电极上的电压和电极形状,可能都会影响椭球电极的负电晕放电。因此,为了更清楚地分析椭球放电的现象,有必要研究这两个参数对椭球放电的影响。
首先保持椭球电极形状不变,即a=0.35 mm, b=0.25 mm,分别将施加电压设置为3.6、3.7、3.9、4.1和4.2 kV,仿真时间为20 000 ns。图8所示为在不同施加电压下,椭球电极负电晕放电期间的第一个电流脉冲波形。图9所示为在不同施加电压下,椭球电极负电晕放电期间出现的总电流脉冲数和环放电脉冲数。
图8 不同施加电压下第一个脉冲的波形
Fig.8 Waveforms of the first pulse under different applied voltages
由图8可知,椭球电极的第一个电流脉冲的峰值随施加电压的增大而增大。并且,施加电压越高,脉冲出现的时刻越早。
由图9可知,同在20 000 ns的时间内,施加的直流电压越高,椭球电极负电晕放电期间出现的电流脉冲数越多。并且,对于上述研究的椭球电极(a=0.35 mm,b=0.25 mm),负电晕放电期间出现的点放电脉冲数只有一个,并且都是第一个电流脉冲。
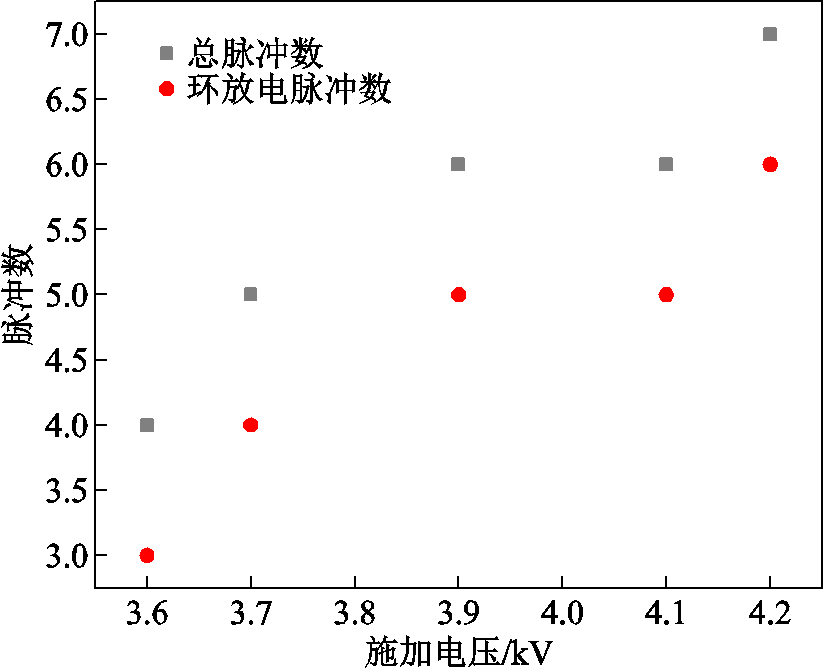
图9 不同施加电压下的电流脉冲数
Fig.9 Number of the current pulses under different applied voltages
通过以上分析可知,对同一椭球电极,改变施加电压对负电晕放电期间电流脉冲数量、峰值以及出现时刻都有较大影响,但是对负电晕放电模式的影响较小。
接着改变椭球电极的形状,在椭球电极半轴a和b长度分别为0.25 mm和0.35 mm(正好与之前的仿真设置相反),施加电压为-3.1 kV的情况下,椭球电极负电晕放电期间出现的脉冲电流如图10a所示。在椭球电极半轴a和b长度均为0.25 mm(半径为0.25 mm的球电极),施加电压为-3.6 kV的情况下,椭球电极负电晕放电过程中出现的电流脉冲如图10b所示。图10a和图10b的注释为各放电脉冲模式及其出现位置对应球电极的角度。对于不同半轴a和b的椭球电极,周边的初始电场强度分布如图11所示。
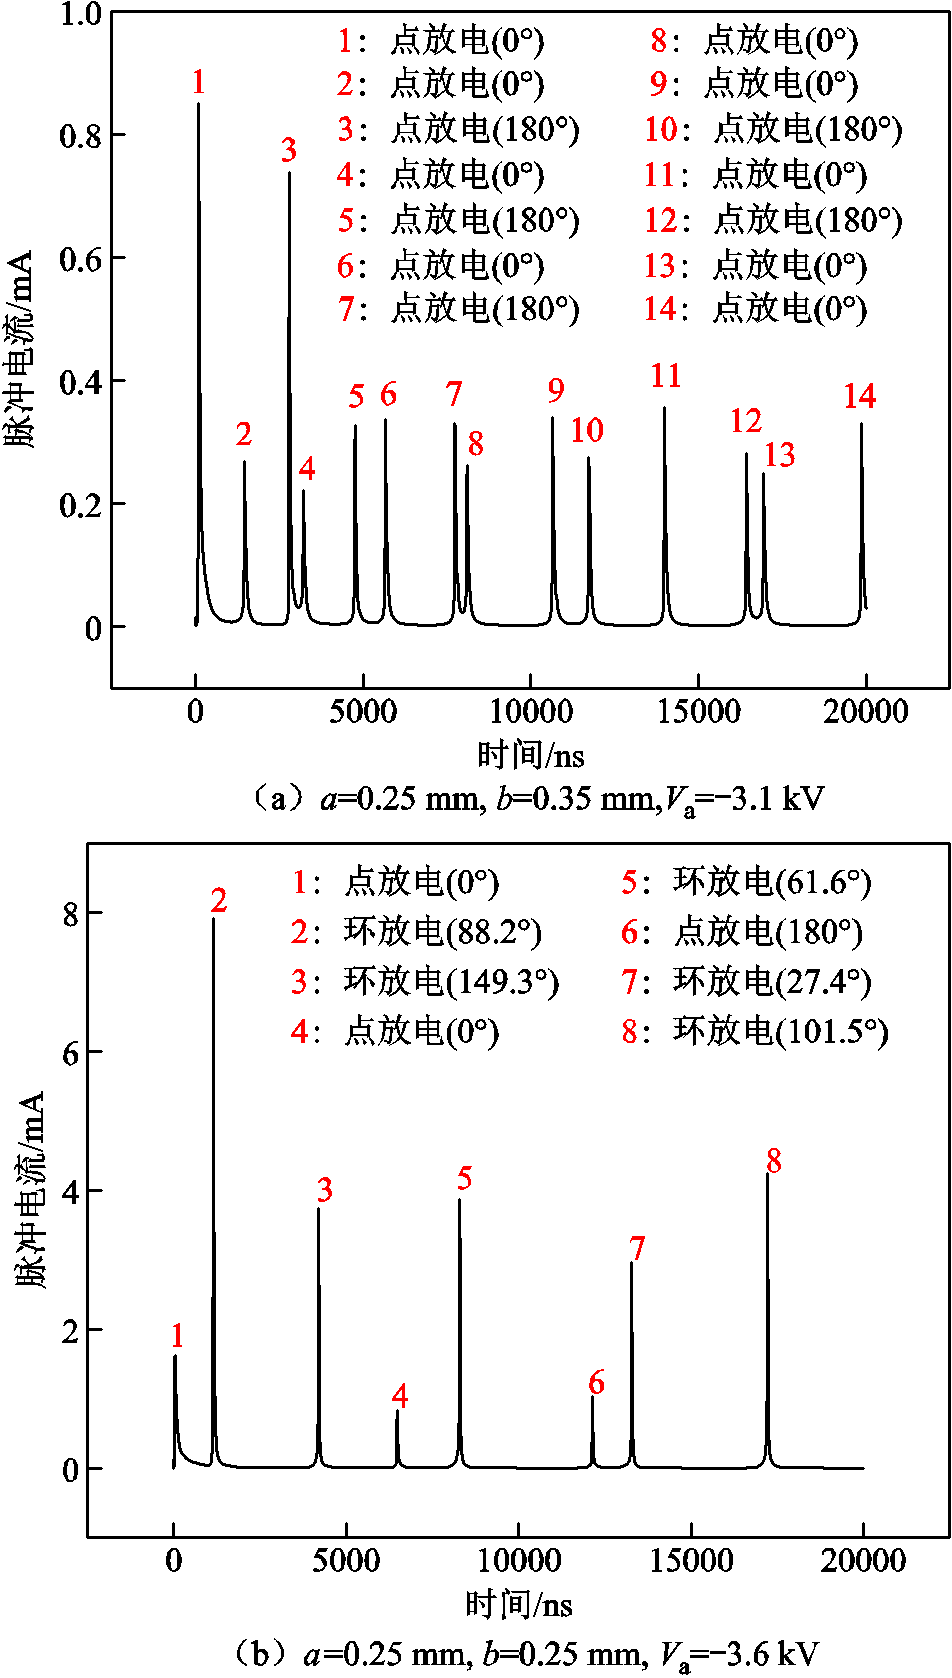
图10 负电晕放电期间出现的电流脉冲
Fig.10 Current pulses during negative corona discharge

图11 椭球电极周边初始电场强度分布
Fig.11 Initial electric field intensity distribution around the ellipsoid electrodes
由图10a可知,当椭球电极半轴a和b分别为0.25 mm和0.35 mm时,在20 000 ns的时间内,共发生了14个脉冲电流,并且所有的脉冲电流都发生在0°位置(A点)或180°位置(B点)。如图11所示,对于半轴a和b分别为0.25 mm和0.35 mm的椭球电极,其90°位置(C点)的初始电场强度最小,其0°位置(A点)和180°位置(B点)的初始电场强度较大。此外,由于椭球电极A点距离接地电极较近,所以,A点附近电场强度略大于B点附近电场强度。因此,电流脉冲均出现在椭球电极0°位置(A点)和180°位置(B点)附近,并且A点出现电流脉冲的概率略大于B点。
由图10b所示,当椭球电极半轴a和b都为0.25 mm时,椭球电极变成了球电极,在20 000 ns时间内,共发生8个脉冲电流,并且出现的位置是随机的。如图11所示,对于半径为0.25 mm的球电极,其周围的初始电场强度分布比较均匀。此外,由于从0°位置(A点)到180°位置(B点),球电极表面到接地电极的距离逐渐增大,因此,电场强度逐渐缓慢减小。所以,球形电极电流脉冲出现位置的分布比较随机,但电流脉冲出现在球电极下半球(球电极小于90°的位置)概率略大于出现在球电极上半球的概率。对比图10a和图10b可以发现,对于不同形状的椭球电极,放电期间出现的电流脉冲的时间、位置、数目及幅值都不同。
为了进一步研究椭球电极形状对其负电晕放电的影响,本文对表2所示的六种不同形状下椭球电极的负电晕放电进行了对比。由于椭球电极的形状不同,发生电晕放电所需施加电压也不相同,若强行在不同的椭球电极上施加相同的电压,则会出现仿真不收敛的情况。椭球电极半轴a和b长度之比(a/b)越大,椭球电极A点位置越平缓,椭球电极发生负电晕放电所需电压越高,因此,表2中,椭球电极施加电压由1号~6号依次降低。
表2 电极形状及施加电压
Tab.2 The shape and applied voltage of the electrodes
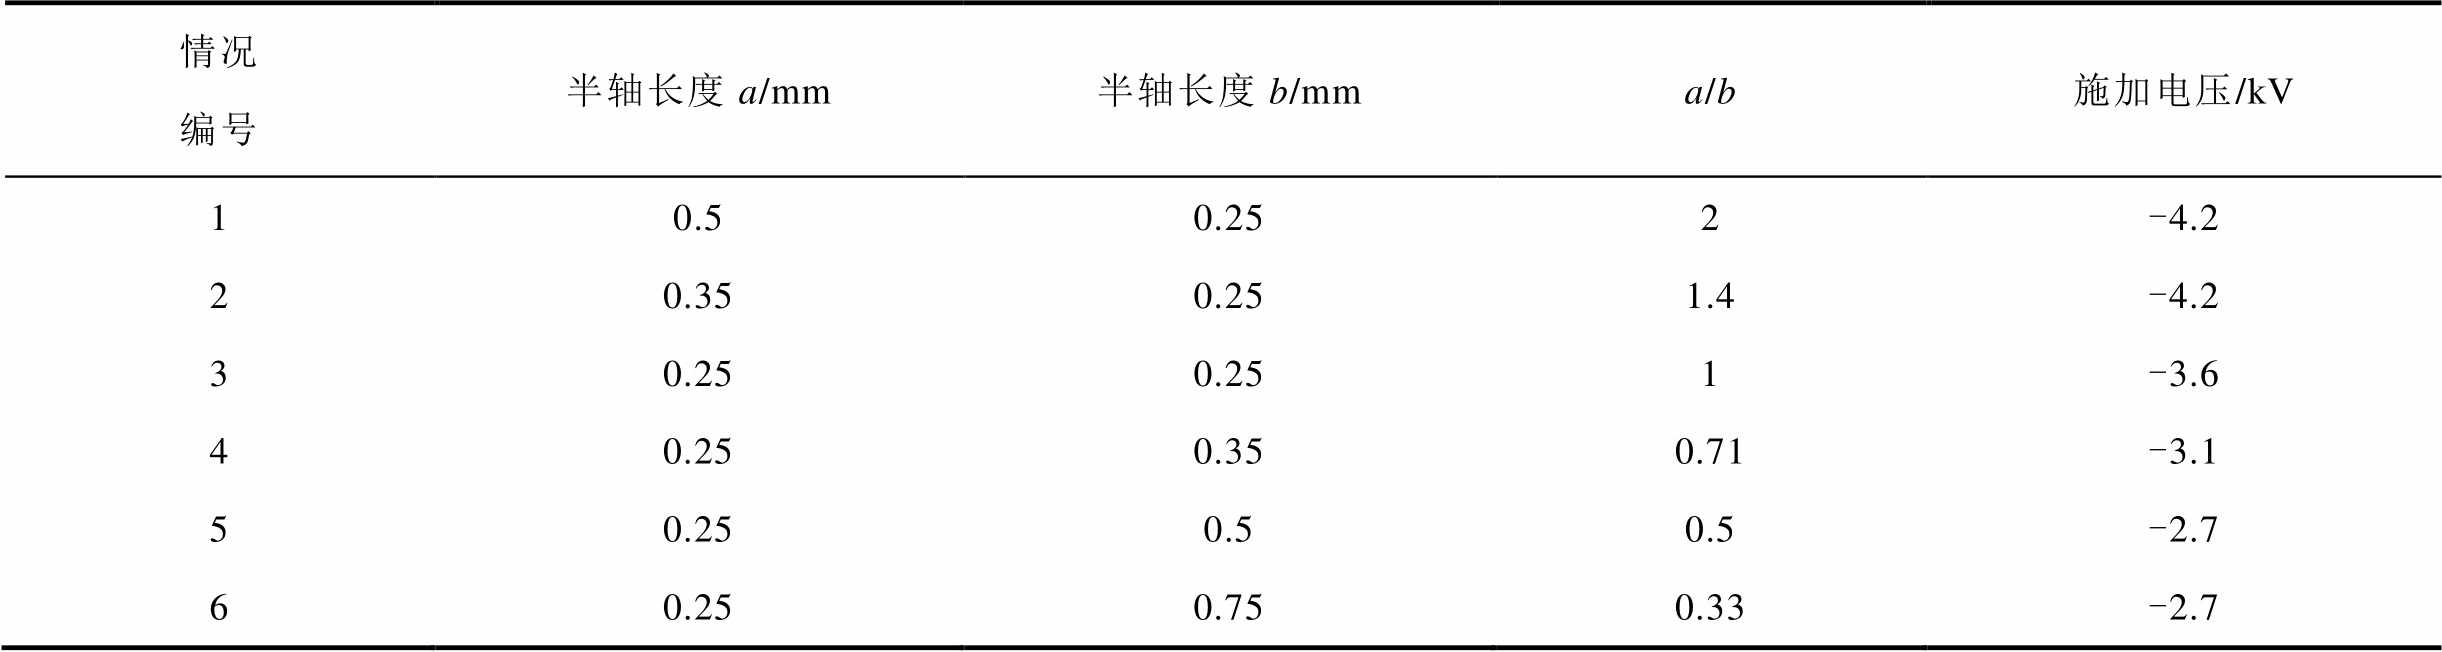
情况编号半轴长度a/mm半轴长度b/mma/b施加电压/kV 10.50.252-4.2 20.350.251.4-4.2 30.250.251-3.6 40.250.350.71-3.1 50.250.50.5-2.7 60.250.750.33-2.7
不同形状下椭球电极负电晕放电期间出现的总电流脉冲数和环放电脉冲数如图12所示。
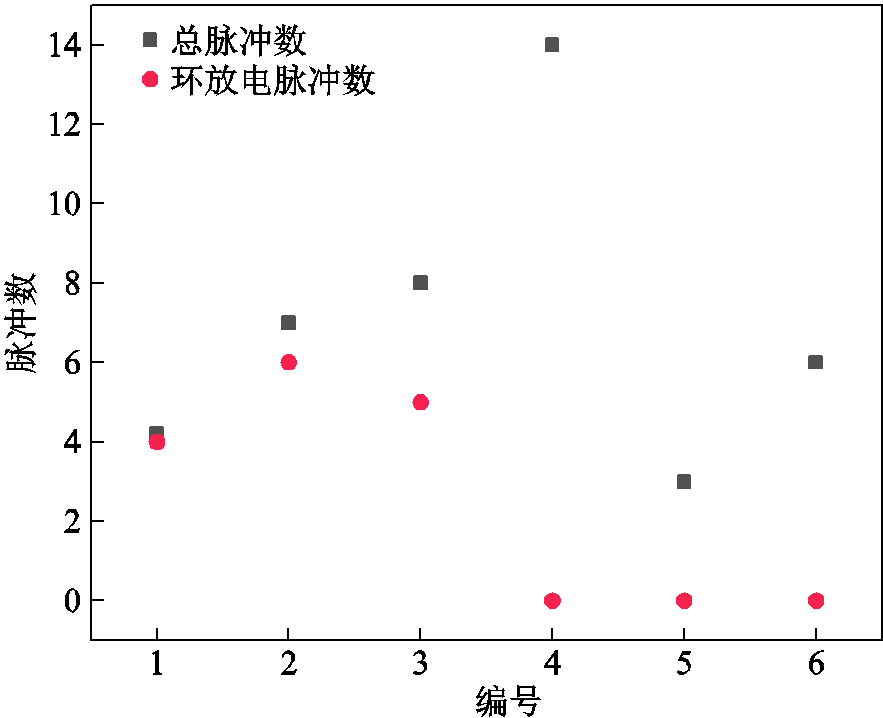
图12 不同椭球电极下的电流脉冲数
Fig.12 Number of the current pulses under different conditions
由图12所示,分别对比编号1和编号2、编号5和编号6所示情况下的电流脉冲数可以发现,在施加电压相同的情况下,半轴a和b长度比值(a/b)越小,椭球电极负电晕放电期间出现的电流脉冲数量越多。椭球电极半轴a和b长度的比值越大,环放电脉冲数占总脉冲数的比例越大。在半轴a和b长度之比为2时,如表2中编号1所示的情况,椭球电极负电晕放电期间只会出现环放电脉冲;在半轴a和b长度之比在1~2之间时,椭球电极负电晕放电期间既有点放电脉冲也有环放电脉冲。在半轴a和b长度之比小于1时,椭球电极负电晕放电期间只会出现点放电脉冲。
由以上分析可得,改变椭球电极形状不仅改变了负电晕放电期间的电流脉冲数量、峰值及出现时刻,同时也改变了放电模式。
耦合流体动力学方程和泊松方程建立了椭球负电晕放电的数值仿真模型,首次从数值仿真的角度研究了椭球形电极电晕放电模式。发现是否出现环模式放电主要与电极周边的初始电场强度有关,半轴a和b长度比值越大,C点处的电场强度越突出,环模式放电脉冲数量占总电流脉冲数量的比例越高。椭球电极的施加电压越高,第一个电流脉冲出现的时刻越早,峰值越大。不同形状的椭球电极放电期间的电流脉冲数量、峰值,出现时刻及放电模式都不同。
参考文献
[1] 陈迪, 苏春强, 安海舰, 等. 淋雨条件下220 kV绝缘子均压环电晕放电特性研究[J]. 高压电器, 2021, 57(12): 170-176. Chen Di, Su Chunqiang, An Haijian, et al. Research on corona discharge characteristics of grading ring of 220 kV insulator under rainfall condition[J]. High Voltage Apparatus, 2021, 57(12): 170-176.
[2] 程金金, 李学宝, 张静岚, 等. 交直流并行架设下的负极性电晕电流脉冲特性[J]. 高电压技术, 2020, 46(9): 3343-3351. Cheng Jinjin, Li Xuebao, Zhang Jinglan, et al. Characteristics of negative corona current pulses from DC conductor parallel with AC conductor[J]. High Voltage Engineering, 2020, 46(9): 3343-3351.
[3] 黄明祥, 郭志彬, 潘立志, 等. 交流单点电晕放电可听噪声纯音分量空间传播特性研究[J]. 华北电力大学学报(自然科学版), 2022, 49(2): 63-71. Huang Mingxiang, Guo Zhibin, Pan Lizhi, et al. Propagation characteristics of pure tones of audible noise generated by single AC corona discharge source[J]. Journal of North China Electric Power University (Natural Science Edition), 2022, 49(2): 63-71.
[4] 李维虎, 张锦, 万保权, 等. 正极性电晕放电脉冲特性仿真研究[J]. 高压电器, 2018, 54(12): 129-136. Li Weihu, Zhang Jin, Wan Baoquan, et al. Simulation study on pulse of positive corona discharge[J]. High Voltage Apparatus, 2018, 54(12): 129-136.
[5] 张晓琴, 朱洪斌, 余翔, 等. 大气相对湿度对聚酰亚胺薄膜表面电晕特性及老化过程的影响[J]. 绝缘材料, 2021, 54(11): 134-139. Zhang Xiaoqin, Zhu Hongbin, Yu Xiang, et al. Effects of ambient relative humidity on surface corona properties and ageing process of polyimide films[J]. Insulating Materials, 2021, 54(11): 134-139.
[6] 梁英, 高丽娟, 董平平. 机械应力对复合套管用硅橡胶材料电晕老化特性的影响[J]. 华北电力大学学报(自然科学版), 2017, 44(4): 50-56. Liang Ying, Gao Lijuan, Dong Pingping. Influence of mechanical stress on the corona and aging characteristics of composite casings made by silicone rubber materials[J]. Journal of North China Electric Power University (Natural Science Edition), 2017, 44(4): 50-56.
[7] 李炼炼, 孟刚, 邓慰, 等. 输变电设备电晕放电紫外图谱量化参数提取[J]. 高压电器, 2017, 53(12): 229-235. Li Lianlian, Meng Gang, Deng Wei, et al. Quantification parameters extraction from ultraviolet image of corona discharge of power transmission and transformation equipment[J]. High Voltage Apparatus, 2017, 53(12): 229-235.
[8] 牛海清, 徐乐平, 李小潇, 等. SF6气体正极性电晕放电特性仿真研究[J]. 高电压技术, 2021, 47(11): 4063-4071. Niu Haiqing, Xu Leping, Li Xiaoxiao, et al. Simulation and study of positive corona characteristics in SF6 gas[J]. High Voltage Engineering, 2021, 47(11): 4063-4071.
[9] 艾嘉伟, 徐乐平, 牛海清, 等. 空气正极性电晕放电微观仿真及模型系数对脉冲电流特性的影响[J]. 高电压技术, 2021, 47(12): 4377-4387. Ai Jiawei, Xu Leping, Niu Haiqing, et al. Micro-simulation of air positive corona and the influence of model coefficient on pulse current characteristics[J]. High Voltage Engineering, 2021, 47(12): 4377-4387.
[10] 何寿杰, 张钊, 李庆, 等. 针板负直流电晕放电中的脉冲等离子体特性[J]. 高电压技术, 2018, 44(3): 870-875.He Shoujie, Zhang Zhao, Li Qing, et al. Characteristics of pulsing plasma in needle-plane corona discharge driven by negative direct power source[J]. High Voltage Engineering, 2018, 44(3): 870-875.
[11] Trichel G W. The mechanism of the negative point to plane corona near onset[J]. Physical Review, 1938, 54(12): 1078-1084.
[12] Antao D S, Staack D A, Fridman A, et al. Atmospheric pressure dc corona discharges: operating regimes and potential applications[J]. Plasma Sources Science and Technology, 2009, 18(3): 035016.
[13] 徐建源, 陈会利, 林莘, 等. 针-板电极下SF6的电晕放电特性分析[J]. 高电压技术, 2019, 45(1): 293-300. Xu Jianyuan, Chen Huili, Lin Xin, et al. Analysis of corona discharge characteristics of SF6 under pin-plate electrodes[J]. High Voltage Engineering, 2019, 45(1): 293-300.
[14] Chen She, Li Kelin, Nijdam S. Transition mechanism of negative DC corona modes in atmospheric air: from Trichel pulses to pulseless glow[J]. Plasma Sources Science and Technology, 2019, 28(5): 055017.
[15] Morrow R. Theory of stepped pulses in negative corona discharges[J]. Physical Review A, General Physics, 1985, 32(6): 3821-3824.
[16] Tarasenko V F, Kuznetsov V S, Panarin V A, et al. Role of streamers in the formation of a corona discharge in a highly nonuniform electric field[J]. JETP Letters, 2019, 110(1): 85-89.
[17] Lu Binxian, Ma Hao, Xiong Jun. Study on negative corona discharge of the small spherical metal electrode[J]. IEEE Transactions on Plasma Science, 2021, 49(7): 2055-2062.
[18] Lu Binxian, Liao Sizhuo, Zhu Jingjing, et al. Comparison of dust particle dynamics under different electrode shapes at the early stage of negative corona discharge[J]. IEEE Transactions on Plasma Science, 2019, 47(11): 4915-4922.
[19] Lu B X, Zhu J J. Comparison of discharge mechanism of negative corona between hyperboloid and hemispherical electrodes[J]. AIP Advances, 2018, 8(12): 125206.
[20] Morrow R, Sato N. The discharge current induced by the motion of charged particles in time-dependent electric fields; Sato’s equation extended[J]. Journal of Physics D: Applied Physics, 1999, 32(5): L20-L22.
[21] Lu B X, Sun H Y. The role of photoionization in negative corona discharge[J]. AIP Advances, 2016, 6(9): 095111.
[22] Deng F C, Ye L Y, Song K C. Numerical studies of Trichel pulses in airflows[J]. Journal of Physics D: Applied Physics, 2013, 46(42): 425202.
[23] Georghiou G E, Papadakis A P, Morrow R, et al. Numerical modelling of atmospheric pressure gas discharges leading to plasma production[J]. Journal of Physics D: Applied Physics, 2005, 38(20): R303-R328.
[24] Kang W S, Park J M, Kim Y, et al. Numerical study on influences of barrier arrangements on dielectric barrier discharge characteristics[J]. IEEE Transactions on Plasma Science, 2003, 31(4): 504-510.
[25] Liang Xinghua, Jayaram S, Berezin A A, et al. Modeling of the electrical parameters of a wire-cylinder electrostatic precipitator under pulse energization[J]. IEEE Transactions on Industry Applications, 2002, 38(1): 35-42.
[26] Greenwood A. Negative point-to-plane corona—a new mode of the discharge[J]. Nature, 1951, 168(4262): 41-42.
[27] Greenwood A. The mechanism of the ring discharge in negative point-to-plane corona[J]. Journal of Applied Physics, 1952, 23(12): 1316-1319.
Abstract Corona discharge is a common partial discharge that may occur in important power transmission equipment such as transformers, circuit breakers and gas insulated switchgear (GIS), causing serious damage to the insulation of the equipment. In recent years, researchers have studied the mechanism of negative corona discharge of electrodes with different tip shapes by numerical simulation. But there is no research on the negative corona discharge of small ellipsoidal electrodes. In this paper, the negative corona discharge model of ellipsoid electrode is established by coupling the fluid dynamics equation and Poisson equation. The discharge current pulses and the distribution of positive ion concentration are analyzed by using the finite element method.
The ellipsoid electrode is equivalent to a symmetric simulation model. The model is placed in a simulated air domain with a side length of 10 mm, and the bottom of the simulation domain is a ground plane electrode with a radius of 10 mm. The ellipsoid electrode is located 3.3 mm above the ground plane electrode. After setting the initial density distribution of electrons and positive ions, and determining the discharge voltage and simulation time, the current pulses during the negative corona discharge can be obtained. In this way, an axisymmetric ellipsoid electrode negative corona discharge model is formed, which greatly reduces the simulation time.
The lengths of the ellipsoid electrode half-axis a and b are set as 0.35 mm and 0.25 mm, respectively. By applying DC voltage, the ellipsoid electrode potential is -4.2 kV, and the simulation time is set as 20 000 ns. The results show that only the first current pulse is the point discharge pulse appearing at 0° position (point A) of the ellipsoid electrode, and the other current pulses are the ring discharge pulse appearing near 90° position (point C) of the ellipsoid electrode. The amplitudes of all ring discharge pulse currents are greater than that of point discharge pulse currents. The shape of the ellipsoid electrode is kept unchanged, and the applied voltage is set to 3.6, 3.7, 3.9, 4.1 and 4.2 kV, respectively. The simulation time is 20 000 ns. The results show that the amplitude of the first current pulse of the ellipsoid electrode increases with the increase of voltage. The higher the applied voltage, the more current pulses during the negative corona discharge of the ellipsoid electrode. But the effect of the applied voltage on the negative corona discharge mode is small. The shape of the ellipsoid electrode is changed by keeping the applied voltage constant. Given that a is always greater than b, the results show that the smaller the ratio of half-axis a to b of the ellipsoid electrode, the more current pulses during negative corona discharge of the ellipsoid electrode. The greater the ratio of half-axis a and b of the ellipsoid electrode, the greater the proportion of the number of ring discharge pulses to the total number of discharge pulses. Therefore, changing the shape of the ellipsoid electrode not only changes the number, amplitude and occurrence time of current pulses during negative corona discharge, but also changes the discharge mode.
The following conclusions can be drawn from the simulation analysis: (1) The ring mode discharge mainly occurs at the position where the electric field intensity is maximum before the pulse current. The greater the ratio of half-axis a to b of the ellipsoid electrode, the greater the electric field intensity at point C, and the greater the proportion of the number of ring mode discharge pulses to the total number of current pulses. (2) The greater the applied voltage to the same ellipsoid electrode, the earlier the first current pulse appearing and the greater the amplitude. (3) The number, amplitude, occurrence time and discharge mode of current pulses during discharge of ellipsoid electrodes with different shapes are different.
keywords:Negative corona discharge, discharge mode, numerical simulation, small ellipsoidal electrode
DOI:10.19595/j.cnki.1000-6753.tces.221126
中图分类号:TM21
收稿日期 2022-06-06
改稿日期 2022-09-18
卢斌先 男,1969年生,教授,博士生导师,研究方向为特快速暂态过电压和电晕放电。E-mail:lbx@ncepu.edu.cn(通信作者)
岳战兵 男,1998年生,硕士研究生,研究方向为球状电极电晕放电。E-mail:yzb@ncepu.edu.cn
(编辑 郭丽军)