
Fig.1 Simplified diagram of a PV system
Abstract The modelling of grid-connected photovoltaic (PV) generation systems is the basis for studying their interaction with the grid. The transients of PV systems are determined by weather and grid conditions, as well as the characteristics of commercial inverters, whose topology and control algorithm are usually unknown. This hinders the analysis of the impacts that PV systems might have on the grid. For this purpose, a generic process for modelling PV systems based on transient analysis and system identification is presented. By viewing a PV system as a black-box without knowledge of its internal components, structure or control algorithm, the model was established through measured input-output data and system identification. Transfer functions were taken as the model structure based on classic control theories. A power hardware-in-the-loop system was used to verify the process by collecting instantaneous input-output data from the terminals of a commercial 3kW PV inverter. The results show that the developed model reproduces accurately the transients of the inverter under various disturbances, demonstrating the effectiveness of this generic modelling process.
Keywords: PV inverter modelling, system identification, transfer function, power-hardware-in- the-loop (PHIL)
Photovoltaic generation systems have become widely installed around the world in recent years. As the penetration of grid-connected PV generation systems increases, the volatility of their power production pose challenges to the stable operation of the grid[1-2]. Power system planners, utility engineers, and PV system developers often need to model and simulate distribution systems to investigate the behaviours of PV systems and their potential impacts on the grid[3-4]. Therefore, it is necessary to establish reliable and accurate models of grid-connected PV systems to investigate the operational characteristics of the PV and the grid.
The output of the PV systems is mainly controlled through their interfacing inverters. In practical operations, the operating conditions constantly change due to variation of irradiance, temperatures, and grid conditions. In most cases, the behaviour of inverters is primarily considered in a steady state with slowly changing working con- ditions[5]. However, in many cases, conditions change abruptly, for example, sudden changes of irradiation by passing clouds, load changes in the grid caused by nearby grid failures. Under these circumstances, PV inverters operate in a transient state and will probably bring challenges to the stable operation of the system[6-7]. Thus, the transient conditions of a PV system are mainly investigated in this paper.
The modelling of power electronic system is usually divided into three levels according to the analysis purposes, i.e. the component level, converter level and system level[5]. Component level models are developed to simulate detailed circuits at the level of power diodes, inductors, and capacitors. For converter level modelling, models are developed to represent the average behaviour and the switching characteri- stics of the converters[8-10]. While these models are reliable and accurate, large amount of computational time is needed when analysing large power electronic systems. At the same time, due to confidentiality reasons, system integrators are usually unable to get details about the converters. Besides, there are various control algorithms developed to tackle with different scenarios[11-13], which also limits the usage of these kinds of models. System-level models, however, based on input and output measurements, have gained attention recently[14-19]. For system-level modelling, power converters are considered as black-boxes without knowledge of their physical structure. Take the black-box g-parameter model proposed in the 1980s as an example[14-18]. The model is composed of several virtual dynamic systems, whose parameters were identified through either AC-sweep in the frequency domain[14] or transient analysis in the time domain[15-18]. Since details of commercial PV inverters are proprietary and mostly very limited, a system-level model is further investigated in this paper.
While the g-parameter model only focuses on the converters itself, the output of the grid-connected PV system depends also on the external weather and the grid conditions. Thus, a black-box model for the whole integrated PV system is required to study the overall features.
In summary, a new generalized modelling process based on system identification for system- level analysis of grid-connected PV systems is presented in this paper. The inputs of the model were selected by analysing the factors influencing the output power of the system. After that, different amplitude disturbances were conducted at each input of the model. The transient responses were measured and the system transfer functions from the inputs to the output were identified through system identification. Such a model is useful to simulate the transient interactions between PV systems and the grid. It enables utility planners to conduct the necessary studies before connecting PV units to the grid. The features of this modelling process are summarized as follows:
(1) This is a unified, general modelling process because no explicit knowledge of the PV inverter composition or its control methods is required.
(2) The model reflects accurately the output electrical characteristics of the inverter within the range of 10%~100% of rated power.
(3) The modelling process is carried out offline. The parameters of the model are identified by transient data to accurately represent the behaviours of the PV system under different transients.
Power hardware-in-the-loop (PHIL) testing[20-21] on PV systems with the same functionalities provides a valuable tool to measure the transient responses of such systems. Transient experiments were designed and carried out.
A simplified diagram of a PV system is shown in Fig.1[22]. The main features of this system are:
(1) The output power of the PV panels is determined by weather conditions such as irradiation, temperature, and by the power reference of the inverter control system. Note that when the value of the active power reference is higher than the maximum power point (MPP) of the PV panel, the system cannot follow the reference power but produce the MPP power Pmpp, which is determined by irradiation and temperature. While when the value of the active power reference is lower than the MPP power, the system will produce according to the power reference. Thus, a comparison between the value of MPP power and power reference should be made before calculating the output power of the model.

Fig.1 Simplified diagram of a PV system
(2) When the voltage of the grid fluctuates, the output power of the inverter will fluctuate as well.
(3) As the PV system operates as a current source, its output voltage is set and maintained by the grid. The transients of the PV system are reflected in the current fed into the grid. Thus, the output current of the system is mainly studied. Once the current is known, the active and reactive power of the system can be readily obtained.
Based on these considerations, the black-box model of the single-phase PV system proposed in this paper is shown in Fig.2. The inputs of the system are the solar irradiation s, the active power reference p*, the temperature t and the instant value of the grid voltage ug. The AC side current i of the inverter is taken as the output. Besides, a comparison block takes in the irradiation, power reference and temperature and output the result to the PV system block.
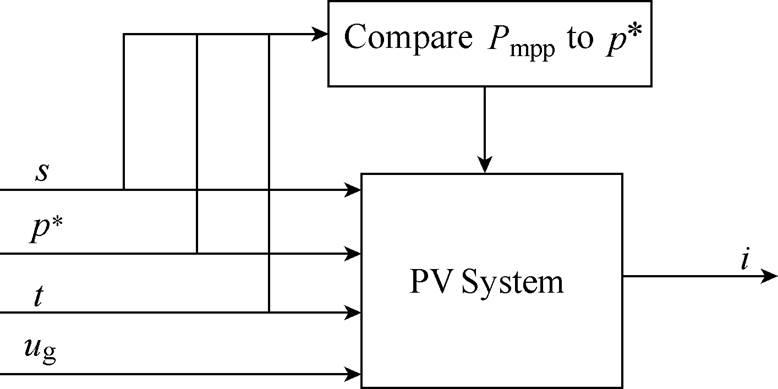
Fig.2 Black-box model of the PV system
After the inputs and output of the system were determined, the functions in the “PV system” block should be investigated. Fig.3 shows one of the typical simplified one-line diagrams of a general single-phase current-controlled PV inverter and its control system[23]. PR controller is used in the inner current loop to track the sinusoidal current. Fig.4 depicts the block diagram of the grid current control loop based on classic control theories. This system is a two-input and single-output system, where the grid voltage ugand the inverter reference current  are the two inputs and grid current igis the output.
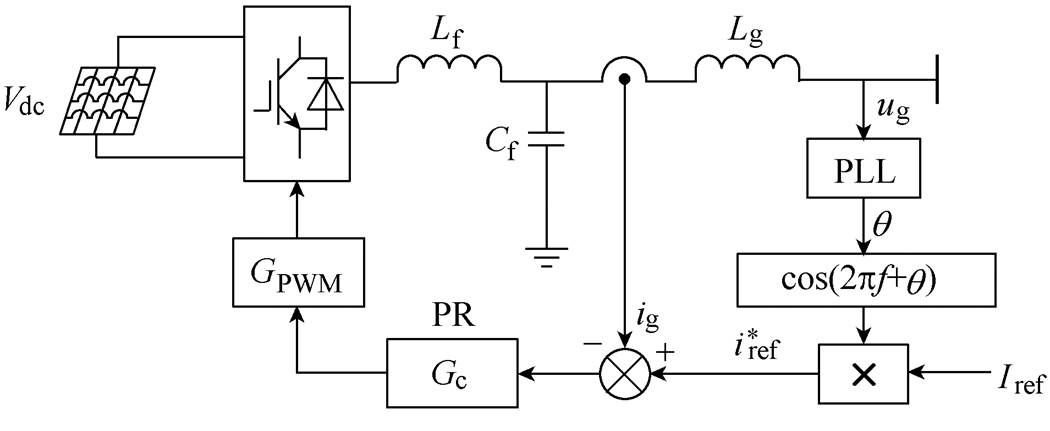
Fig.3 Simplified one-line diagram of a general single-phase current-controlled PV inverter

Fig.4 Block diagram of the inverter grid current control loop
From Fig.4, the closed-loop response of the current control loop can be derived as
 (1)
(1)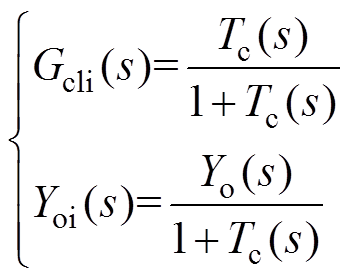 (2)
(2)
where Gcli(s) and Yoi(s) are the current reference to output transfer function and closed-loop output admittance, respectively. Tc(s) is the open-loop gain of the current control loop, which is given by
 (3)
(3) (4)
(4)
where Gc(s) is the PR current controller. Yiand Yo are the transfer functions of the LCL-filter plant as shown in
 (5)
(5) (6)
(6)
where ZLf(s), ZLg(s) and ZCf(s)denote the impedances of the LCL-filter inductors and capacitor, respectively. Yo(s) is also the open-loop output admittance.
Thus, based on the analysis above, transfer functions can be used to model the PV system. By combining the models in Fig.2 and Fig.4, the black-box PV system model developed in this paper is shown in Fig.5, where Gs,  and Yoi are the transfer functions corresponding to the transients of the irradiation, the active power and the grid voltage to the output current, respectively. The key to the modelling process is to identify these transfer functions.

Fig.5 Block diagram of the black-box PV system
Note that the influence of the temperature on the output of the system is little. Besides, the temperature is not likely to change abruptly, thus, the transfer- function-effect of the temperature on the output is neglected in the model. While the temperature does influence the output power, It is kept as one of the independent variables when calculating Pmpp, as its contribution to the output of the system.
As the grid voltage and the output current of the inverter are AC sinusoidal signal, thus, they can be used directly as the input and output when identifying the transfer function. While the irradiation and active power are DC signal, to identify the transfer functions in these cases, they should be transformed to AC sinusoidal reference current  as inputs, as shown in Fig.5.
In Fig.5, Ug is the RMS value of the grid voltage. P is the output active power of the PV inverter, which is calculated by Pmpp, the inverter active power reference p*and the efficiency of the PV inverter  . p* can be set and found in the corresponding software of the inverter.
  is determined by the working condition of the inverter, thus, its clear expression is not likely to be found. Pmpp is determined by solar irradiation and temperature, its expression can be highly nonlinear and a general simplified expression can be founded but requires information on the PV manual. As the focus of this paper is the black-box modelling and identification of the PV system, thus, detailed expression of Pmpp is not given. Instead, static state experiments of the PV system were conducted to determine Pmppand
 . This can also be considered a more general way to calculate
 . The result was a lookup table, part of the table is shown in Tab.1, corresponding to the temperature 25℃.
Tab.1 The results of Pmpp and h

S/(W/m2)Pmpp/Wh(%) 20038095.63 40079096.08 6001 20096.22 8001 60096.31 1 0002 00095.56
The model of the PV system shown in Fig.5 can be described byequation(7), where  is taken as the input of the model as it is AC sinusoidal signal, the same as the output current of the inverter to help identifying the transfer functions.
 (7)
(7)Note that while is determined by the actual value of the solar irradiation and active power,
  is the deviation of the grid voltage from its initial value. This is because the output current of the system i follows the current reference of the control system
  , while the admittance Yoi reveals how the deviation of the grid voltage affects the current.
A disturbance-observation process was conducted to identify the transfer functions in equation (7). Disturbances were conducted and the corresponding output current i was measured in the laboratory set-up shown in Fig.6, corresponding to the three targets Gs, Gp*and Yoi, respectively.
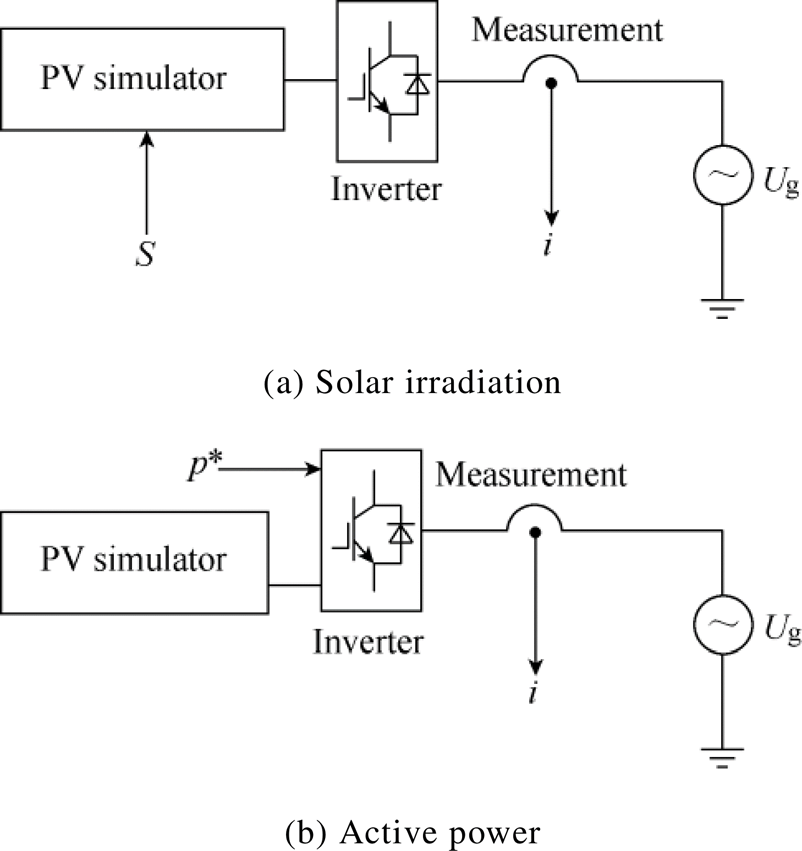
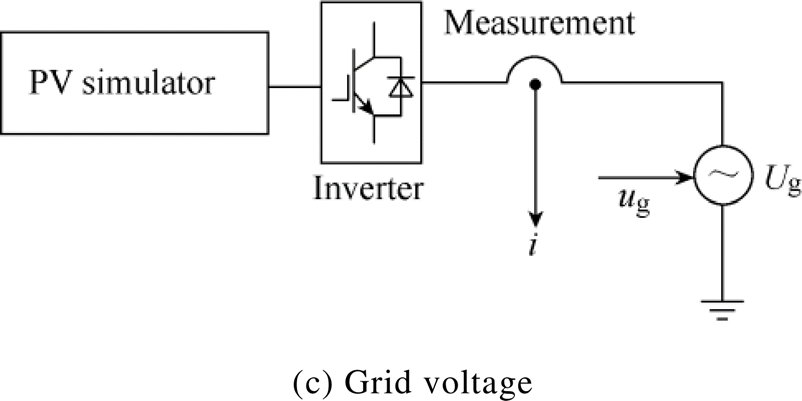
Fig.6 The disturbance experiments
The disturbance upon each input and the corresponding current i were used to identifying the transfer functions. More specifically:
(1) As there may be couplings between the inputs  , it is necessary to keep the other inputs unchanged while conducting disturbances to one of these inputs.
(2) As step disturbance is easy to implement and can fully stimulate the transient characteristics of the system[24-25], step disturbances were conducted on each of the inputs  .
.
(3) When identifying each transfer function, different magnitudes of step disturbances were conducted. The data obtained in each magnitude disturbance is used to train the model corresponding to this magnitude disturbance. While the model developed should be validated by the other magnitudes data.
(4) The details of the transfer functions to be identified in equation (7) are shown from equation (8) to equation (10). The identification is more of a trial-and-error process where one estimates the parameters of various model orders and compares the results against the measured data.
 (8)
(8)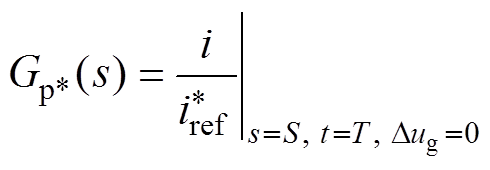 (9)
(9)
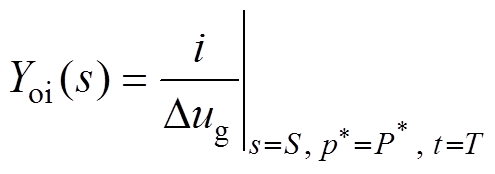 (10)
(10)
For an example, take the parameters of Gs(s) shown in
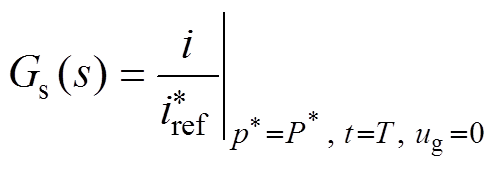
 (11)
(11)where n and m are the orders of denominator and numerator of the transfer function, respectively. bm, bm-1, …, b0 are the polynomial coefficients of the transfer function numerator. an-1, an-2, …, a0 are the polynomial coefficients of the denominator. These are the parameters to be identified. As the orders m and n were integers, they were not identified but were set manually at different values, after which the coefficients of the transfer function were identified and the results of the model were obtained, based on which the optimal orders were compared and determined.
(5) The initialization and identification of the parameters were carried out using the system identification toolbox in Matlab. More specifically, one of the following three different initial conditions were selected during estimation, etc., all initial conditions are taken as zero, the necessary initial conditions are treated as estimation parameters, the necessary initial conditions are estimated by a backward filtering process. After that, different algorithms were used to initialize the values of the numerator and denominator. These algorithms include the instrument variable approach, state variable filters approach, generalized Poisson moment functions approach, et al, which are all widely used in this field[24-25]. A comparison of the results of these initial conditions and algorithms was made and the method that yields the least prediction error norm was selected.The Levenberg-Marquardt (LM) algorithm was then adopted for the parameters iterative estimation. This algorithm has become a standard technique for least-squares problems and can be thought of as a combination of the gradient-descent and the Gauss-Newton (GN) method[26]. The LM method acts more like a gradient-descent method when the parameters are far from their optimal value and more like the GN method when the parameters are closer[27]. As there are two possible options at each iteration, the LM is faster to converge than either the gradient descent or the GN on its own. Another advantage is that the algorithm can find a solution, even when the initial guess is far from the optimal point[28]. These features make the LM algorithm efficient to update the parameters of the transfer function. The flow chart of the Levenberg-Marquardt algorithm is shown in Fig.7[29].
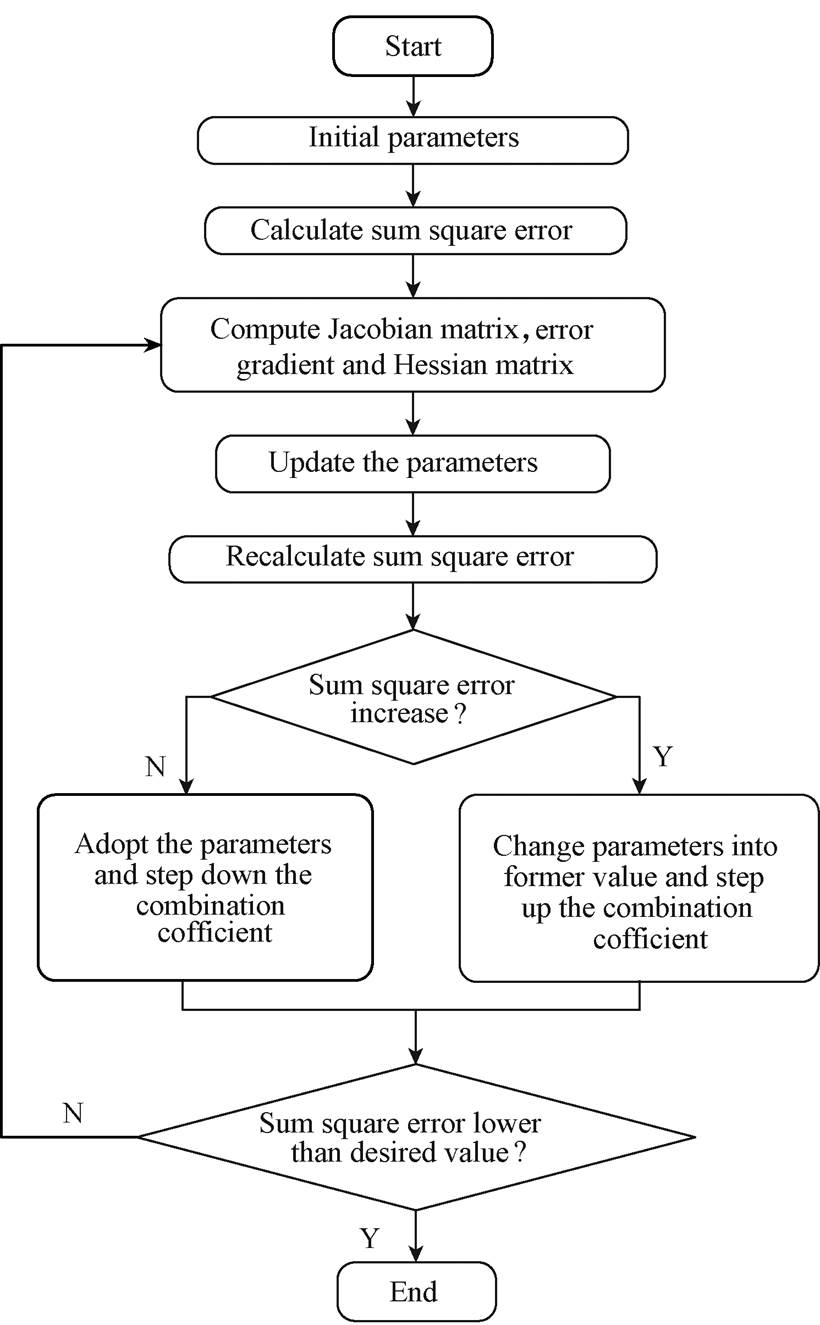
Fig.7 Flow chart of the Levenberg-Marquardt algorithm
The fitting rate of the identification results of the transfer function is defined by Ffit as shown in
 (12)
(12)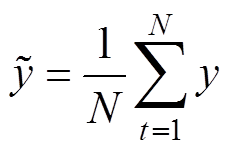 (13)
(13)
where y is the measured output of the inverter, u is the input of the model, N is the amount of the data used. Transfer functions with a fitting rate higher than 85% are considered able to reproduce the transient accurately.
The model development and validation[30] process are shown in Fig.8.
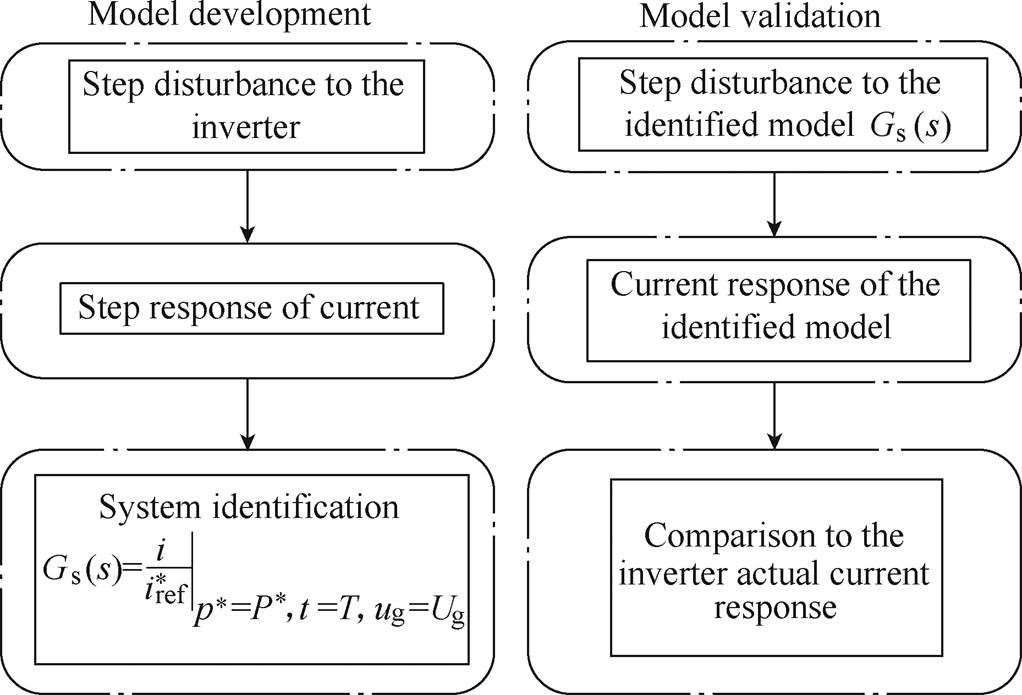
Fig.8 Model development and validation process
The power hardware-in-the-loop PV system shown in Fig.9 was used for modelling and validating the system. The PV inverter under test was an SMA Sunny Boy SB 3000TL-21 with a DC side MPP voltage range from 175V to 500V. The output of the PV simulator was set at 400V, at a maximum power point of 2kW, corresponding to solar irradiation of 1 000W/m2. Thus, the PV simulator can be connected directly to the inverter without the need for a step-up converter. A resistive load of 2kW absorbs the active power of the 2kV·A PV. The AC voltage supply set by the RTDS was at 230V, 50Hz (as this experiment was conducted in Greece). The available disturbance ranges of each input are shown in Tab.2.
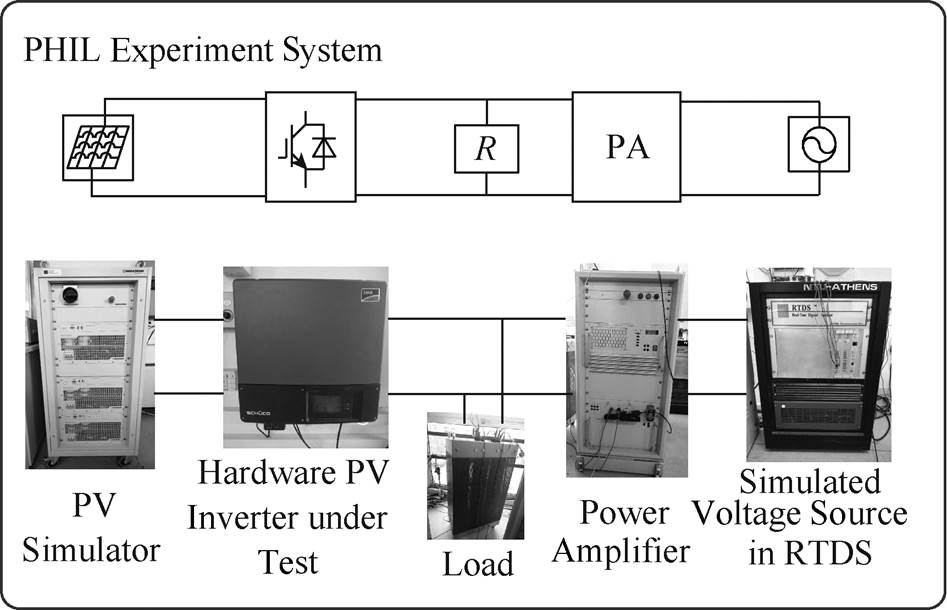
Fig.9 The Power hardware-in-the-loop experiment system
Tab.2 The available disturbance ranges of each variables
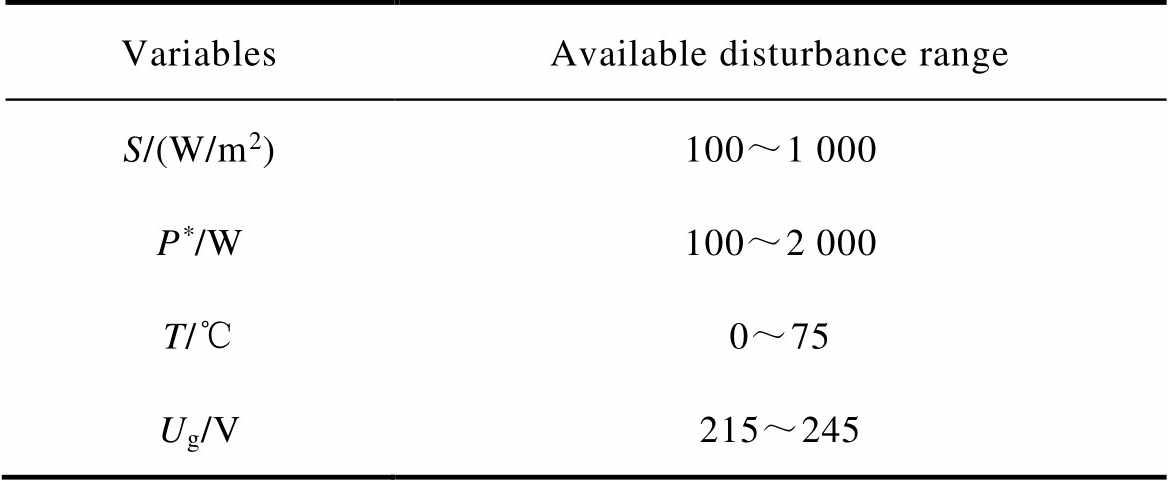
VariablesAvailable disturbance range S/(W/m2)100~1 000 P*/W100~2 000 T/℃0~75 Ug/V215~245
Different magnitude disturbances experiments were conducted to each input within the disturbance ranges. The sample rate of the measurement device was 12 500Hz. The transients of irradiation distur- bances and active power disturbances were within 1.5s, thus, the amount of the data N was around 120 000. While the transients of the grid voltage disturbances were within 0.3s, thus, the N in this case was around 24 000. Take the process of identifying Gs as an example, one of the training data of  and the output current, corresponding to the disturbance of solar irradiation steps from 600W/m2 to 1 000W/m2, is shown in Fig.10. As we can see, the output current of the PV inverter increases as the solar irradiation steps.
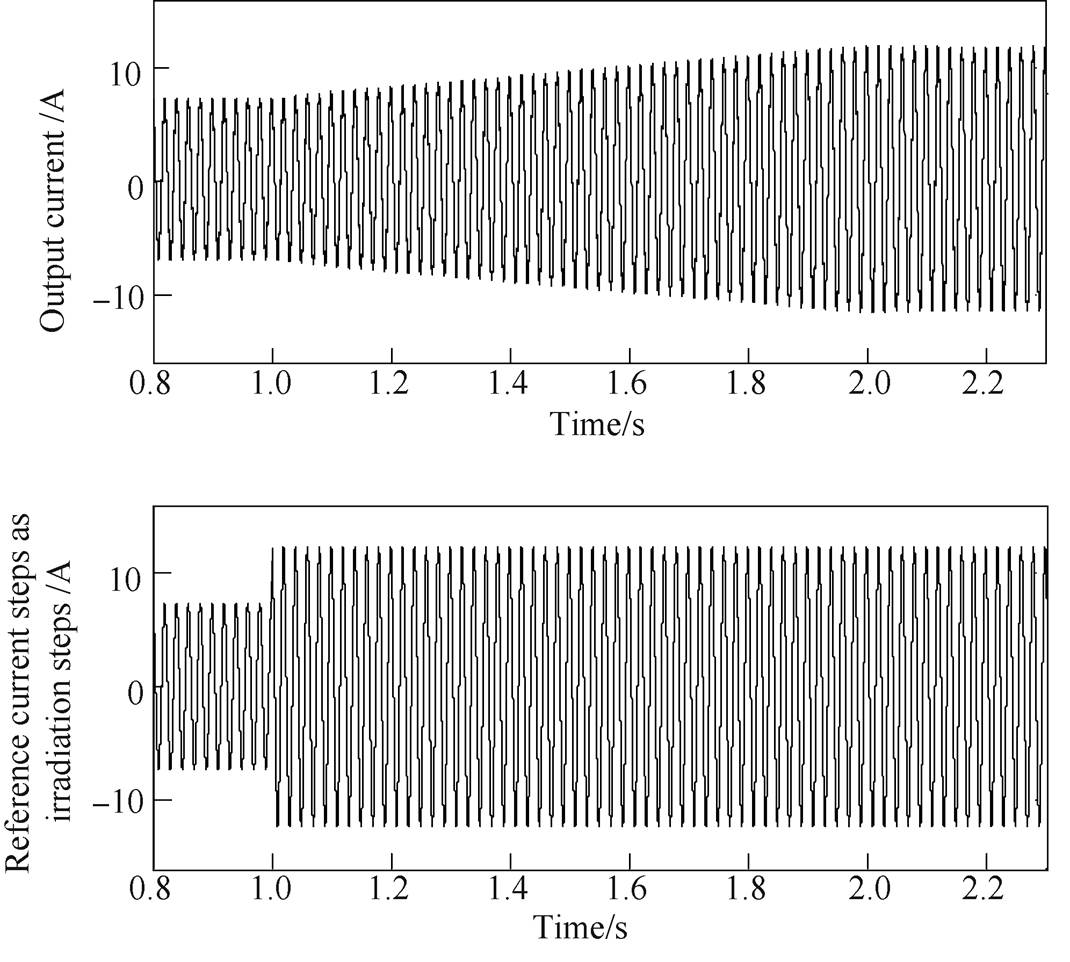
Fig.10 Example training data of  and current response when irradiation steps
Corresponding to each of these disturbance processes, transfer functions were identified through trial-and-error until the best was found. After that, this transfer function was validated by the data of the other magnitude of disturbances. It will be taken as the Gs if it represents these processes accurately as well.
The transfer function identified corresponds to the disturbance of “800W/m2 to 1 000W/m2” is with the best fitness. The results against the irradiation disturbance processes are shown in Fig.11. The average fitting rate reaches more than 85%. Thus, it was taken as the transfer function Gs, as shown in equation (14).
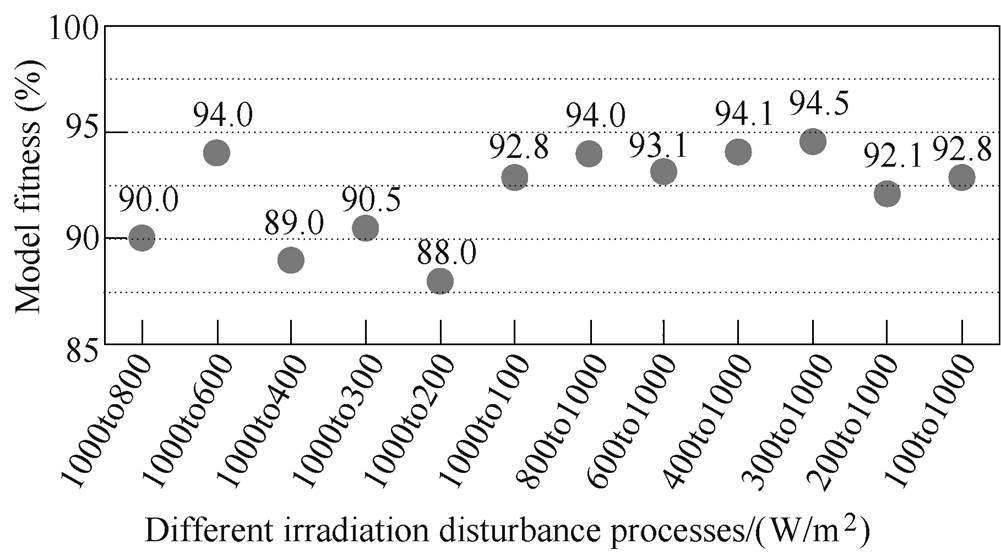
Fig.11 The fitness of Gs against different irradiation disturbance processes
Similarly, transfer functions with high accuracy corresponding to the active power disturbance from “300W to 2 000W” and the grid voltage disturbance from “215V to 235V” were found, respectively. The fitness of these transfer functions is shown in Fig.12 and Fig.13. The average accuracy also reaches more than 85%. Thus, they were taken as the transfer function of Gp*and Yoi, as shown in equation (15) and equation (16). Equation (14) to equation (16) are regarded as the general model of the PV system.
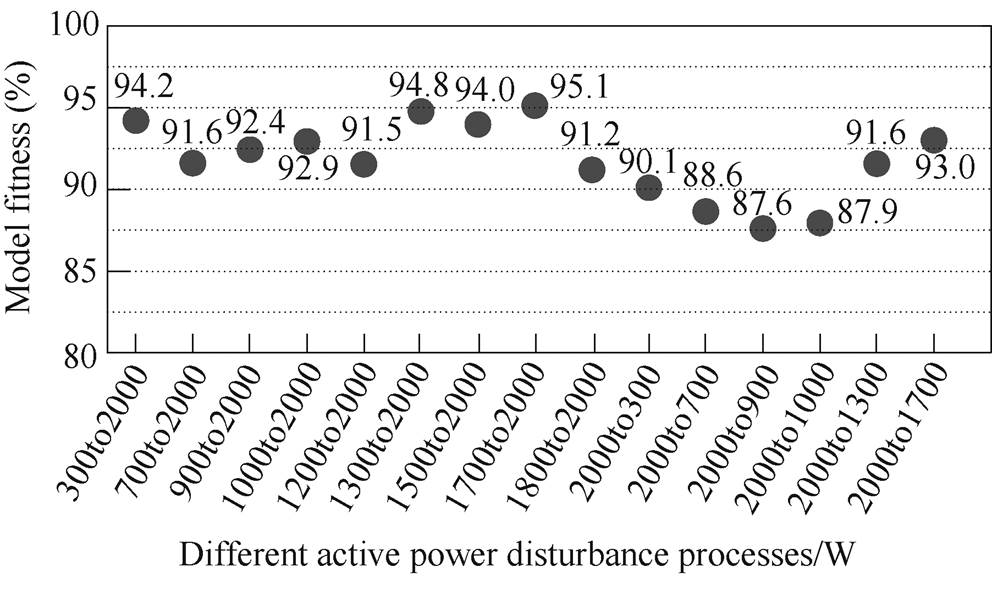
Fig.12 The fitness of Gp* against different active power reference disturbance processes
 (14)
(14) (15)
(15)
 (16)
(16)
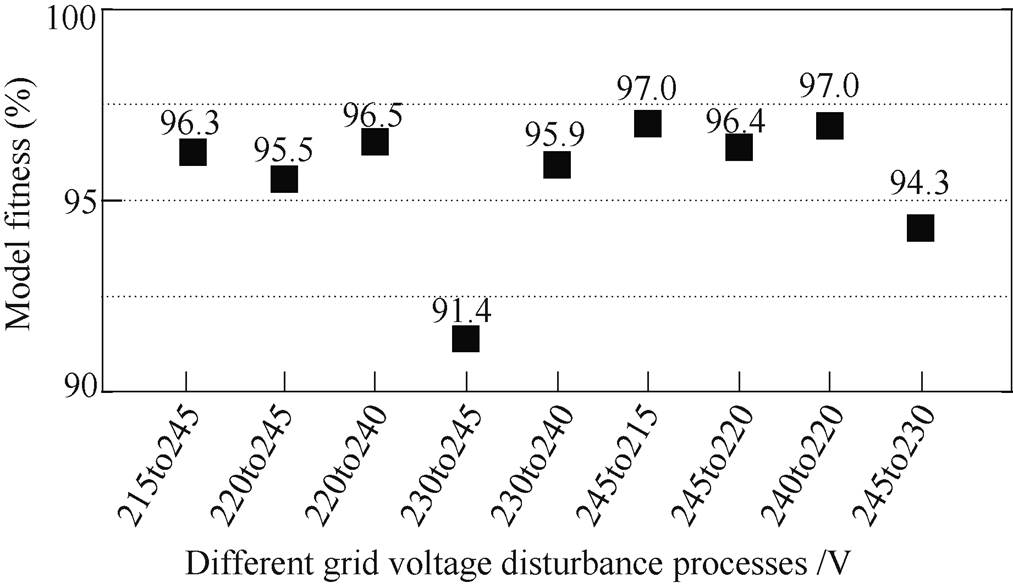
Fig.13 The fitness of Yoi against different grid voltage disturbance processes
To validate these identified transfer functions, the current responses when applying the same disturbance to the identified model and the inverter were compared. Take one of the results in each case shown as follows. In Fig.14, the current increases along with solar irradiation steps up from “800W/m2 to 1 000W/m2”. In Fig.15, the current increases as the active power reference steps up from “1 800W to 2 000W”. In Fig.16, the current decreases along with the voltage step up from “230V to 240V” as the PV inverter trying to maintain the output active power. As we can see, the model fits the data well in these situations, proving the effectiveness of the presented modelling process.
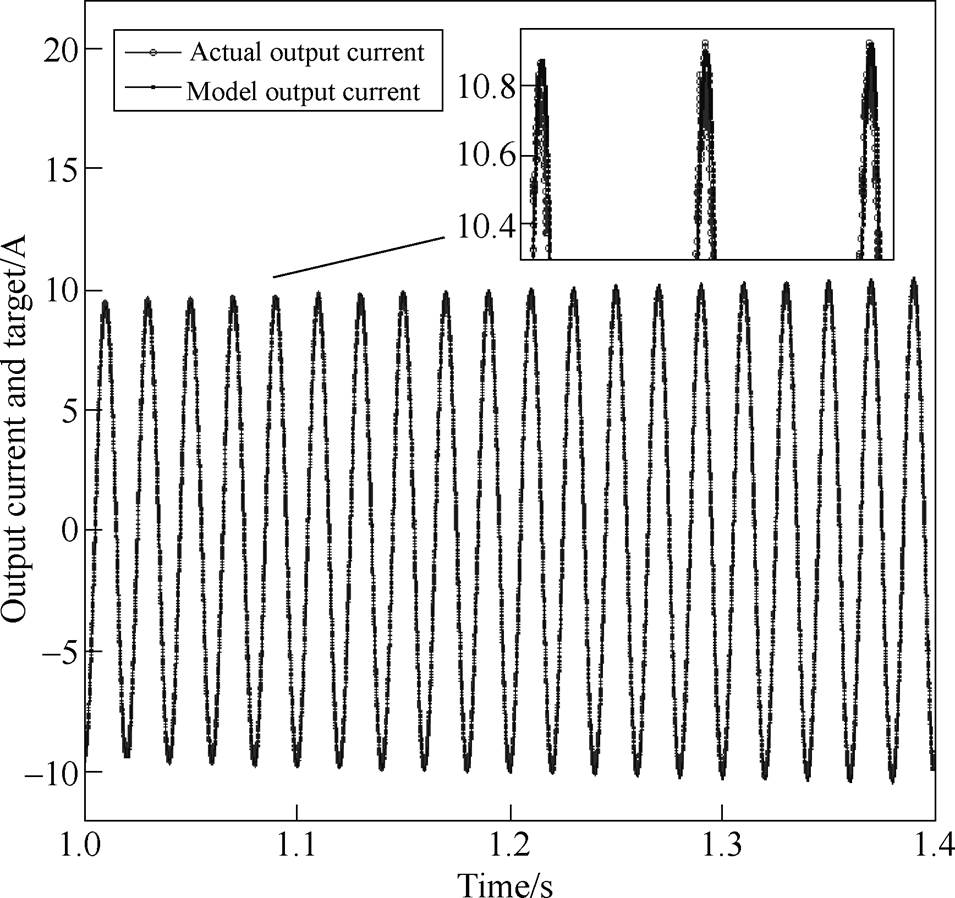
Fig.14 Output current comparison of the inverter and the identified model when solar irradiation steps
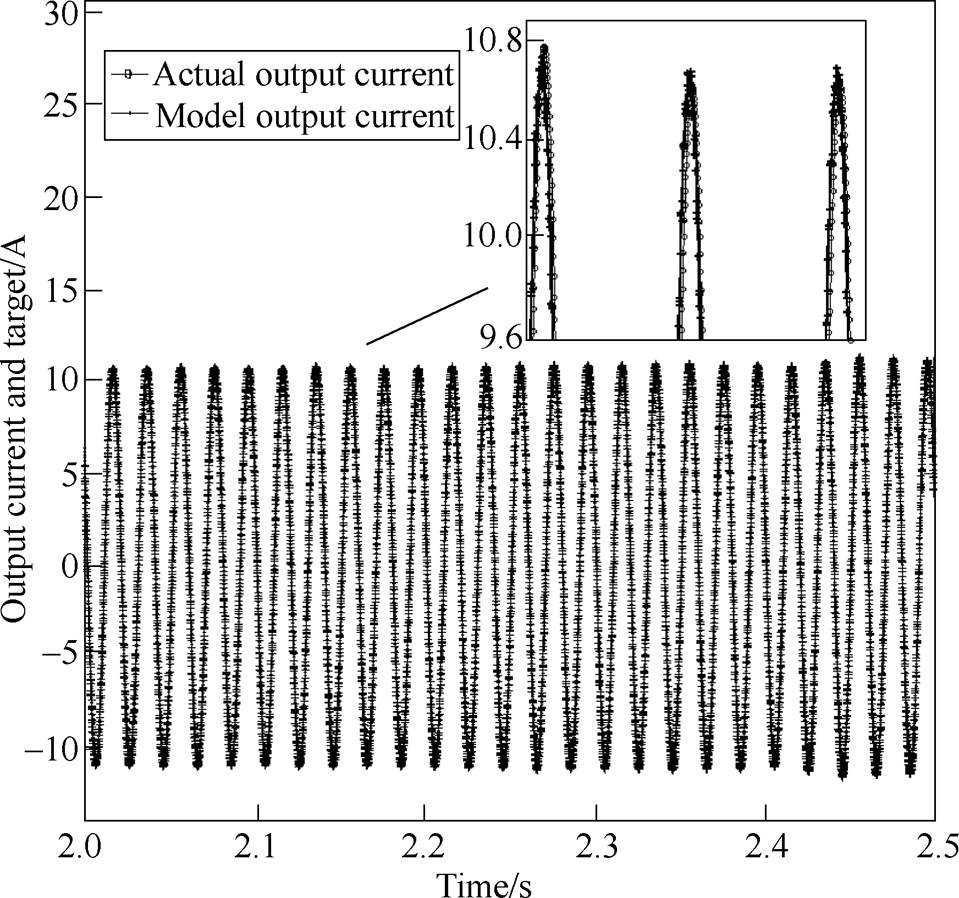
Fig.15 Output current comparison of the inverter and the identified model when active power reference steps
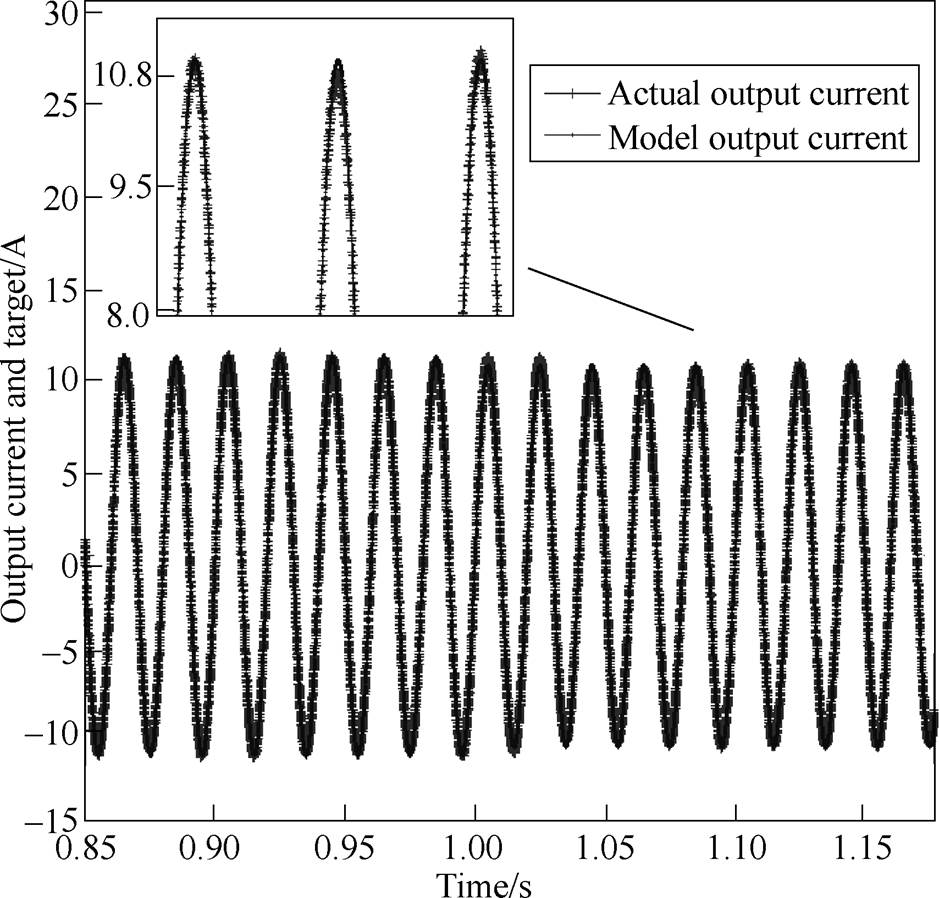
Fig.16 Output current comparison of the inverter and the identified model when grid voltage steps
A single-phase grid-connected PV inverter was modelled through transient analysis and system identi- fication. Solar irradiation, active power reference and grid voltage were taken as the inputs of the model, the AC side current of the inverter was taken as the output. Three experiment cases corresponding to each of the input were carried out. Transfer functions with high fitness were identified correspondingly, which can accurately reproduce the transients of the disturbances processes within the operating range of the inverter. This good agreement between the model output and the inverter response validates both the black-box model theory and the system identification method.
Acknowledgment:The authors gratefully acknow- ledge the SmartRUE research team of the National Technical University of Athens in Greece for their help and support of the PHIL experiment system. The authors also would like to appreciate the China Scholarship Council for the funding with the grant number of 201706690020 and the grant supported by the 111 Project.
Reference
[1] Tobnaghi D. A review on impacts of grid-connected PV system on distribution networks[J]. International Journal of Electrical, Computer, Energetic, Electronic and Communication Engineering, 2016, 10(1): 137- 142.
[2] Eftekharnejad S, Vittal V, Heydt G T, et al. Impact of increased penetration of photovoltaic generation on power systems[J]. IEEE Transactions on Power System, 2013, 28(2): 893-901.
[3] Ellis A, Behnke M, Elliott R. Generic solar photo- voltaic system dynamic simulation model specifi- cation[R]. Sandia Report, Sandia National Laborato- ries, Albuquerque, New Mexico, 2013: 8-10.
[4] Ramasubramanian D, Yu Z, Ayyanar R, et al. Converter model for representing converter interfaced generation in large scale grid simulations[J]. IEEE Transactions on Power System, 2017, 32(1): 765-773.
[5] Abbood H, Benigni A. Data-driven modeling of a commercial photovoltaic microinverter[J]. Modelling and Simulation in Engineering, 2018: 5280681.
[6] Patsalides M, Efthymiou V, Stavrou A, et al. A generic transient PV system model for power quality studies[J]. Renewable Energy, 2016, 89(1): 526-542.
[7] Pourbeik P, Sanchez-Gasca J, Senthil J, et al. Generic dynamic models for modelling wind power plants and other renewable technologies in large-scale power system studies[J]. IEEE Transactions on Energy Conversion, 2017, 32(3): 1108-1116.
[8] Liu Wenjun, Zhou Long, Chen Jian, et al. Control method for grid-connected inverter with LCL filter by employing dual current closed-loops[J]. Power System Protection and Control, 2016, 44(17): 52-57.
[9] Zhang Xiao, Tan Li, Xian Jiaheng, et al. Predictive current control algorithm for grid-connected inverter with LCL filter[J]. Transactions of China Electro- technical Society, 2019, 34(S1): 189-201.
[10] Su Xiaofang, Yuan Jiaxin, Xue Gang, et al. An immune-algorithm-based dead-time elimination hybrid space vector PWM control strategy in a three-phase inverter[J]. Transactions of China Electrotechnical Society, 2016, 31(16): 135-144.
[11] Zhou Leming, Luo An, Chen Yandong, et al. A single-phase grid-connected power control and active damping optimization strategy with LCL filter[J]. Transactions of China Electrotechnical Society, 2016, 31(6): 144-154.
[12] Ren Zipan, Lu Baochun, Zhao Yalong, et al. Research on modeling and simulation of photovoltaic virtual synchronous generator[J]. Power System Protection and Control, 2019, 47(13): 92-99.
[13] Dong Runnan, Liu Shi, Liang Geng, et al. Research on control method of special inverter in micro-grid based on model predictive control[J]. Power System Protection and Control, 2019, 47(21): 11-20.
[14] Cvetkovic I, Boroyevich D, Mattavelli P, et al. Unterminated small-signal behavioral model of DC-DC converters[J]. IEEE Transactions on Power Electronics, 2013, 28(4): 1870-1879.
[15] Raga C, Barrado A, Lázaro A, et al. Black-box model, identification technique and frequency analysis for pem fuel cell with overshooted transient response[J]. IEEE Transactions on Power Electronics, 2014, 29(10): 5334-5346.
[16] Valdivia V, Lazaro A, Barrado A, et al. Black-box modeling of three-phase voltage source inverters for system-level analysis[J]. IEEE Transactions on Industrial Electronics, 2012, 59(9): 3648-3662.
[17] Valdivia V, Barrado A, Lázaro A, et al. Black-box behavioral modeling and identification of DC-DC converters with input current control for fuel cell power conditioning[J]. IEEE Transactions on Indu- strial Electronics, 2013, 61(4): 1891-1903.
[18] Valdivia V, Todd R, Bryan F J, et al. Behavioral modeling of a switched reluctance generator for aircraft power systems[J]. IEEE Transactions on Industrial Electronics, 2013, 61(6): 2690-2699.
[19] Alqahtani A, Alsaffar M, El-Sayed M, et al. Data- driven photovoltaic system modeling based on nonlinear system identification[J]. International Journal of Photoenergy, 2016: 2923731.
[20] Kotsampopoulos P C, Lehfuss F, Lauss G F, et al. The limitations of digital simulation and the advantages of PHIL testing in studying distributed generation provision of ancillary services[J]. IEEE Transactions on Industrial Electronics, 2015, 62(9): 5502-5515.
[21] Maniatopoulos M, Lagos D, Kotsampopoulos P, et al. Combined control and power hardware in-the-loop simulation for testing smart grid control algorithms[J]. IET Generation, Transmission & Distribution, 2017, 11(12): 3009-3018.
[22] Kouro S, Leon J I, Vinnikov D, et al. Grid-connected photovoltaic systems: an overview of recent research and emerging PV converter technology[J]. IEEE Industrial Electronics Magazine, 2015, 9(1): 47-61.
[23] Wang X, Blaabjerg F, Wu W. Modeling and analysis of harmonic stability in an AC power-electronics- based power system[J]. IEEE Transactions on Power Electronics, 2014, 29(12): 6421-6432.
[24] Ljung L. Experiments with identification of conti- nuous time models[J]. IFAC Proceedings Volumes, 2009, 42(10): 1175-1180.
[25] Garnier H, Mensler M, Richard A. Continuous-time model identification from sampled data: implementa- tion issues and performance evaluation[J]. Inter- national Journal of Control, 2003, 76(13): 1337- 1357.
[26] Lourakis M. A brief description of the Levenberg- Marquardt algorithm implemented by levmar[J]. Foundation of Research and Technology, 2005, 4(1): 1-6.
[27] Gavin H. The Levenberg-Marquardt method for nonlinear least squares curve-fitting problems[C]// Department of Civil and Environmental Engineering, Duke University, 2011: 1-15.
[28] Nelles O. Nonlinear system identification: from classical approaches to neural networks and fuzzy models[M]. Berlin: Springer Science & Business Media, 2013.
[29] Yu H, Wilamowski B M. Levenberg-Marquardt training[J]. Industrial Electronics Handbook, 2011, 5(12): 8-13.
[30] Pourbeik P. Model user guide for generic renewable energy system models[J]. Electric Power Research Institute, 2015: 3002006525.
摘要 建立并网光伏发电系统的模型是研究其与电网交互过程的基础。光伏系统的暂态特性不仅受天气情况、电网工况等环境因素的影响,还取决于商用逆变器的内部结构以及控制策略,然而它们并不对外公开,这给系统的分析带来了困难。为了解决这个问题,该文提出一种基于暂态分析和系统辨识的光伏并网逆变器通用建模方法。将光伏逆变器视作内部结构以及控制算法未知的黑箱,通过先后施加扰动和测取响应并结合系统辨识的方法来建立其模型。以一个3kW的商用光伏逆变器为研究对象,搭建硬件在环实验系统来研究并验证这一建模方法。结果显示,在多种扰动对应的暂态过程中,模型的输出均准确地拟合了逆变器的实际输出,证明了这一建模方法的有效性。
关键词:光伏逆变器建模 系统辨识 传递函数 功率硬件在环
中图分类号: TM464
DOI: 10.19595/j.cnki.1000-6753.tces.200276
This work is partially supported by the Natural Science Foundation of China (51677050) and the China Scholarship Council.
Received March 19, 2020;
Revised May 25, 2020.
Notes Brief
Weng Gongyu male, born in 1992, master degree candidate. Major interests include modelling and testing of photovoltaic generation system, system identification.E-mail: wgongyu92@163.com
Mao Meiqin female, born in 1961, associate professor, M.S. advisor. Major interests include precision and super-precision measurement, modeling and control for electromechanical system.E-mail: mmqmail@163.com (Corresponding author)
(编辑 陈 诚)